You could use Epilog to put the labels there manually:
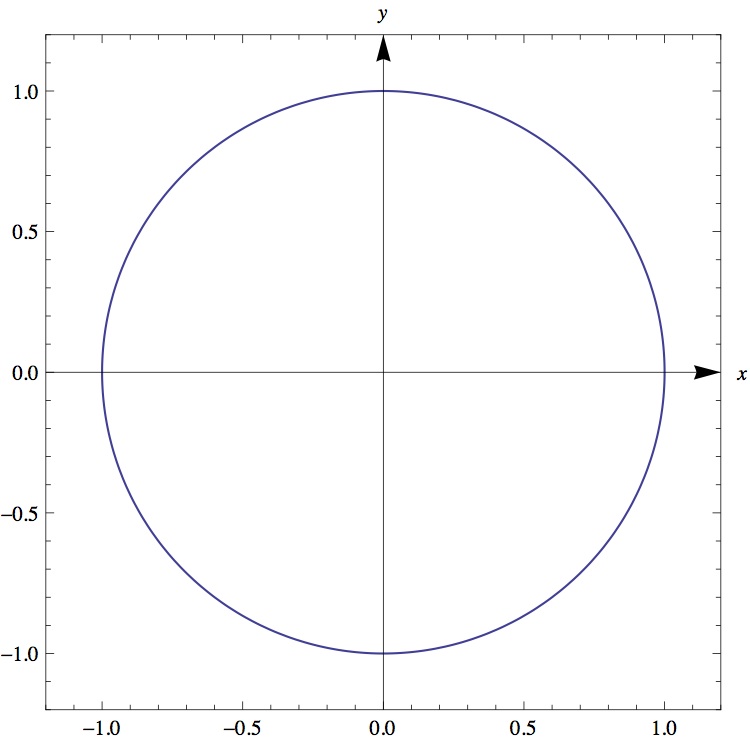
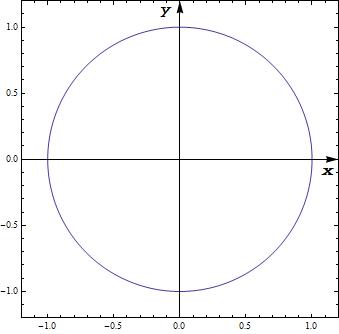
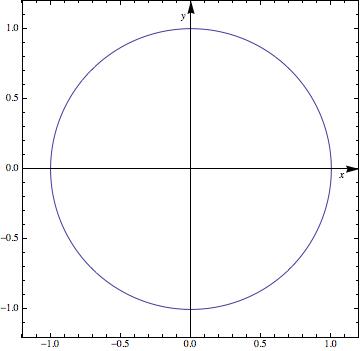
ParametricPlot[{Sin[t], Cos[t]}, {t, 0, 2 \[Pi]}, Frame -> True, AxesStyle -> Arrowheads[0.04], PlotRangePadding -> 0.2, Epilog -> {Inset["x", Scaled[{0.95, 0.48}]], Inset["y", Scaled[{0.48, 0.95}]]}]
I used Scaled so it doesn't matter how large the circle is (and works well with PlotRangePadding).
Asymmetrical Version - not yet profoundly tested
Based on Mr. Wizards comments, I thought about asymmetrical ideas. He showed how to "abuse" the arrowheads - I'll try something different here (note that the code can be optimized, but I keep it rather extensive to show what I was thinking):
What I do: I get the PlotRange, AxesOrigin and PlotRangePadding and calculate the position:
doPP[pp_] := Module[{plotRange, plotRangePadding, axes, offset}, plotRange = Extract[pp, Most /@ Position[pp, PlotRange]][[1, 2]]; plotRangePadding = {-Abs@#, Abs@#} &@ Extract[pp, Most /@ Position[pp, PlotRangePadding]][[1, 2]]; axes = Reverse@Extract[pp, Most /@ Position[pp, AxesOrigin]][[1, 2]]; offset = Rescale[#1, #2] & @@@ Transpose[{axes, plotRangePadding + # & /@ plotRange}]; Show[pp, Epilog -> {Inset["x", Scaled[{ 0.95, offset[[1]] - 0.02}]], Inset["y", Scaled[{offset[[2]] - 0.02, 0.95}]]}]]
where you can customize 0.02 and 0.95 to your liking (or set as options, parameters).
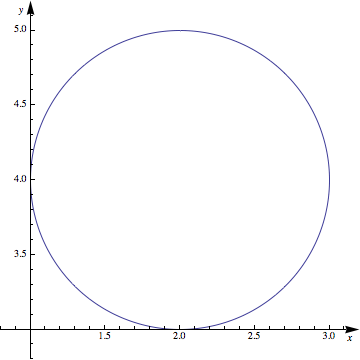
We can execute now:
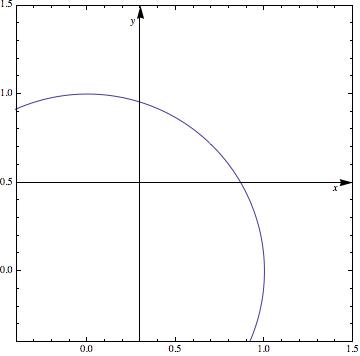
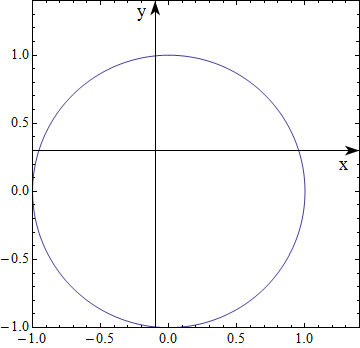
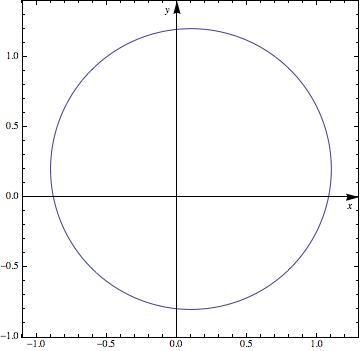
ParametricPlot[{Sin[t], Cos[t]}, {t, 0, 2 \[Pi]}, Frame -> True, AxesStyle -> Arrowheads[0.04], PlotRangePadding -> 0.2, AxesOrigin -> {0.3, 0.5}, PlotRange -> {-0.2, 1.3}] // doPP