5
$\begingroup$

Background

I have a set of binary test data of the form

data1 = {{0., 0.}, {0., 0.}, {0., 0.}, {0.5, 0.}, {0.5, 0.}, {0.5, 1.}, {1., 1.}, {1., 0.}, {1., 0.}, {1.5, 1.}, {1.5, 0.}, {1.5, 1.}, {2., 0.}, {2., 0.}, {2., 1.}, {2.5, 1.}, {2.5, 1.}, {2.5, 1.}, {3., 1.}, {3., 1.}, {3., 1.}} 

For convenience I will refer to the numbered pairs as $\{x_i,y_i\}$. Here $x_i$ can be e.g. velocity and $y_i$ can be hit $(1)$ or miss $(0)$. The dataset is just an example, so keep in mind that the sample size might be a bit small to obtain nice curve fits.

Since the data is binary it makes sense to perform a logistic regression. I will denote the first parameter (intercept) as $\alpha$ and the second parameter (gradient) as $\beta$. I can obtain such a fit by writing

logit = LogitModelFit[data1, x, x]; 

I can then plot my result and get various properties

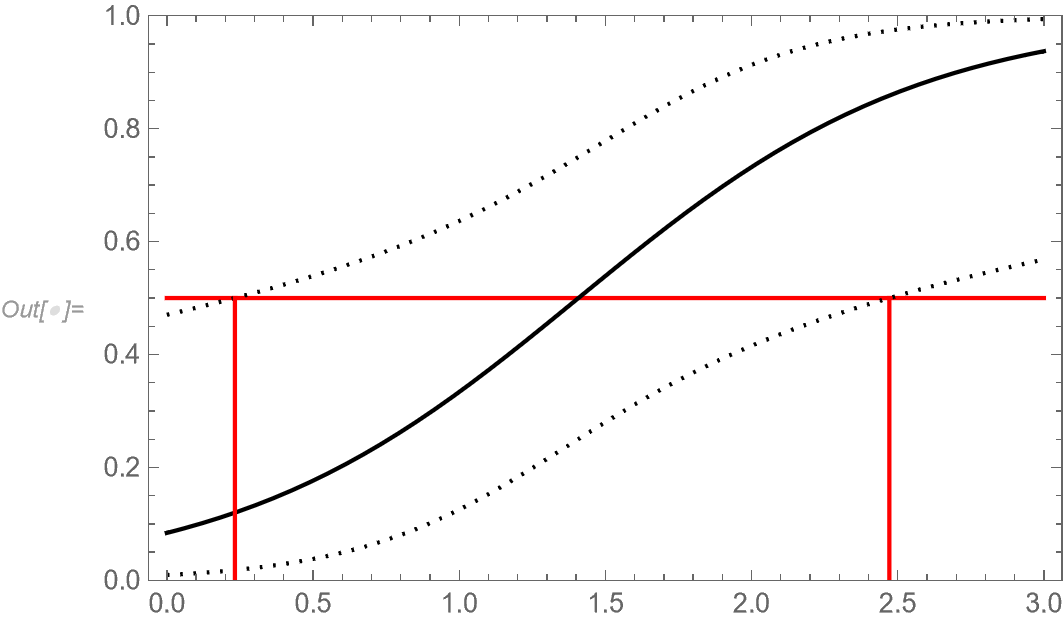
Show[ListPlot[data1], Plot[logit[x], {x, Min[data1[[All, 1]]] - 1,Max[data1[[All, 1]]] + 1}], PlotRange -> All] Normal[logit] logit["ParameterConfidenceIntervalTable"] logit["CovarianceMatrix"] // MatrixForm logit["Properties"] 

A related post: How can I compute and plot the 95% confidence bands for a fitted logistic regression model? nicely covers how to obtain 95% confidence intervals for the output probabilities, i.e. the $y_i$.

Question

However, there are situations where it is e.g. interesting to have the corresponding 95% confidence intervals for all the $x_i$ data values instead. My question is how can we calculate the 95% confidence interval for all of the $x_i$ data?

Attempts

1

My first thought was that this could be obtained by simply writing something like

cov = logit["CovarianceMatrix"]; SE = Sqrt[{1,x}.cov.{1,x}]; xLower = x - 1.96*SE; xUpper = x + 1.96*SE; 

for an individual $x_i$. However, I suspect the interpretation of the standard error (SE above) is then actually the standard error in the sum $\alpha + \beta x$.

2

Next I guessed that what I actually need is the standard error of an individual $x_i$, such that I can still write something like this:

xLower = x - 1.96*SE; xUpper = x + 1.96*SE; 

for an individual $x_i$. My first thought was to pick the standard error as $\text{SE} = 1/\beta$ as this represents the width of the logistic distribution function as explained here https://stats.stackexchange.com/questions/403575/how-is-logistic-regression-related-to-logistic-distribution as well as in other references. My issue with this is of course that the confidence interval is constant, regardless of which $x_i$ are actually measured. I would imagine the confidence interval to be slimmer around $x_i$ with many datapoints, and thicker around $x_i$ with fewer datapoints.

3

I run into the same sort of issue (constant width of confidence interval) if I solve the inequality $$\alpha + \beta x - 1.96 \sqrt{(1,x).\text{cov}.(1,x)}<\alpha + \beta x < \alpha + \beta x + 1.96 \sqrt{(1,x).\text{Cov}.(1,x)}$$ with respect to $x$.

Question

So to reiterate my question is: what is the proper way to calculate a reasonable behaved 95% confidence interval for the datapoints $x_i$ for a logistic distribution in mathematica?

$\endgroup$
1
  • 2
    $\begingroup$ What you're looking for is a "calibration interval" or "inverse regression" (and inverse regression is NOT just switching the response and predictor variable). You might consider asking this question at CrossValidated (stats.stackexchange.com) but without your 3 attempts to find out what should be done and then if necessary back here for implementation. $\endgroup$ Commented Aug 29, 2022 at 15:00

1 Answer 1

6
$\begingroup$

If the question is to find an approximate 95% confidence interval for the velocity (x) that will produce a specified proportion of hits (p), then the following should be what you need. This is a "calibration interval" (and sometimes called "inverse regression"). This is used in bioassays such as finding confidence intervals for the ED50 (Effective Dose that is successful 50% of the time).

data1 = {{0., 0.}, {0., 0.}, {0., 0.}, {0.5, 0.}, {0.5, 0.}, {0.5, 1.}, {1., 1.}, {1., 0.}, {1., 0.}, {1.5, 1.}, {1.5, 0.}, {1.5, 1.}, {2., 0.}, {2., 0.}, {2., 1.}, {2.5, 1.}, {2.5, 1.}, {2.5, 1.}, {3., 1.}, {3., 1.}, {3., 1.}}; (* Fit logistic regression model *) lmf = LogitModelFit[data1, x, x]; (* Get estimated parameters and associated covariance matrix *) parms = lmf["BestFitParameters"]; cov = lmf["CovarianceMatrix"]; (* Pick a probability p to find an approximate 95% confidence interval for x *) p = 0.5; (* Find approximate lower and upper 95% confidence intervals *) lower = t /. Solve[1 - 1/(1 + Exp[parms . {1, t} + 1.96 Sqrt[{1, t} . cov . {1, t}]]) == p, t][[1]] (* 0.232866 *) upper = t /. Solve[1 - 1/(1 + Exp[parms . {1, t} - 1.96 Sqrt[{1, t} . cov . {1, t}]]) == p, t][[1]] (* 2.47135 *) Show[Plot[{p, 1 - (1/(1 + Exp[parms . {1, x}])), 1 - 1/(1 + Exp[parms . {1, x} - 1.96 Sqrt[{1, x} . cov . {1, x}]]), 1 - 1/(1 + Exp[parms . {1, x} + 1.96 Sqrt[{1, x} . cov . {1, x}]])}, {x, 0, 3}, PlotRange -> {All, {0, 1}}, Frame -> True, PlotStyle -> {Red, Black, {Black, Dotted}, {Black, Dotted}}], ListPlot[{{{lower, 0}, {lower, p}}, {{upper, 0}, {upper, p}}}, Joined -> True, PlotStyle -> Red]] 

Fitted curve and confidence intervals

The intervals tend to be wider than what one might first imagine or desire but that's the way it works.

$\endgroup$
2
  • 1
    $\begingroup$ And depending on the data, one can get $-\infty$ and/or $+\infty$ for the confidence limits. $\endgroup$ Commented Aug 29, 2022 at 19:56
  • $\begingroup$ Thanks for the answer. This also seems like a natural way to do it. Initially, I was hesitant to define it this way because in the solution for the upper and lower limit the term $\log\left(\frac{p}{1-p}\right)$ shows up which diverges as $p$ approaches either $1$ or $0$. It seems to cause difficulty if we're interested in e.g ED90 instead of ED50. Do you have a comment for this limit? I'm not trying to be picky on your answer or anything, just trying to understand whats going on. $\endgroup$ Commented Aug 30, 2022 at 7:21

Start asking to get answers

Find the answer to your question by asking.

Ask question

Explore related questions

See similar questions with these tags.