2
$\begingroup$

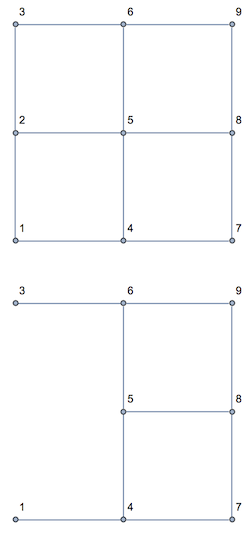
Take a simple GridGraph:

g = GridGraph[{3, 3}, VertexLabels -> "Name", ImageSize -> 150, ImagePadding -> 10] 

g

I am puzzled by the following behavior:

Try to delete vertex 2:

h=VertexDelete[g, 2] 

vd

Vertex 2 was deleted, but so were several edges that did not have a node at vertex 2. In addition, Vertex 1 appears to be connected to vertex 3; it wasn't before.

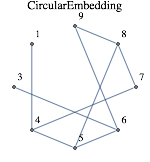
Now look at the remaining edges:

EdgeList[h] 

{1 [UndirectedEdge] 4, 3 [UndirectedEdge] 6, 4 [UndirectedEdge] 5, 4 [UndirectedEdge] 7, 5 [UndirectedEdge] 6, 5 [UndirectedEdge] 8, 6 [UndirectedEdge] 9, 7 [UndirectedEdge] 8, 8 [UndirectedEdge] 9}

According to the edge list, Vertex 1 is not connected to vertex 3 (even though it was draw as connected to 3); but vertex 1 is connected to vertex 4 (even though it was not so drawn).


Try deleting vertices 1 and 3:

VertexDelete[g, {1, 3}] 

vd2

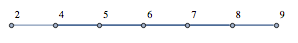
Either I am misunderstanding something or Mathematica is erring. Can anyone explain which is the case?

Thanks.

$\endgroup$

3 Answers 3

5
$\begingroup$

Bill's explanation is good. I would also recommend preserving the original grid layout to see things clear:

g = GridGraph[{3, 3}, VertexLabels -> "Name", ImagePadding -> 15] h = SetProperty[VertexDelete[g, #], VertexCoordinates -> Delete[GraphEmbedding[g], #]] &@2 

enter image description here

$\endgroup$
4
  • $\begingroup$ Useful suggestion. I'm hoping to delete several vertices and then add some extra edges to the grid graph. Not sure how to proceed. $\endgroup$ Commented Jan 5, 2014 at 5:50
  • $\begingroup$ @David Related thread: Keeping vertexcoordinates after adding a new vertex $\endgroup$ Commented Jan 6, 2014 at 13:48
  • $\begingroup$ Thanks, István. The thread seems very useful. $\endgroup$ Commented Jan 6, 2014 at 13:54
  • $\begingroup$ I tested this on a graph, removal of many vertices and structure not preserved so problems: can you preview it here? Thank you in advance. $\endgroup$ Commented Feb 1, 2016 at 11:06
4
$\begingroup$

You can see what is going on by changing the arrangement of the vertices. Here is your g with a circular structure:

g = GridGraph[{3, 3}, VertexLabels -> "Name", ImageSize -> 150, ImagePadding -> 10, GraphLayout -> "CircularEmbedding", PlotLabel -> "CircularEmbedding"] 

enter image description here

Now for the h:

h = VertexDelete[g, 2] 

enter image description here

Now the picture more accurately reflects the structure you expect to see from the EdgeList. The problem is basically that the straight lines connecting 1 and 4 happen to pass through 3 in the default arrangement.

$\endgroup$
1
  • $\begingroup$ So, I was seeing an optical illusion! Thanks for clearing up the mystery. $\endgroup$ Commented Jan 5, 2014 at 5:36
1
$\begingroup$

More detailed explanation:

GridGraph produces a graph with GraphLayout property

g = GridGraph[{3, 3}, VertexLabels -> "Name", ImageSize -> 150, ImagePadding -> 10]; PropertyValue[g, GraphLayout] 

{"GridEmbedding", "Dimension" -> {3, 3}}

VertexDelete conserved this property

h = VertexDelete[g, 2]; PropertyValue[h, GraphLayout] 

{"GridEmbedding", "Dimension" -> {3, 3}}

However, now this embedding is incorrect. You can save vertex positions as in Vitaliy Kaurov's answer. Another method is deleting GraphLayout property:

SetProperty[h, GraphLayout -> Automatic] 

enter image description here

$\endgroup$
0

Start asking to get answers

Find the answer to your question by asking.

Ask question

Explore related questions

See similar questions with these tags.