5
$\begingroup$

I know this question came up so many times, but after browsing through many of the threads, I'm still not sure, if I'm doing it correctly with my dataset, so I'll give it a try.

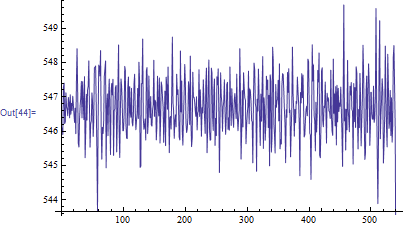
If have some sample data I know not much about. You can download it here

enter image description here

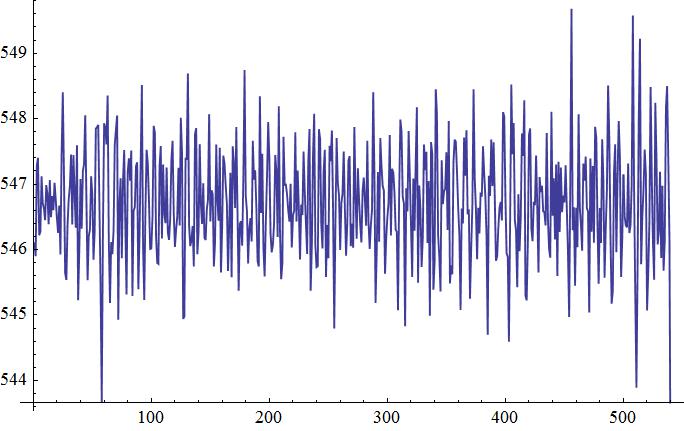
Now I want to look for possible dominant frequencies and it tried it like this:

ListLinePlot[Log[10, Abs[Fourier[data]]], PlotRange -> Automatic] 

and I get this:

enter image description here

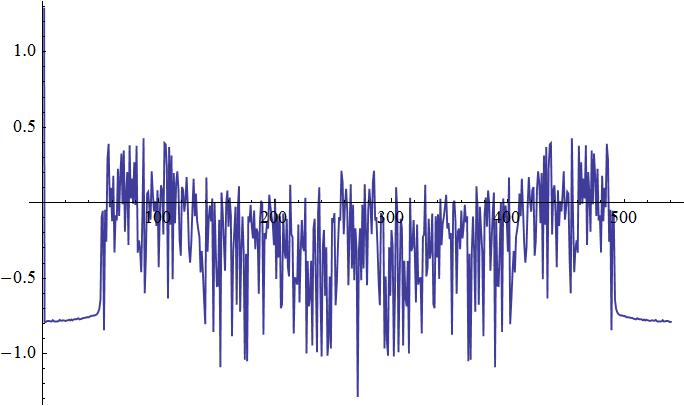
Correct me if I'm wrong, but I don't see any dominant frequencies in here. Do you guys come to the same conclusion? Honestly, I think I'm doing it all wrong because I'm really not sure which of the many functions of mathematica to use.

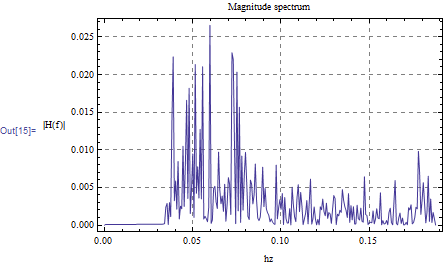
EDIT: Now I'm totally confused. I just looked again in some of my books and what they did there was drawing the frequencies on the x-Axes and the Power on the y-Axes. Then they normalised it to the total power. How to do this?

$\endgroup$
6
  • $\begingroup$ What was the sampling frequency? $\endgroup$ Commented Feb 3, 2014 at 10:54
  • $\begingroup$ @Nasser: It's data from an fMRI scan. So a scan was done every 2800 ms. Sorry, I'm just trying to get more into this stuff :/ $\endgroup$ Commented Feb 3, 2014 at 11:07
  • $\begingroup$ Ok, so fs=0.357 hz? (1/2.8) $\endgroup$ Commented Feb 3, 2014 at 11:14
  • $\begingroup$ btw, this looks like a very low sample rate. You can adjust the code below if you think it is different. 0.357 samples per second is very low but you can check it on your end. If you meant it was 2800 samples per second, then change fs below to 2800. $\endgroup$ Commented Feb 3, 2014 at 11:25
  • $\begingroup$ I'm not really sure, but every 2,8 sec a scan was done, i.e. data was collected..so the sampling rate must be 2,8 sec? $\endgroup$ Commented Feb 3, 2014 at 11:38

1 Answer 1

10
$\begingroup$

Assuming sample rate is 2.8 second per sample, then may be this:

SetDirectory[NotebookDirectory[]]; data = Import["testdata.txt", "List"]; ListPlot[data, Joined -> True] 

Mathematica graphics

py = Fourier[data, FourierParameters -> {1, -1}]; nSamples = Length[data]; nUniquePts = Ceiling[(nSamples + 1)/2]; py = py[[1 ;; nUniquePts]]; py = Abs[py]; py[[1]] = 0; (*zero out the DC frequency, for now, outliner, messes up the scale *) py = py/nSamples; py = py^2; If[OddQ[nSamples], py[[2 ;; -1]] = 2*py[[2 ;; -1]], py[[2 ;; -2]] = 2*py[[2 ;; -2]]]; fs = 0.357; (*2.8 second per sample*) f = (Range[0, nUniquePts - 1] fs)/nSamples; ListPlot[Transpose[{f, py}], Joined -> True, FrameLabel -> {{"|H(f)|", None}, {"hz", "Magnitude spectrum"}}, ImageSize -> 400, Frame -> True, RotateLabel -> False, GridLines -> Automatic, GridLinesStyle -> Dashed, PlotRange -> All] 

Mathematica graphics

The above is the magnitude spectrum. So you can see now where the frequencies with most energy are.

$\endgroup$
16
  • $\begingroup$ Quick question: Is all this method with py and nUniquePts a commonly used thing? $\endgroup$ Commented Feb 3, 2014 at 11:40
  • 1
    $\begingroup$ @Öskå I do not know if it very commonly used t, but I use this method all the time. In Matlab some use this method. localhost/my_notes/mma_matlab_control/KERNEL/… $\endgroup$ Commented Feb 3, 2014 at 11:43
  • $\begingroup$ Thank you @Nasser! Why is it that you did not use Fourier or some similar function? I mean..where is the fouriertransform in all this? $\endgroup$ Commented Feb 3, 2014 at 11:44
  • $\begingroup$ I guess "localhost" has to be replaced by "12000.org" :) $\endgroup$ Commented Feb 3, 2014 at 11:45
  • 1
    $\begingroup$ @holistic if you mean the py/nSamples then this is something commonly done, to average the power. Its been a while since I did dsp, so I do not remember the details now. But the above is a common way to do it (scale the psd by number of samples). $\endgroup$ Commented Feb 3, 2014 at 12:55

Start asking to get answers

Find the answer to your question by asking.

Ask question

Explore related questions

See similar questions with these tags.