As far as I know the specific output format of Plot (and similar commands) is not documented. I believe it has changed between versions therefore any post-processing (such as your replacement rule) must be considered potentially version dependent.
As Michael comments above the documentation does state:
Plot normally returns Graphics[{Line[...],...}].
With a Filling specification given, Plot returns Graphics[{GraphicsComplex[...], ...}].
This tells you the basic format and informs you that GraphicsComplex may be used, therefore you should at least account for that in your post-processing.
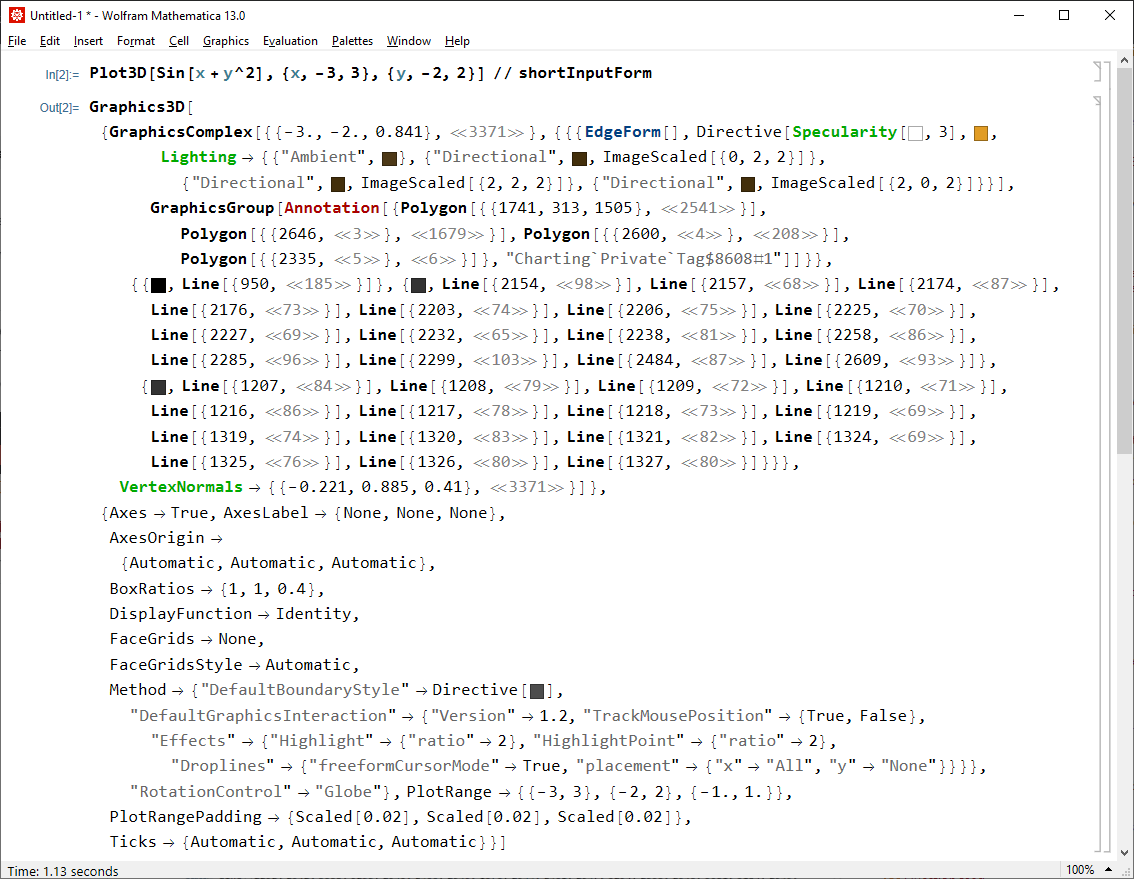
Typically the best way to learn the output form of such functions is to view it yourself using InputForm. You can use Short or Shallow to limit the size of the expression returned:
Shallow[ Plot[{x, 2 x}, {x, 1, 5}] // InputForm, {100, 10} ]
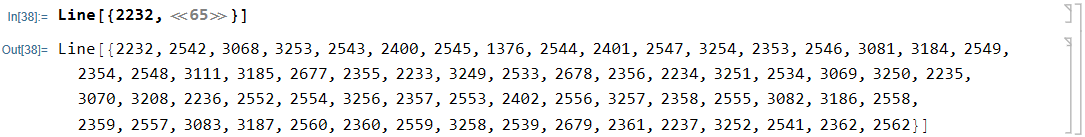
You can also replace parts you don't want to view, e.g. Line objects:
Plot[{x, 2 x}, {x, 1, 5}] /. _Line :> "Line[]" // InputForm
Everything in the output expression can be manipulated, including Graphics primitives and options. See:
Some aspects of Plot are not obvious or intuitive such as details of the styling chosen. See:
And as linked from my answer there:
Plot with arrows
You asked specifically about adding arrowheads to plot lines. Although post-processing is the only approach I know for this, meaning I am not aware of an option for Plot itself, I think it is a good method and I have used it many times.
The syntax for Line and Arrow is similar, and both work with GraphicsComplex, therefore the replacement should be reliable. However to make the replacement more robust you should focus it only on the part of the Graphics object that will contain Plot-generated Line expressions, since for example a Prolog or Epilog might also contain Line expressions. Here with MapAt:
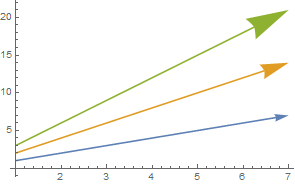
MapAt[# /. Line -> Arrow &, Plot[{x, 2 x, 3 x}, {x, 1, 7}], 1]
Or if you have version 10, the operator form:
arrows = MapAt[# /. Line -> Arrow &, 1]; Plot[{x, 2 x, 3 x}, {x, 1, 7}] // arrows
Worth noting is that even though (AFAIK) you cannot generate Arrow expression from within Plot you can still provide style directives that will take affect after the replacement:
Plot[{x, 2 x, 3 x}, {x, 1, 7}, PlotStyle -> Array[Arrowheads[#/20] &, 3] ] // arrows
Plot,Plotnormally returnsGraphics[{Line[...],...}]. See the last two bullet points under "Details and Options." $\endgroup$LineI think I understand the workings of the/.Line->Arrow. $\endgroup$Plot. $\endgroup$