Edit: This question closely related to one asked on Stack Overflow before the existence of Mathematica.SE. Please see this link for the history and examples:
See also:
The first Q&A references a use of the Ordering method shown below from 2007 on MathGroup:
(Thanks to belisarius for helping me find this.)
From your declaration "Contries(sic) are the same for sure." follows:
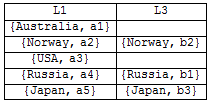
L1 = {{"IsleOfMan", 1}, {"Samoa", 2}, {"Tunisia", 3}, {"Svalbard", 4}, {"NewCaledonia", 5}}; L2 = {{"Tunisia", 1}, {"NewCaledonia", 2}, {"IsleOfMan", 3}, {"Svalbard", 4}, {"Samoa", 5}}; GatherBy[L1 ~Join~ L2, First][[All, 2]]
{{"IsleOfMan", 3}, {"Samoa", 5}, {"Tunisia", 1}, {"Svalbard", 4}, {"NewCaledonia", 2}}
Or correcting eldo's attempt as using Ordering:
Sort[L2][[Ordering @ Ordering @ L1]]
{{"IsleOfMan", 3}, {"Samoa", 5}, {"Tunisia", 1}, {"Svalbard", 4}, {"NewCaledonia", 2}}
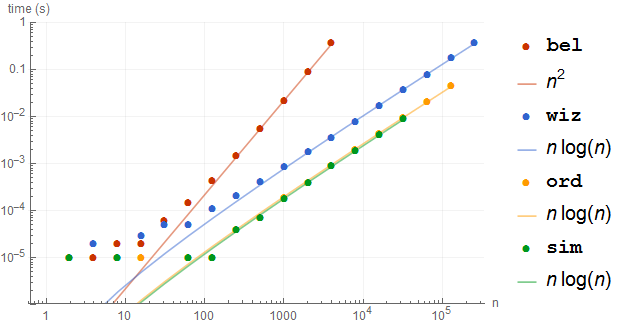
Both are much faster than belisarius's method, with Ordering being particularly good:
Edit: Now including Simon Woods' recommendation from the comments as sim.
bel[{l1_, l2_}] := {#, # /. Rule @@@ l2} &[l1[[All, 1]]] // Transpose wiz[{L1_, L2_}] := GatherBy[L1 ~Join~ L2, First][[All, 2]] ord[{L1_, L2_}] := Sort[L2][[Ordering @ Ordering @ L1]]; sim[{L1_, L2_}] := L2[[ Ordering[L2][[Ordering @ Ordering @ L1]] ]] gen[n_] := Table[{RandomSample @ Range @ n, Range @ n}\[Transpose], {2}] Needs["GeneralUtilities`"] BenchmarkPlot[{bel, wiz, ord, sim}, gen, 2^Range[20], "IncludeFits" -> True, ImageSize -> 500, PlotRange -> {Automatic, {1*^-6, 1}}]