3
$\begingroup$

I find the ColorFunction in BarLegend behaves very weirdly:

  1. Force rescaling from 0 to 1

    For example:

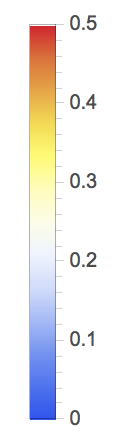
    cf1[z_] := ColorData[{"Temperature", {0, 1}}][z]; BarLegend[{cf1[#] &, {0, .5}}] 

    gives

  2. Rescaling changes within MatrixPlot

    For example:

    MatrixPlot[RandomReal[{1, 4}, {10, 10}], PlotLegends -> BarLegend[{"Temperature", {1, 4}}], ColorFunction -> (ColorData[{"Temperature", {1, 4}}][#] &), ColorFunctionScaling -> False, DataReversed -> True] 

    gives

  3. However, generating BarLegend alone as follows:

    BarLegend[{"Temperature", {1, 4}}] 

    gives

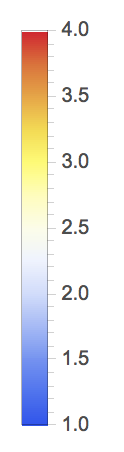
Obviously, ColorFunctionScaling in BarLegend has been set to False accordingly as in MatrixPlot, which is unexpected since I have no control of the scaling inside BarLegend.

Questions:

Is the auto-rescaling a bug?
Or, how can I "utilize" the feature?

$\endgroup$
3
  • $\begingroup$ closely related: 5478 $\endgroup$ Commented Nov 29, 2014 at 22:28
  • $\begingroup$ @Kuba,please don't close this thread. Although this question is related to what you posed, the problem behind the question still exists. At least, this behavior is very unexpected according to the official documentation. $\endgroup$ Commented Nov 29, 2014 at 22:51
  • $\begingroup$ Hi @Kuba, I mistakenly read your comments as "closed":P $\endgroup$ Commented Nov 29, 2014 at 23:03

1 Answer 1

2
$\begingroup$
MatrixPlot[RandomReal[{1, 4}, {10, 10}], PlotLegends -> BarLegend[{ColorData[{"Temperature", {1, 4}}], {1, 4}}], ColorFunction -> (ColorData[{"Temperature", {1, 4}}]), ColorFunctionScaling -> False, DataReversed -> True] 

Version 9.0.1.0:

enter image description here

Version 10.0.1.0 (Wolfram Programming Cloud):

enter image description here

Update: PlotLegends -> BarLegend[{ColorData[{"Temperature", {1, 4}}], {1, 4}}, 10] does not work as expected to add contours in the bar legend; it rescales the tick labels to {0,1}. A work-around is to use Legended:

Legended[MatrixPlot[RandomReal[{1, 4}, {10, 10}], ColorFunction -> (ColorData[{"Temperature", {1, 4}}]), ColorFunctionScaling -> False, DataReversed -> True], BarLegend[{ColorData[{"Temperature", {1, 4}}], {1, 4}}, 10]] 

enter image description here

Update 2: version 11.3 (Wolfram Programming Cloud)

$Version 

"11.3.0 for Linux x86 (64-bit) (February 20, 2018)"

 MatrixPlot[RandomReal[{1, 4}, {10, 10}], PlotLegends -> BarLegend[{ColorData[{"Temperature", {1, 4}}], {1, 4}}], ColorFunction -> (ColorData[{"Temperature", {1, 4}}]), ColorFunctionScaling -> False, DataReversed -> True] 

enter image description here

Use BarLegend[{ColorData[{"Temperature", {1, 4}}], {1, 4}}, 10] to get enter image description here

$\endgroup$
6
  • $\begingroup$ Hi @kguler, if I want to add nicely-divided contours in the BarLegend, how to do it? I tried: MatrixPlot[RandomReal[{1, 4}, {10, 10}], PlotLegends -> BarLegend[{ColorData[{"Temperature", {1, 4}}], {1, 4}}, 10], ColorFunction -> (ColorData[{"Temperature", {1, 4}}][#] &), ColorFunctionScaling -> False, DataReversed -> True]. However, this will again be rescaled to {0,1}. $\endgroup$ Commented Nov 29, 2014 at 22:34
  • $\begingroup$ @sunt05, i get the same issue with version 9.0.1. A work-around is to use Legended. I will post an update in a moment.. $\endgroup$ Commented Nov 29, 2014 at 22:57
  • $\begingroup$ Hi @kguler, Legended does work for this scenario. But I seriously consider this as a bug, at least very vague usage as stated in the documentation. $\endgroup$ Commented Nov 29, 2014 at 22:59
  • $\begingroup$ @sunt05, i agree. $\endgroup$ Commented Nov 29, 2014 at 23:03
  • $\begingroup$ thanks for your answer anyway, @kguler. Let's see if someone from WRI will clarify this. $\endgroup$ Commented Nov 29, 2014 at 23:06

Start asking to get answers

Find the answer to your question by asking.

Ask question

Explore related questions

See similar questions with these tags.