8
$\begingroup$

In a recent project, I found out that there is a big limitation when using Graphics3D to construct objects - it lacks the ability to construct objects with holes in them. For example, we can get a regular wall-like Graphics3D object with the Cuboid primitive, but we can not get a wall with a window. Like this one enter image description here

Naturally, a Boolean operation is the way to go. But, in Mathematica the functions belonging to Boolean operations class, like RegionUnion and RegionIntersection can not be used in Graphics3D

Is there a way to construct Graphics3D objects with holes in them ?

$\endgroup$
5
  • 5
    $\begingroup$ related Q/A How to make overlapped part to be transparent? $\endgroup$ Commented Jan 28, 2015 at 10:38
  • 2
    $\begingroup$ @kguler nice. To answer OP question, then one can just do cub1 = Cuboid[{0, 0, 0}, {20, 2, 20}]; cub2 = Cuboid[{12, 0, 8}, {17, 2, 17}]; r2 = RegionDifference[cub1, cub2]; RegionPlot3D[r2] !Mathematica graphics but the edges need some work. Original question at community.wolfram.com/groups/-/m/t/430092?p_p_auth=EAP2rQun $\endgroup$ Commented Jan 28, 2015 at 11:08
  • $\begingroup$ that post at wolfram is also mine. thanks for your suggestion very much! $\endgroup$ Commented Jan 28, 2015 at 11:17
  • $\begingroup$ I have responded to the question on Community. $\endgroup$ Commented Jan 28, 2015 at 14:07
  • $\begingroup$ Actually just wrap Show around mesh object. See the Community link I posted - there are mo answers there. $\endgroup$ Commented Jan 28, 2015 at 17:54

2 Answers 2

8
$\begingroup$

This is a repost of Wolfram Community answer


Let's start from your code:

cub1 = Cuboid[{0, 0, 0}, {20, 2, 20}]; cub2 = Cuboid[{12, 0, 8}, {17, 2, 17}]; Graphics3D[{cub1, cub2}]; reg = DiscretizeRegion[RegionDifference[cub1, cub2]] 

You have a lot of tetrahedrons:

MeshCells[reg, 3] // Length 

10093

And a lot of polygons:

MeshCells[reg, 2] // Length 

22096

You do not need all that for visual, - so get the surface (boundary):

surface = BoundaryDiscretizeRegion[reg]; polygons = MeshCells[surface, 2]; polygons // Length 

3820

Now so few polygons! Get the coordinates of the mesh too:

points = MeshCoordinates[surface]; points // Length > 1910 

And here you go:

Graphics3D[{EdgeForm[Gray], GraphicsComplex[points, Polygon[polygons /. Polygon[x_] -> x]]}, Boxed -> False, Lighting -> "Neutral"] 

enter image description here

$\endgroup$
3
  • $\begingroup$ Why not use BoundaryDiscretizeRegion instead of DiscretizeRegion? (You get even fewer polygons.) $\endgroup$ Commented Jan 28, 2015 at 14:33
  • $\begingroup$ @MichaelE2 sure just was in a Rush ;) $\endgroup$ Commented Jan 28, 2015 at 14:59
  • $\begingroup$ This is not working in MM 12.1.1 I get an error "A non-degenerate region is expected at position..." Any thoughts? $\endgroup$ Commented Jun 23, 2020 at 12:33
8
$\begingroup$

Here's one way.

I'm going to use the contourRegionPlot3D function from here. I include the function definition here for convenience:

contourRegionPlot3D[region_, {x_, x0_, x1_}, {y_, y0_, y1_}, {z_, z0_, z1_}, opts : OptionsPattern[]] := Module[{reg, preds}, reg = LogicalExpand[region && x0 <= x <= x1 && y0 <= y <= y1 && z0 <= z <= z1]; preds = Union@Cases[reg, _Greater | _GreaterEqual | _Less | _LessEqual, -1]; Show @ Table[ContourPlot3D[ Evaluate[Equal @@ p], {x, x0, x1}, {y, y0, y1}, {z, z0, z1}, RegionFunction -> Function @@ {{x, y, z}, Refine[reg, p] && Refine[! reg, ! p]}, opts], {p, preds}]] 

Now create a region from the Graphics3D objects:

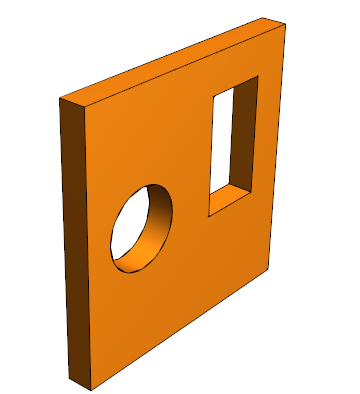
c1 = Cuboid[{0, 0, 0}, {20, 2, 20}]; c2 = Cuboid[{12, 0, 8}, {17, 2, 17}]; c3 = Cylinder[{{5, -1, 10}, {5, 2, 10}}, 3]; reg = Fold[RegionDifference, c1, {c2, c3}]; 

Use RegionMember to turn this into inequalities:

ineqs = Rest @ RegionMember[reg, {x, y, z}] 

0 <= x <= 20 && 0 <= y <= 2 && 0 <= z <= 20 && ! (12 <= x <= 17 && 0 <= y <= 2 && 8 <= z <= 17) && ! (0 <= (1 + y)/3 <= 1 && (-5 + x)^2 + (-10 + z)^2 <= 9)

And then:

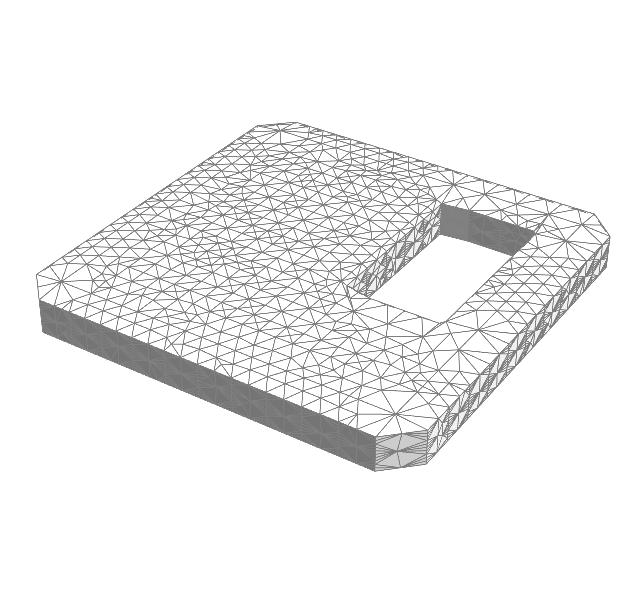
contourRegionPlot3D[ineqs, {x, 0, 20}, {y, 0, 2}, {z, 0, 20}, Mesh -> None, BoxRatios -> Automatic, PlotRange -> All, Boxed -> False, Axes -> False] 
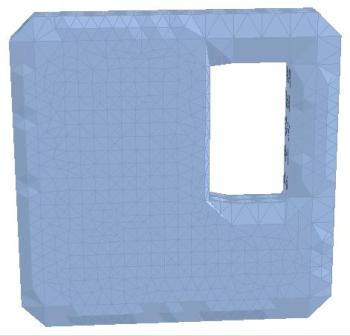
enter image description here

$\endgroup$

Start asking to get answers

Find the answer to your question by asking.

Ask question

Explore related questions

See similar questions with these tags.