I would like to produce a graphic like this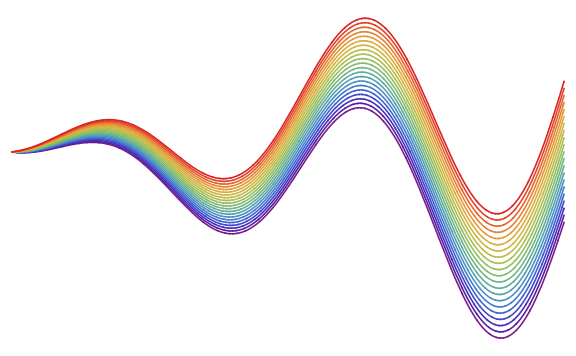
but with a continous color gradient between the outer curves.
Is it possible to achieve this by using the Filling option?
Code for the sake of completeness:
Plot[ Evaluate@Table[(Sin[x]+o)*x,{o,-0.5,0.5,0.05}],{x,0,4*Pi}, PlotStyle->Table[ColorData["Rainbow", i/20], {i,0,20}], ImageSize->Large, Axes->False ] 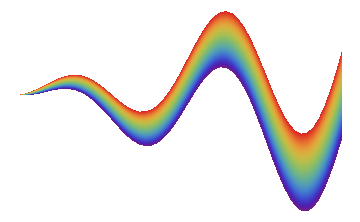
Fillingdocumentation under the Scope -> Filing Style. I would start there. $\endgroup$Plot[{x (Sin[x] - .5), x (Sin[x] + .5)}, {x, 0, 4 Pi}, Filling -> {1 -> {2}}, ColorFunction -> Function[{x, y}, GrayLevel[(y - x (Sin[x] - .5))/x]], ColorFunctionScaling -> False]. But you're right, it won't work for a rainbow colour scheme, even though it does for grayscale. The reason is that it will only use linear interpolation between the two RGB colours on the upper an lower points. This interpolation (done byVertexColors) doesn't care about colour schemes, can't have all rainbow colours. $\endgroup$Filling. +1! $\endgroup$Fillingdoes not have any similar examples. Is this a new feature in 10.2? $\endgroup$