How can I align tick labels so the tick label text ends centered under the data point? Of Course it works fine with a rotation of 90 Degrees, but not with 45 or similar angles.
I see an example of how to do this charts but not with Plot or ListPlot https://mathematica.stackexchange.com/a/2656/388
d = Table[n, {n, 10}]; xticks = Table[{n, Rotate["The y value is " <> ToString[n], 45 Degree]}, {n, d}]; ListPlot[d, Frame -> True, FrameTicks -> {{Automatic, None}, {xticks, None}}] 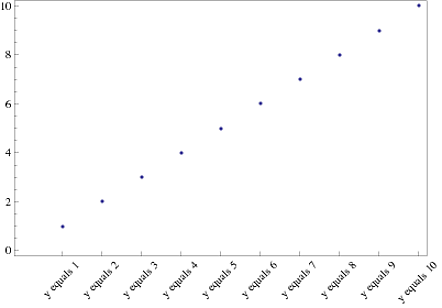
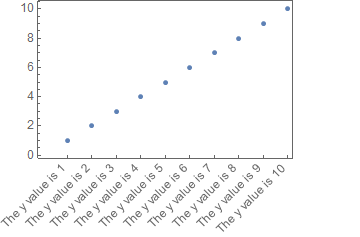
xticks = Table[{n, Rotate["The y value is " <> ToString[n], 45 Degree], {0, 0.2}}, {n, d}];and you'll see that it intersects the text at its midpoint $\endgroup$