I'm trying to combine graphics using Grid such that I have a ListPlot[] in the middle and a histogram on the top and right axes. I am 95% there, but can't figure how to git rid of the white space between the top histogram and the ListPlot. If I set Spacings -> {-0.15, -1} I begin to lose the bottom of the histogram and still have white space.
Here's a minimal working example:
data = RandomReal[ BinormalDistribution[{0, 0}, {1, 1}, 0.5], 50]; histData1 = GetColumn[data, 1]; histData2 = GetColumn[data, 2]; (histPlot1 = Histogram[histData1, 15, BarOrigin -> Bottom, FrameTicks -> {None, {1, 5, 10}}, Frame -> {False, True, False, False}, AspectRatio -> 1/5, ImageSize -> 250, ImagePadding -> {{48, 0}, {10, 0}}, PlotLabel -> "PlotLabel", FrameLabel -> {None, "Count"} ]); listPlot = ListPlot[data, PlotRange -> All, FrameLabel -> {"X", "Y", None, None}, Frame -> True, PlotRegion -> {{0, 1}, {0, 1}}, ImagePadding -> {{Automatic, Automatic}, {Automatic, 2}}, ImageMargins -> {{0, 0}, {0, 0}} ]; (histPlot2 = Histogram[histData2, 12, BarOrigin -> Left, ImagePadding -> {{1, 0}, {62.5, 30}}, FrameLabel -> { "Count", None}, FrameTicks -> {{1, 3, 5, 7}, None} ]); grid = Grid[{ {Show[histPlot1 ], Null}, {Show[listPlot, ImageSize -> 250], Show[histPlot2, AspectRatio -> 3]} }, Spacings -> {-0.15, -1}]; Print[grid] Which produces something like,
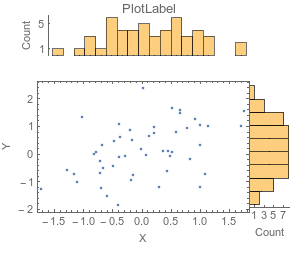
Again, I want to have the top histogram's bottom axis sit on the top of the ListPlot[] Frame.