4

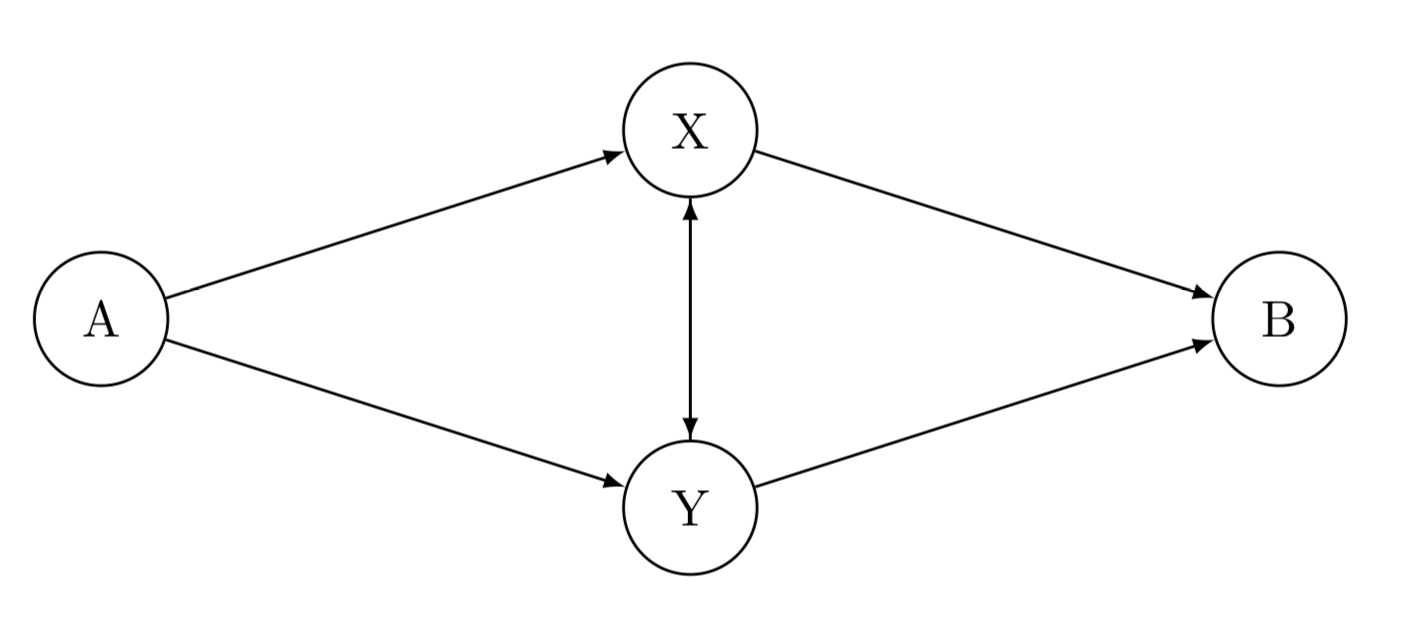
I have the following graph:

enter image description here

I am told the following information:

(1) vertex A to vertex X is described by an exponential distribution with lambda = 4;

(2) vertex A to vertex Y is described by an exponential distribution with lambda = 2.5;

(3) vertex X to vertex Y identical to vertex Y to vertex X, and it is described by an exponential distribution with lambda = 10;

(4) vertex X to vertex B is described by an exponential distribution with lambda = 3; and, finally,

(5) vertex Y to vertex B is described by an exponential distribution with lambda = 5.

Let's assume that I'm taking the fastest path between vertices every simulation.

I now want to know the average time it takes to get from vertex A to vertex B.

My R code is as follows:

# Generate/simulate 1000 random numbers for each of the internode paths. AtoX <- rexp(1000, 4) AtoY <- rexp(1000, 2.5) XtoY <- rexp(1000, 10) XtoB <- rexp(1000, 3) YtoB <- rexp(1000, 5) # Length of path from A to X to Y and A to Y to X. AYX = AtoY + XtoY AXY = AtoX + XtoY # Total time of paths from A to B. AXB = AtoX + XtoB AYB = AtoY + YtoB AXYB = AtoX + XtoY + YtoB AYXB = AtoY + XtoY + XtoB # Taking the fastest path of all paths. minAXB = min(AXB) minAYB = min(AYB) minAXYB = min(AXYB) minAYXB = min(AYXB) # Taking an average of the fastest paths. averageTravelTime = mean(minAXB + minAYB + minAXYB + minAYXB) 

Does this look correct?

1 Answer 1

3
  1. It depends on the interpretation, but I'd say that you need to simulate times from X to Y and from Y to X separately, although with the same rate. If a train goes both ways and on average the speed is the same, it doesn't mean that two trains leaving from X and Y will arrive to the other point in the same time.

  2. You are not using

    AYX <- AtoY + XtoY AXY <- AtoX + XtoY 

    so they are redundant.

  3. Writing minAXB <- min(AXB) doesn't really make sense. You simulate 1000 travel times for each edge, AXB is a vector of 1000 times of route AXB and now you are choosing the shortest one across the time..

  4. Similarly, averageTravelTime doesn't make sense because minAXB + minAYB + minAXYB + minAYXB is just a number, not a vector.

Hence, I think the code should be

set.seed(1) AtoX <- rexp(1000, 4) AtoY <- rexp(1000, 2.5) XtoY <- rexp(1000, 10) YtoX <- rexp(1000, 10) # added XtoB <- rexp(1000, 3) YtoB <- rexp(1000, 5) AXB <- AtoX + XtoB AYB <- AtoY + YtoB AXYB <- AtoX + XtoY + YtoB AYXB <- AtoY + YtoX + XtoB # changed XtoY to YtoX TravelTimes <- pmin(AXB, AYB, AXYB, AYXB) averageTravelTime <- mean(TravelTimes) 

See ?pmin. For every day it chooses the fastest travel time and returns a vector of length 1000.

As a bonus, the following shows how many times which route was the fastest

table(apply(cbind(AXB, AYB, AXYB, AYXB), 1, which.min)) # 1 2 3 4 # 317 370 240 73 
Sign up to request clarification or add additional context in comments.

3 Comments

Ahh, I think you're right. So we should be taking the fastest route on each day, rather than the fastest route across time?
@ThePointer, right, because of Assuming you are taking on every day the fastest route. And also taking the average of 1000 travel times makes more sense than of 4.
Ok, thank you very much for the assistance. This was enlightening.

Start asking to get answers

Find the answer to your question by asking.

Ask question

Explore related questions

See similar questions with these tags.