3
$\begingroup$

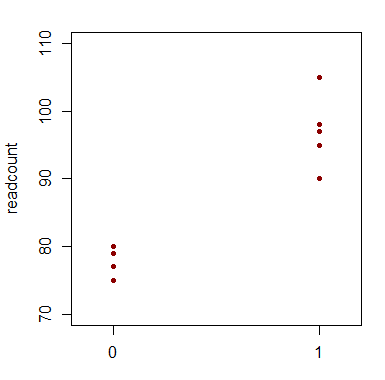
I have a bunch of genetic read counts for different several genes. Each gene is divided into two groups (0 and 1). What I want to do is make a vertical plot side by side of the 0 group and the 1 group. Thus if there were 10 observations in the zero group and 20 observations in the 1 Group, there would be 10 dots in the left column and 20 dots in the right column.

I would also like to iterate this over several genes.

So for instance, suppose I had a matrix as follows:

0 75 0 80 0 77 0 79 1 90 1 95 1 105 1 98 1 97 

This would be 1 gene with 4 in the zero group and 5 in the 1 group. I would have several of these matrices.

Thank you!

Edit

Here's some sample data using dput:

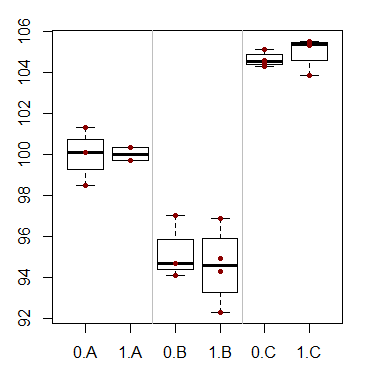
 > dput(mydata) list(structure(c(0, 0, 0, 1, 1, 98.4907329358843, 100.093299628285, 101.328969073832, 99.7130588936915, 100.316498649611), .Dim = c(5L, 2L)), structure(c(0, 0, 0, 1, 1, 1, 1, 97.0449341295192, 94.0953511135576, 94.6964499394555, 94.9450653539671, 96.9023528925965, 94.2860553266605, 92.3232956095601), .Dim = c(7L, 2L)), structure(c(0, 0, 0, 0, 1, 1, 1, 1, 104.277489358474, 104.427037361567, 105.12427096276, 104.593546894304, 105.492443088382, 105.288750134106, 105.381724838826, 103.83948211249), .Dim = c(8L, 2L))) 

What I want is a combination of the boxplot example here (where they factor by year and I would factor by column 1): http://www.ling.upenn.edu/~joseff/rstudy/summer2010_ggplot2_intro.html

with an overlay of the dots over each box plot (shown in the second solution) here: https://stackoverflow.com/questions/8387088/r-boxplot-and-stripchart-side-by-side-in-1-figure

However, for the overlay, I don't want them in the middle of each two boxplots but rather on top.

Hope that helps further explain it!

$\endgroup$
3
  • $\begingroup$ I'm not clear on the output you desire. Try looking at docs.ggplot2.org/current so you can give some visual example of what you're working towards. $\endgroup$ Commented Jul 23, 2014 at 3:18
  • $\begingroup$ @Ben Gorman, I put in some more details -- thanks! $\endgroup$ Commented Jul 23, 2014 at 4:29
  • $\begingroup$ The first link uses ggplot2. Are you asking for ggplot2 displays, or was that just an example? $\endgroup$ Commented Jul 23, 2014 at 4:47

1 Answer 1

3
$\begingroup$

Are you after something like this?

enter image description here

If your data was in say mydata (either as a matrix or as a data frame) with columns named group and readcount, then

stripchart(readcount~factor(group),data=mydata, pch=20,col="darkred",vertical=TRUE,xlim=c(0.85,2.15),ylim=c(70,110)) 

would give that.


Edited to address updated question where mydata is a list of matrices:

 # add some names for(i in 1:3) {colnames(mydata[[i]])<-c("group","readcount")} #stack up data lengths=sapply(mydata,dim)[1,] mydatast=cbind(do.call("rbind", mydata),set=rep(1:3,times=lengths)) #generate plot boxplot(readcount~interaction(group,LETTERS[set]),data=mydatast) stripchart(readcount~interaction(group,set),mydatast,add=TRUE, vertical=TRUE,pch=20,col="darkred") abline(v=c(2.5,4.5),col=8) 

enter image description here

(Of course, one could add box colours for the different sets or for the 0/1 variable, and so on, as needed.)

$\endgroup$
4
  • $\begingroup$ yes, that's almost it, I have added some more details on top. Thank you for your help! $\endgroup$ Commented Jul 23, 2014 at 4:29
  • $\begingroup$ You're right of course -- the idea of a box plot only came to me after looking at it. I'll mark this question as solved and give you credit and if need be, reopen a new post. $\endgroup$ Commented Jul 23, 2014 at 4:49
  • $\begingroup$ It's worth a new post because it's now a somewhat different question (about scale -- your input here really helped though!). Take a look here, it's now much better posed: stackoverflow.com/questions/24902226/… $\endgroup$ Commented Jul 23, 2014 at 5:02
  • $\begingroup$ You're right, that question was better asked as a new question. Nevertheless, I've adding some basic info here that relates to what you ended up asking above (implemented in basic R). $\endgroup$ Commented Jul 23, 2014 at 5:43

Start asking to get answers

Find the answer to your question by asking.

Ask question

Explore related questions

See similar questions with these tags.