0
$\begingroup$

Time Plot of Data Set

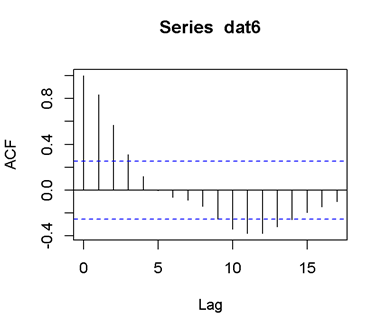
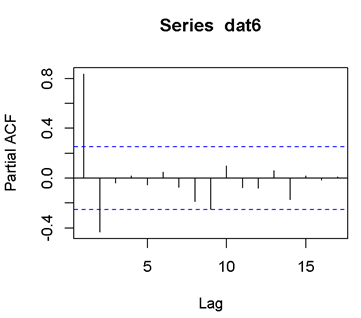
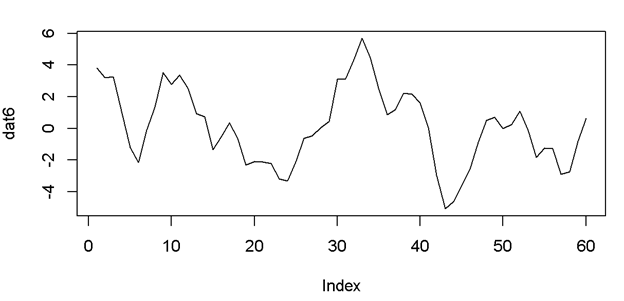
Here is what I obtain when I plot my data set in R. I am now wondering whether this data set is stationary or not. I'm assuming it is stationary since it has no visible trends or seasonality. However, when I look at its ACF, it seems that it's seasonal of cycle length 12. And I would suggest AR(2) model.

Here are the plots of ACF and PACF

ACF Plot PACF Plot

$\endgroup$
1
  • $\begingroup$ Lots of related questions here: stats.stackexchange.com/… $\endgroup$ Commented Dec 9, 2021 at 23:03

1 Answer 1

3
$\begingroup$

The ACF (not being persistent and exhibiting damped oscillation) and PACF (cutting off after 2 lags) are indicative of a stationary AR(2) model - or ARIMA(2,0,0). The particular oscillatory behavior of the ACF also suggests that the roots of the AR polynomial are complex. Note that you cannot get this kind of oscillatory behavior with an AR(1) model; the only oscillatory behavior possible in an AR(1) process is that in which the autocorrelations switch sign with each successive lag (occurs when the AR coefficient is negative). This is a cookie cutter example of an AR(2) process with complex roots.

$\endgroup$
0

Start asking to get answers

Find the answer to your question by asking.

Ask question

Explore related questions

See similar questions with these tags.