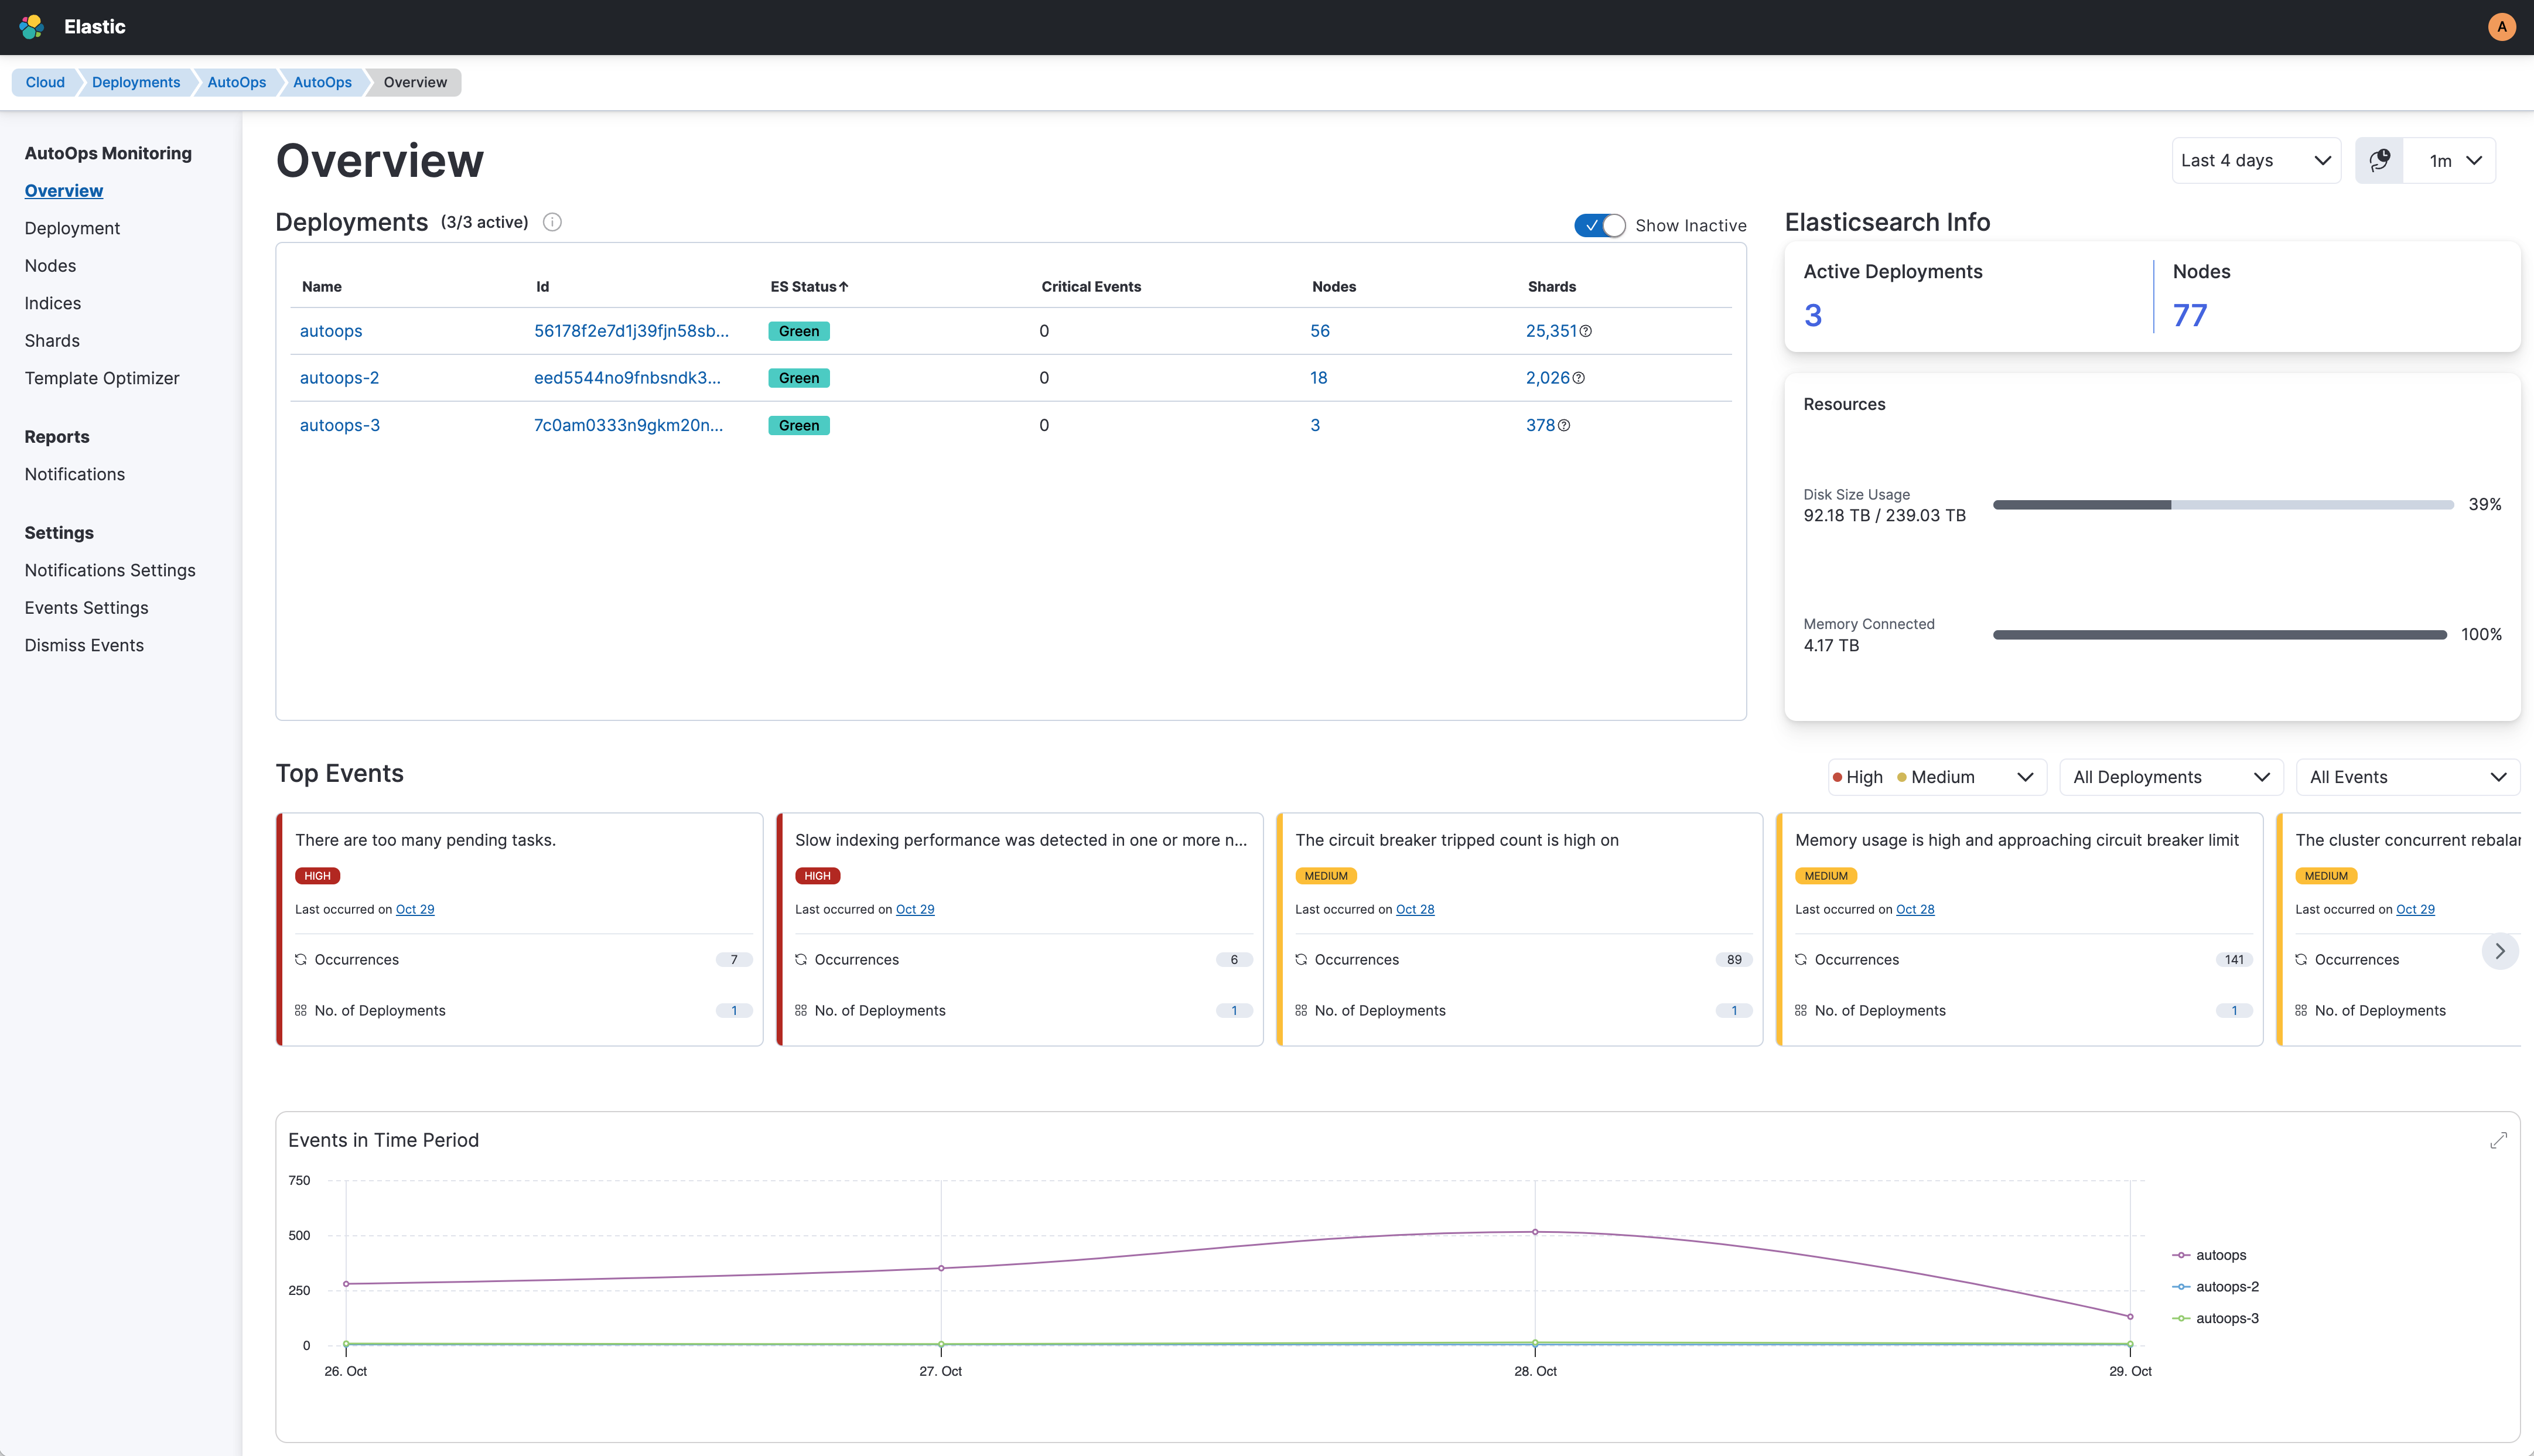
Overview in AutoOps
ECH ECK ECE Self-Managed
The Overview page displays the current status of customer deployments and clusters that are linked to the same Elastic organization.
This view offers an at-a-glance look into high-level metrics such as the most important and currently open events and the number of active deployments and nodes. You can also view the cluster status, the number of open events in each Elasticsearch deployment or cluster over different periods of time, and navigate to a specific deployment or cluster for more details.
To get to the Overview page, go to AutoOps in your deployment or cluster and select Overview from the side navigation.

The Overview page displays a complete list of deployments and clusters only if AutoOps is available in the specific Cloud Service Provider (CSP) region.
The Overview page shows the following panels.
The Deployments table lists all active deployments as well as inactive deployments for which AutoOps collected information in the past. You can also see real-time updates of Elasticsearch status, the number of open critical events, the number of Elasticsearch nodes, and the total number of shards in each deployment. Select a deployment to get a more detailed view of all open and closed events.
The Elasticsearch Info panel shows the number of active deployments, the number of nodes, and a summary of used resources, such as total disk size used and total memory connected for all clusters.
The Top Events panel provides a quick overview of the top open events. You can filter by deployment or cluster, severity, name, and search for a specific event across all of the connected deployments or clusters.
The default view lists the top 10 important events, sorted by severity. Each event card indicates when the event occurred last, the number of occurrences across all deployments or clusters, the deployments or clusters impacted by the event, and it includes a direct link to the event to get additional details.
The Events in Time Period panel shows a time series chart displaying all events identified across the connected deployments or clusters during the selected time period. Use this panel to detect which deployment or cluster is generating the most events, so that you can investigate further and take action to resolve the underlying issues.