


Optimizing to speed up our code
Now that we’ve profiled our kernel we have our first report, which provides the information we need to optimize our code. In Figure 7.14 we see the basic information resulting from the execution we specified. We see the time it took to execute the kernel of the current session, and we can also see the launch configuration that was used: (125,125,1) blocks of (16,16,1) threads.
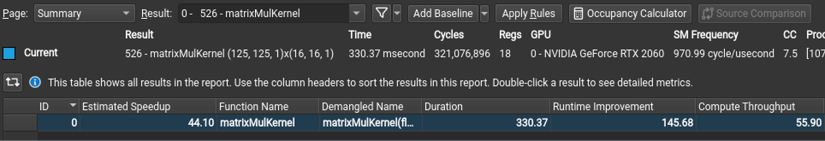
Figure 7.14: The summary of profiling the kernel
We also find, on the Summary page, a list of recommendations based on what the tool found out about our code that could be improved, as shown in Figure 7.15. However, we need to look at the details page to understand the recommendations in depth.
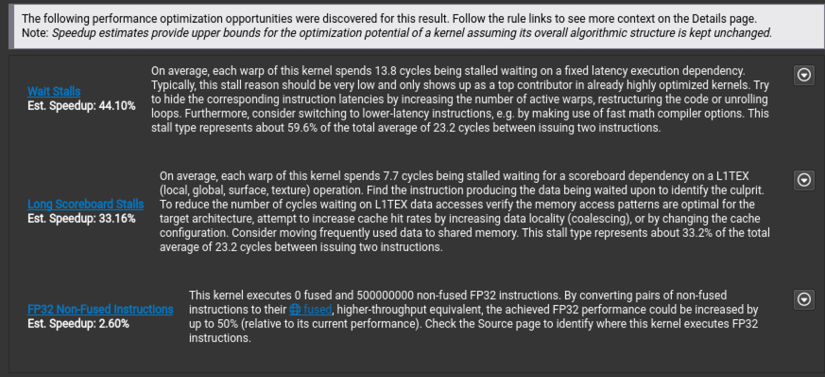
Figure 7.15: The recommendations for the kernel
We do this by selecting the Details page on the top left corner of the report, as shown in Figure 7.16.
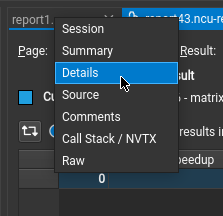
Figure 7.16: Selecting the Details page
We then reach the Details page, where we have sections...


