Automated Performance Testing Lars Thorup ZeaLake Software Consulting May, 2012
Who is Lars Thorup? ● Software developer/architect ● C++, C# and JavaScript ● Test Driven Development ● Coach: Teaching agile and automated testing ● Advisor: Assesses software projects and companies ● Founder and CEO of BestBrains and ZeaLake
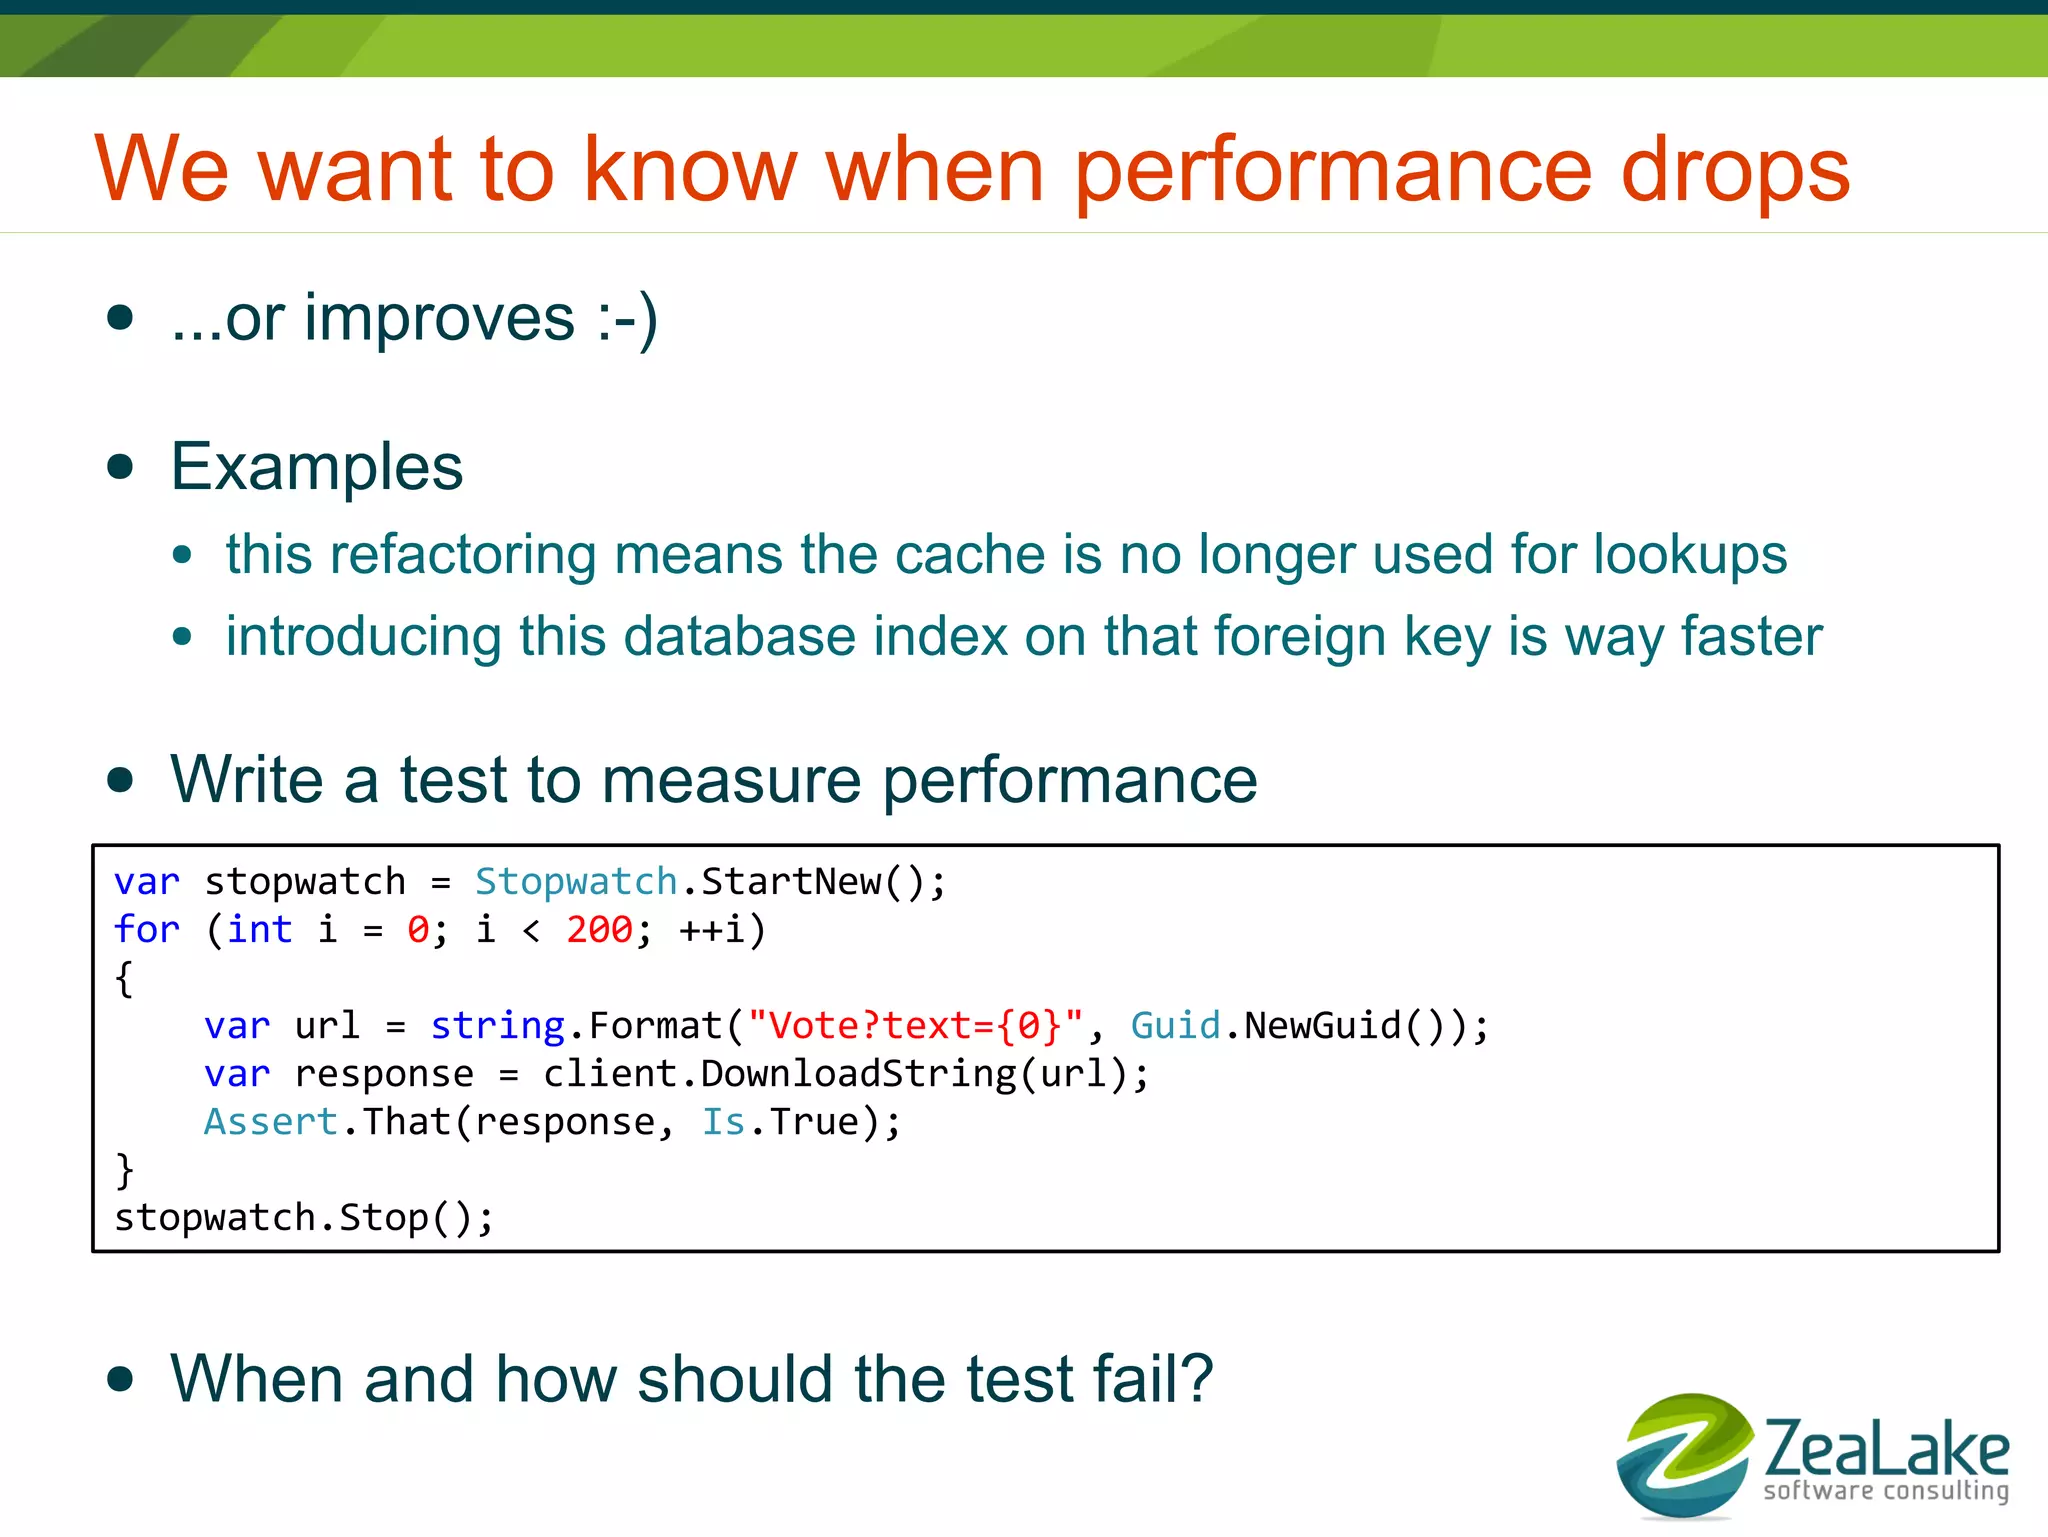
We want to know when performance drops ● ...or improves :-) ● Examples ● this refactoring means the cache is no longer used for lookups ● introducing this database index on that foreign key is way faster ● Write a test to measure performance var stopwatch = Stopwatch.StartNew(); for (int i = 0; i < 200; ++i) { var url = string.Format("Vote?text={0}", Guid.NewGuid()); var response = client.DownloadString(url); Assert.That(response, Is.True); } stopwatch.Stop(); ● When and how should the test fail?
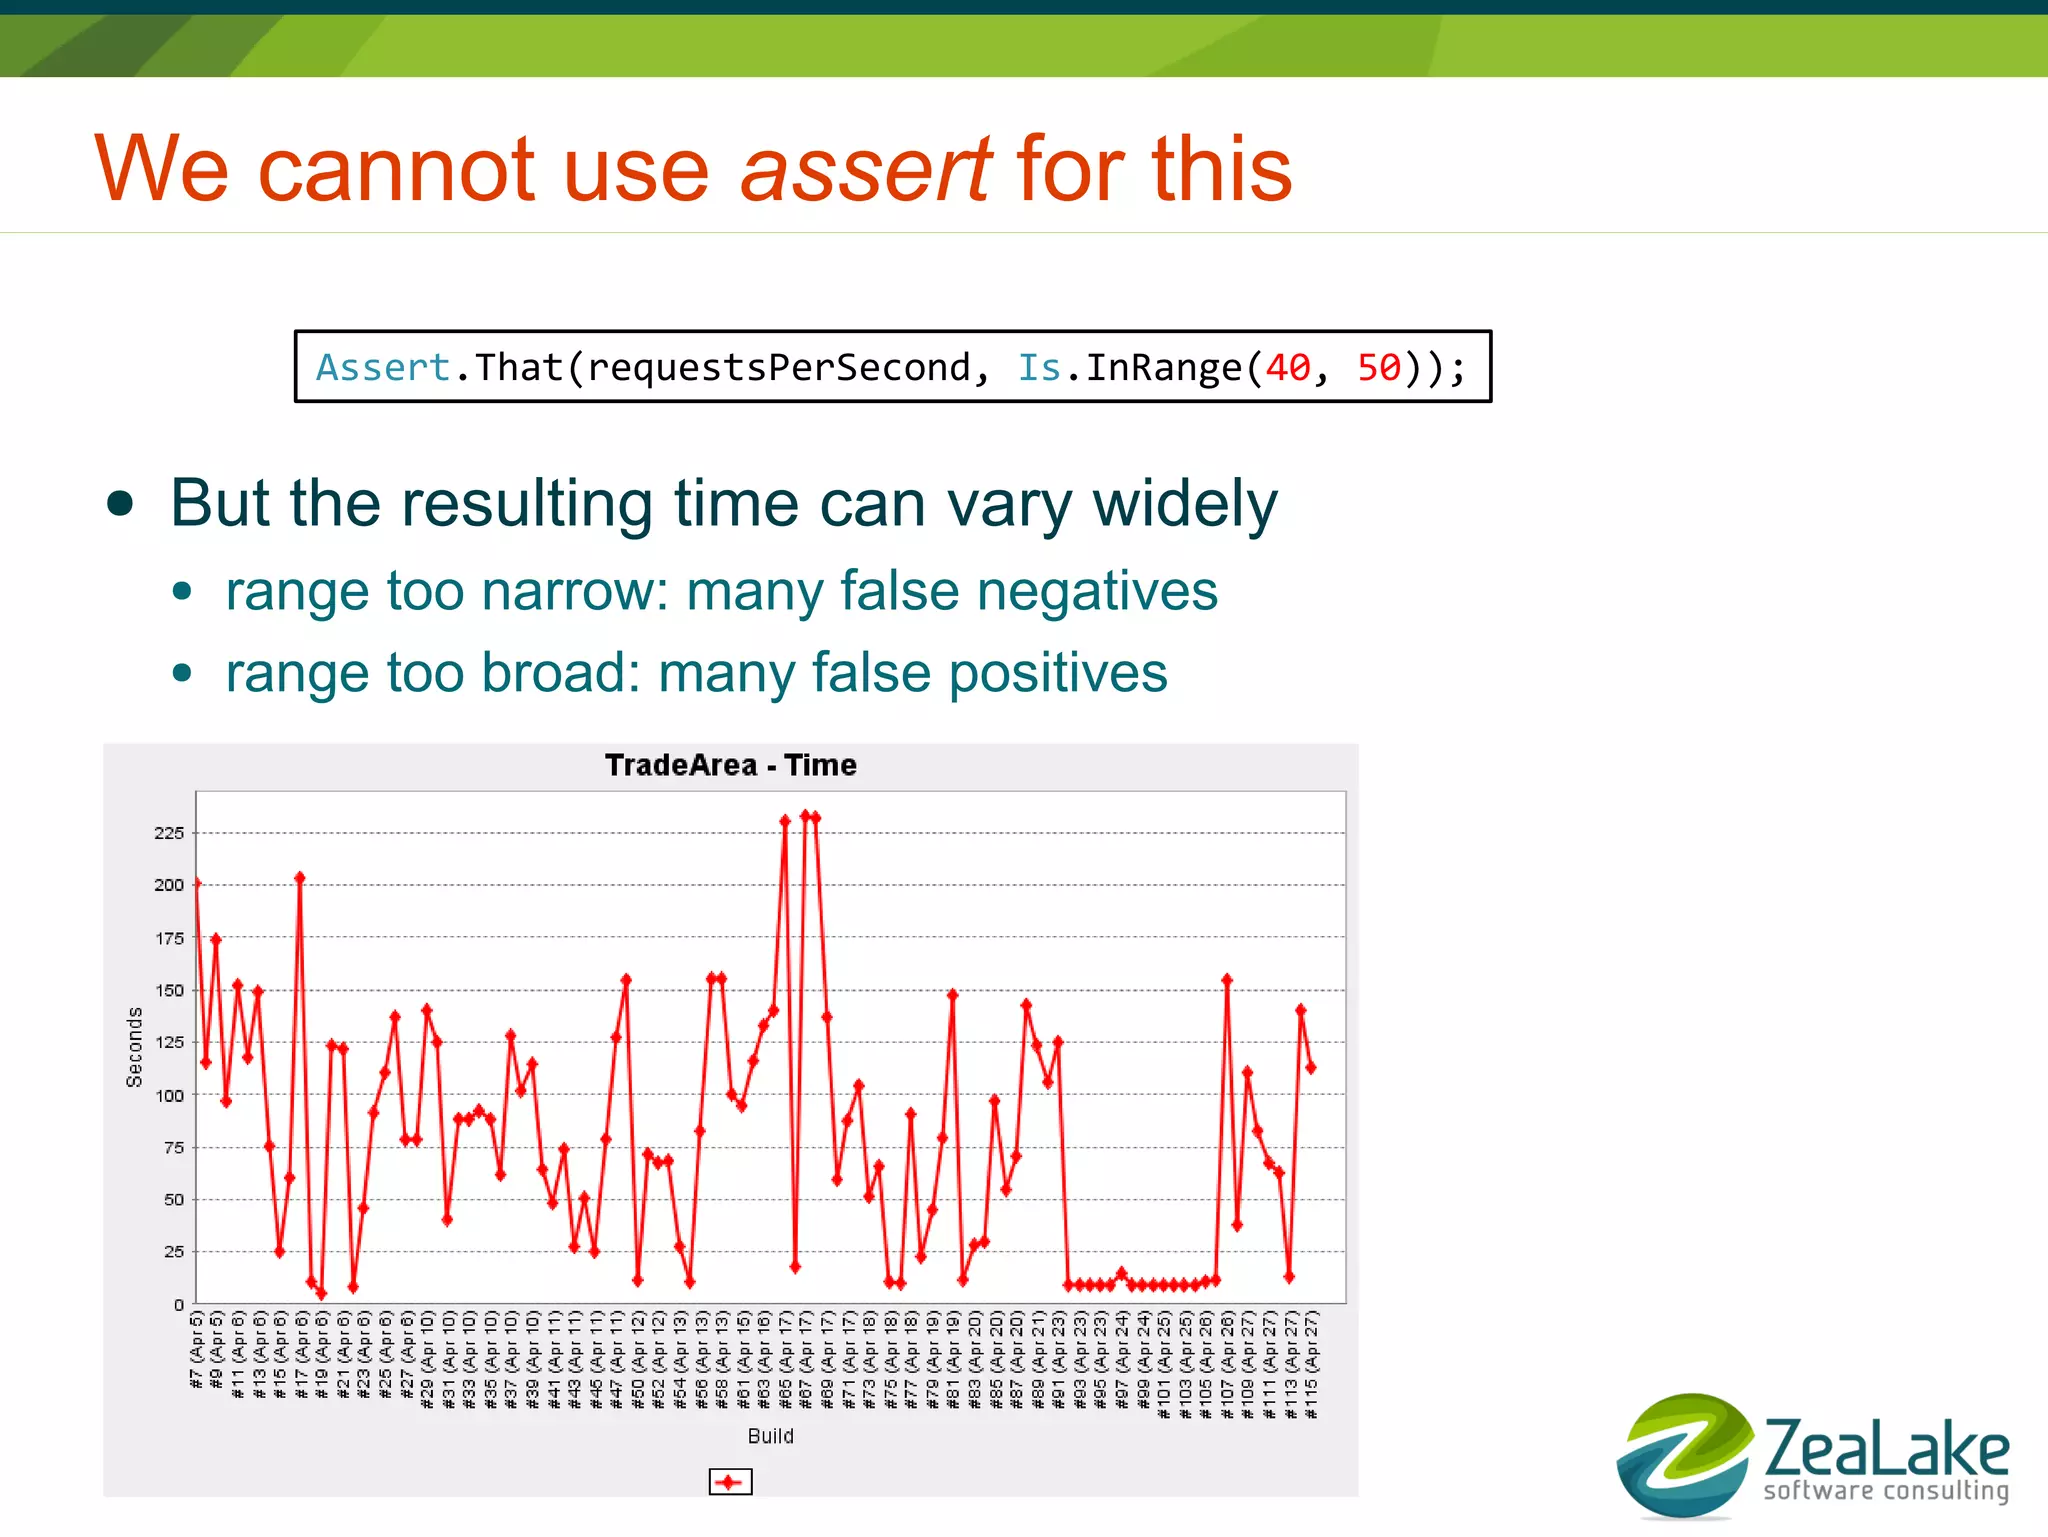
We cannot use assert for this Assert.That(requestsPerSecond, Is.InRange(40, 50)); ● But the resulting time can vary widely ● range too narrow: many false negatives ● range too broad: many false positives
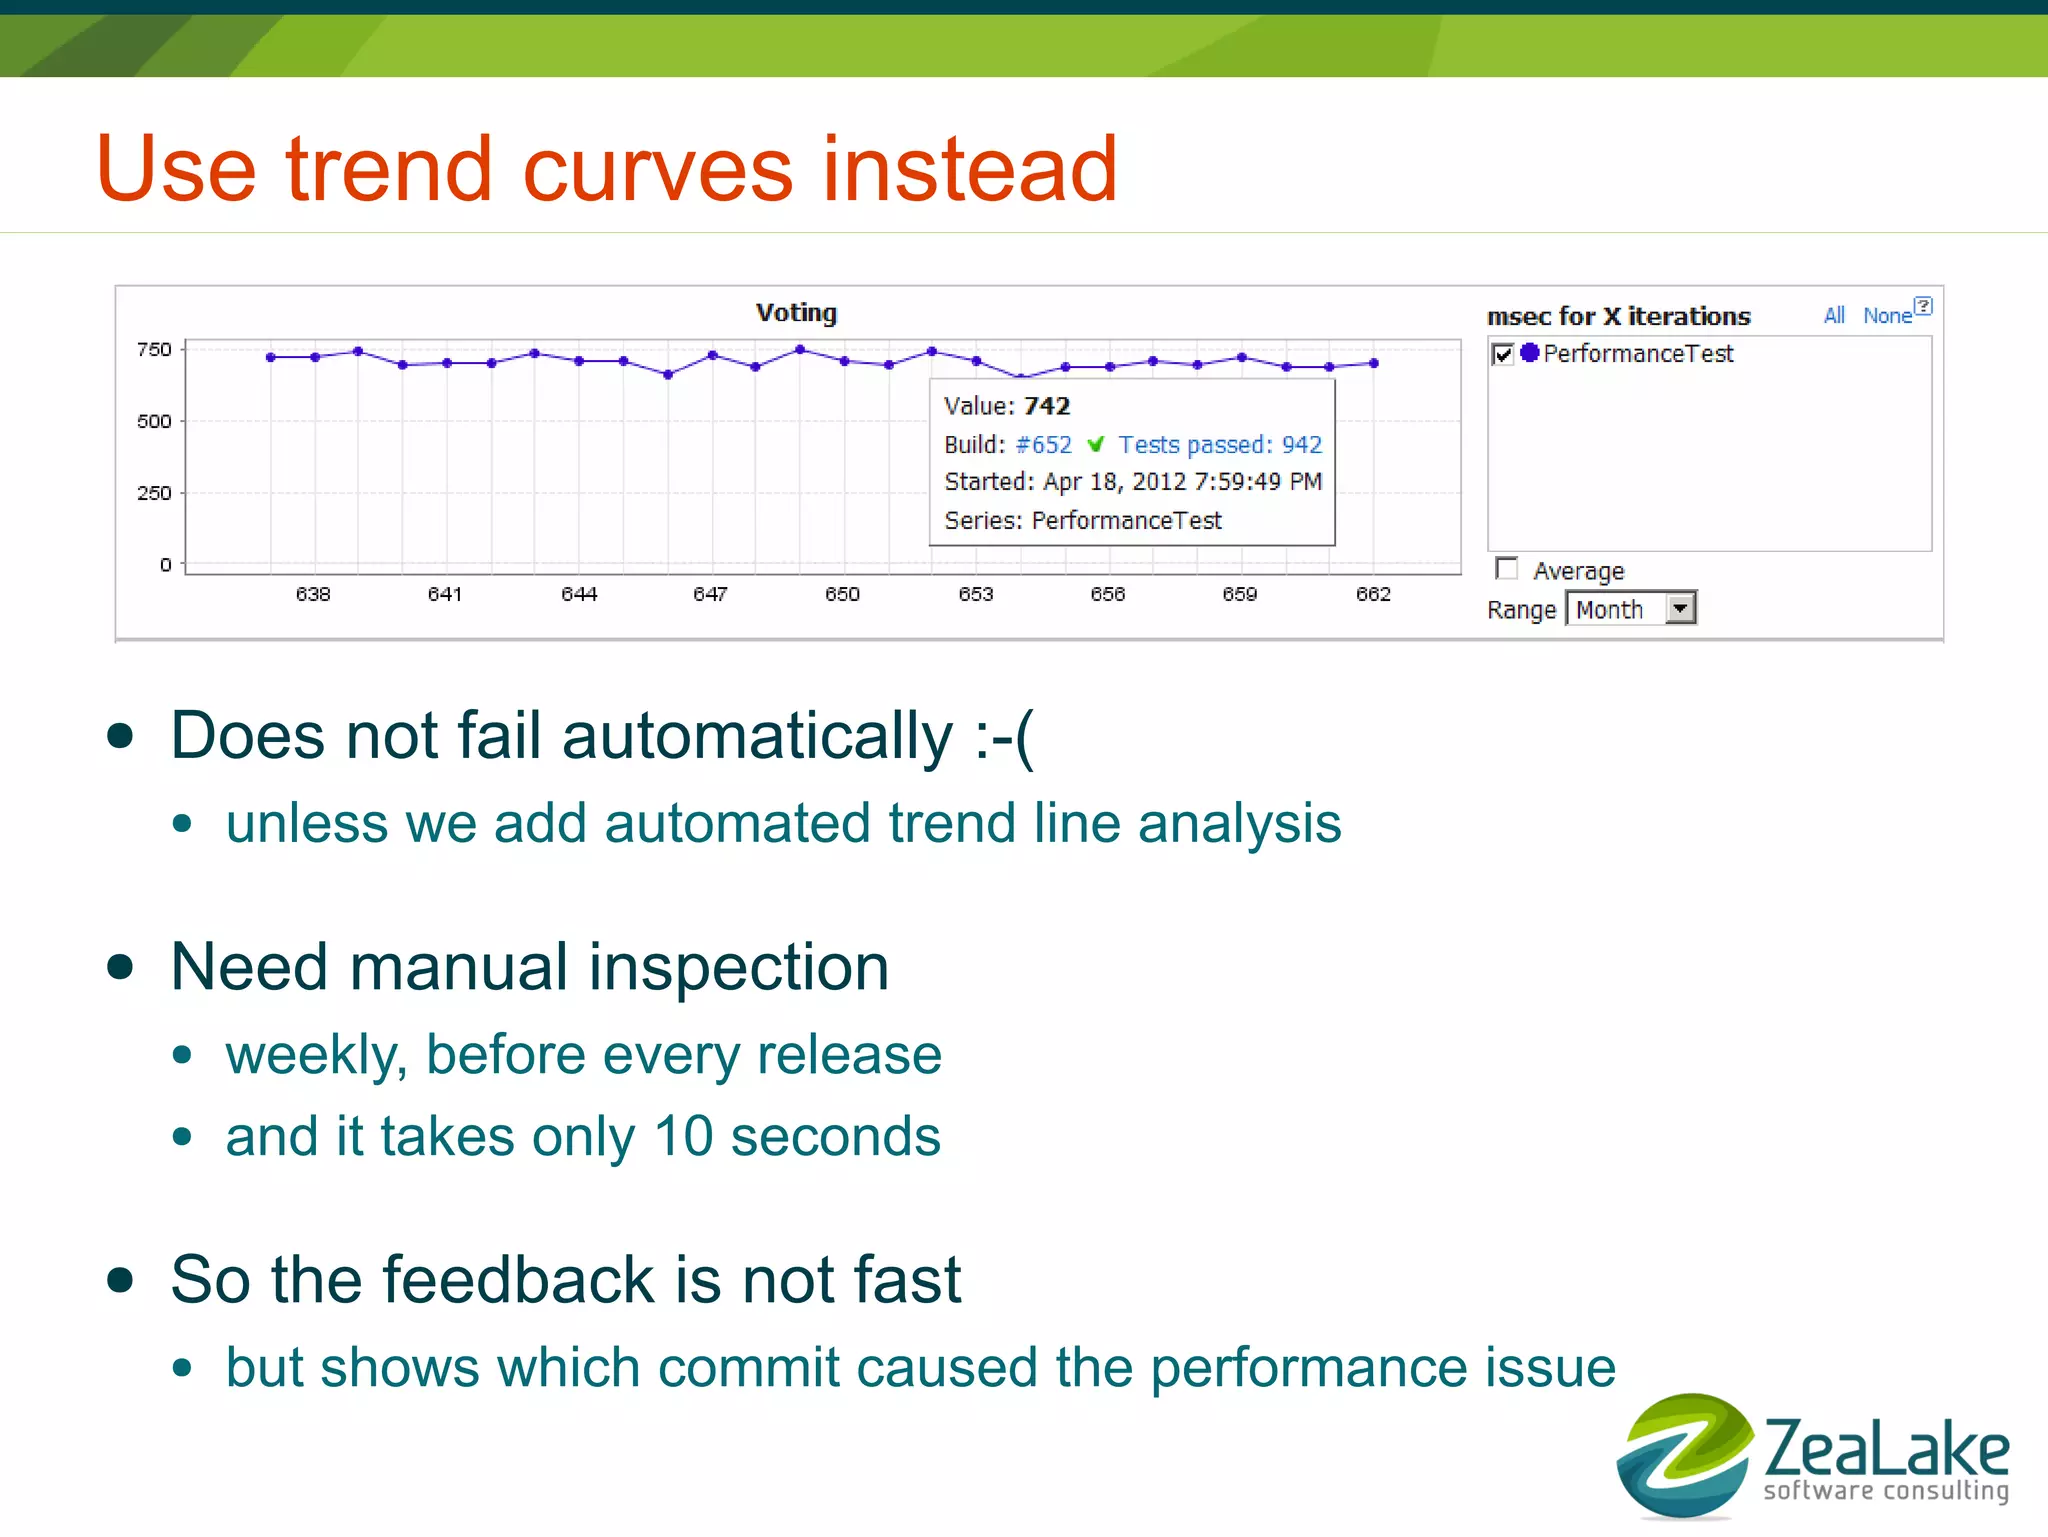
Use trend curves instead ● Does not fail automatically :-( ● unless we add automated trend line analysis ● Need manual inspection ● weekly, before every release ● and it takes only 10 seconds ● So the feedback is not fast ● but shows which commit caused the performance issue
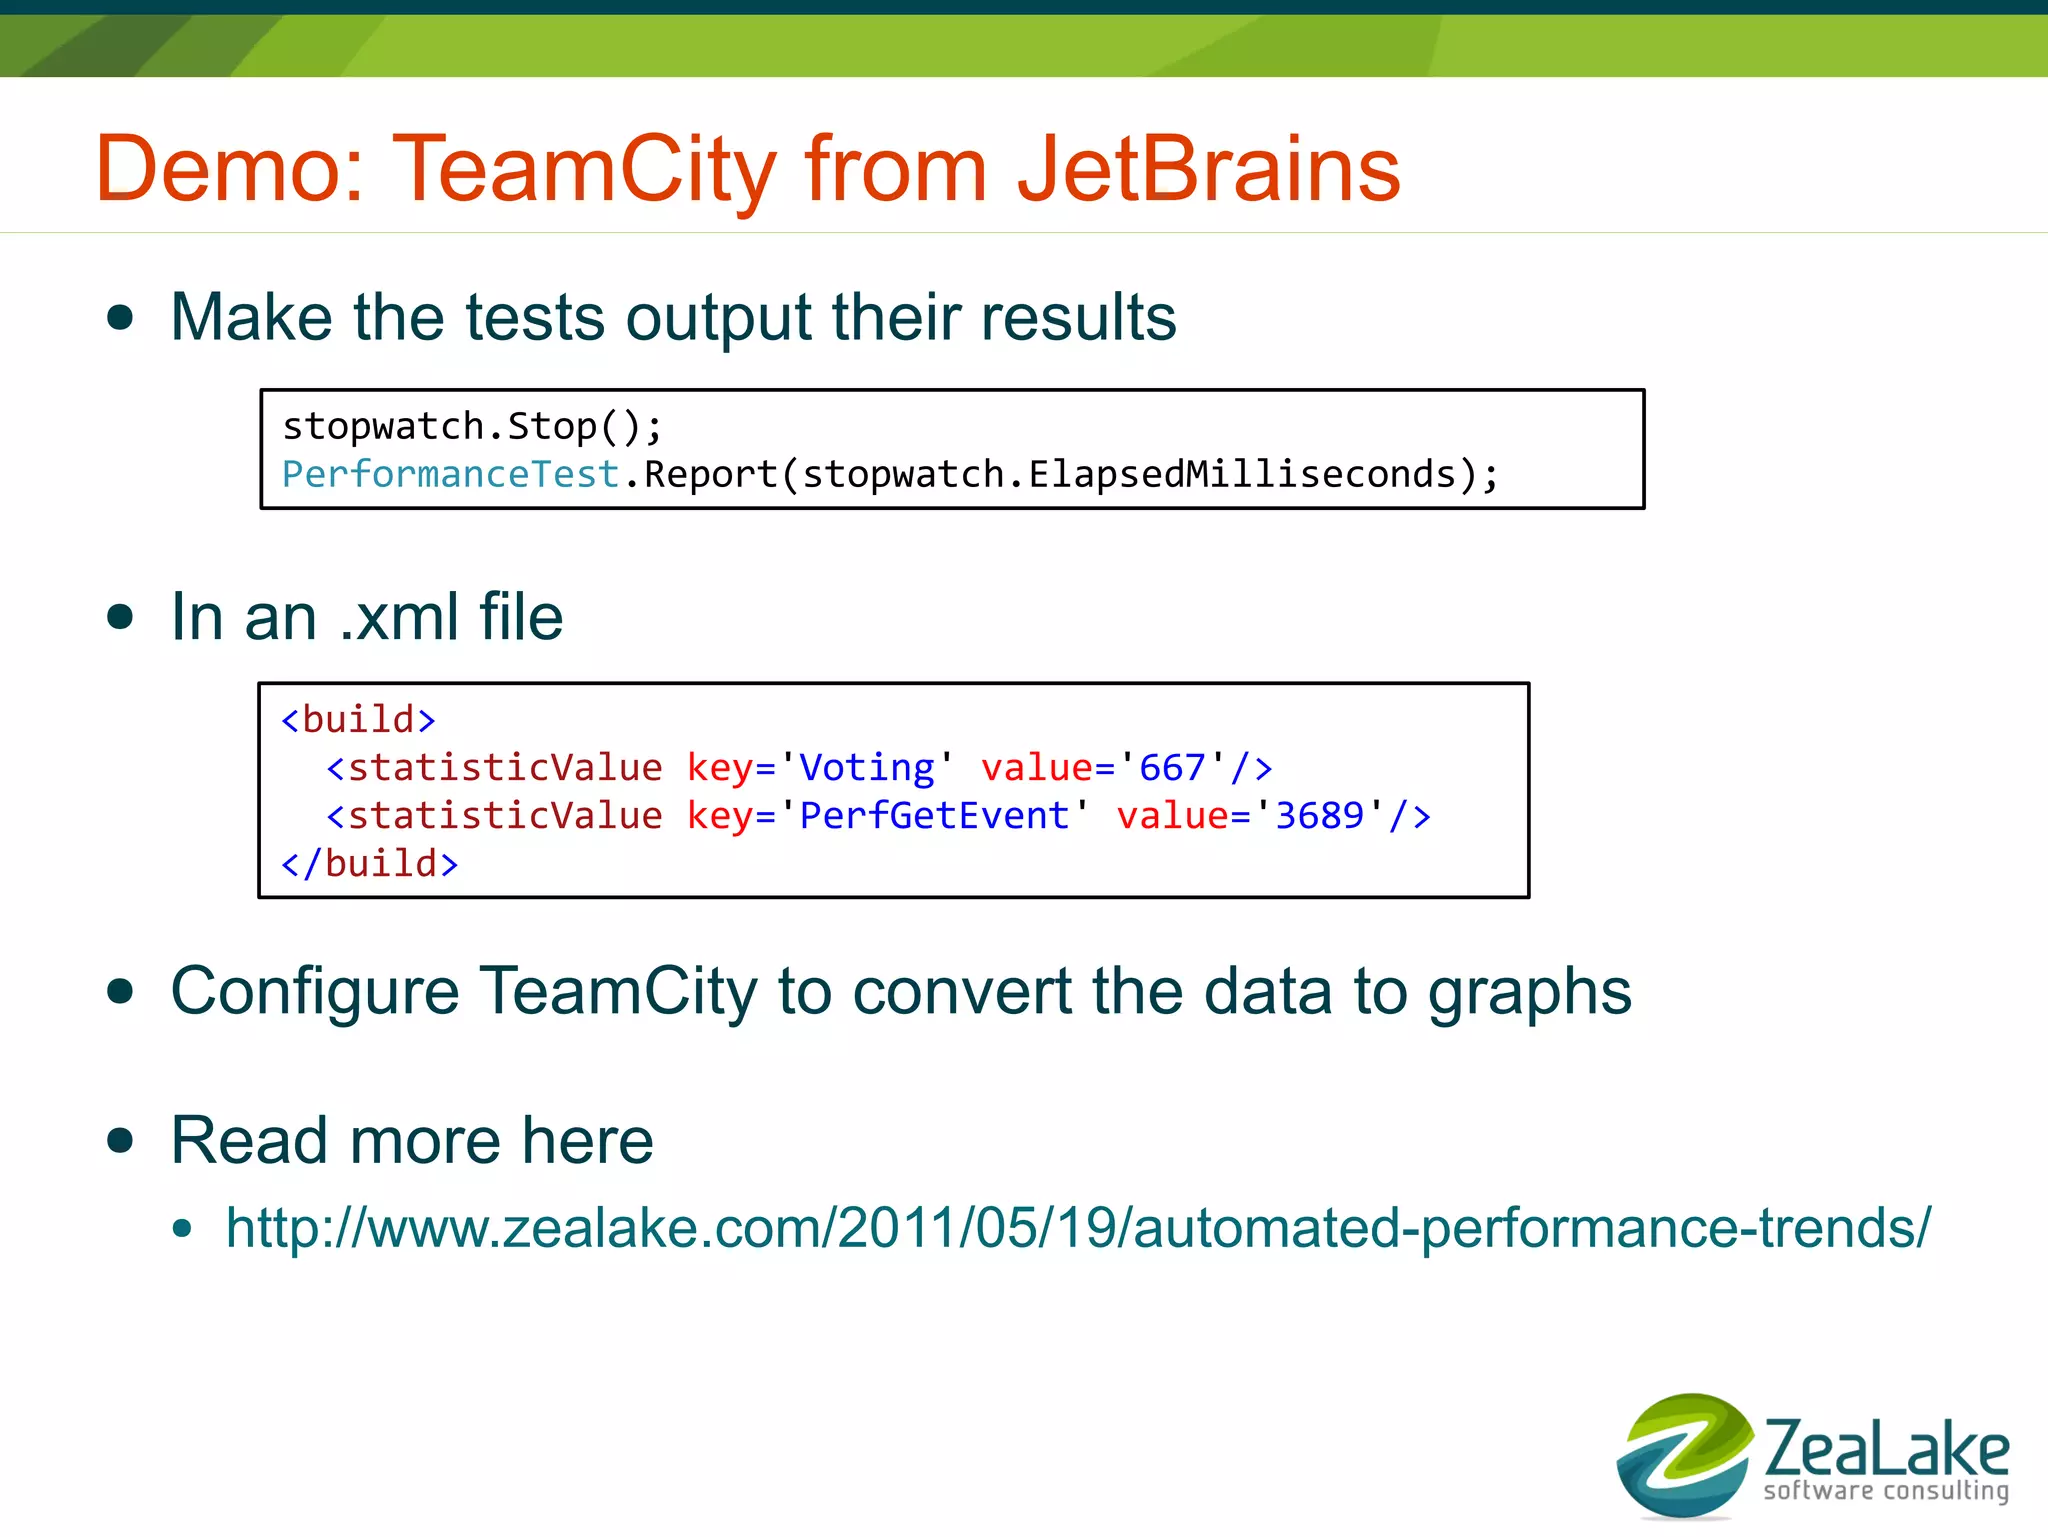
Demo: TeamCity from JetBrains ● Make the tests output their results stopwatch.Stop(); PerformanceTest.Report(stopwatch.ElapsedMilliseconds); ● In an .xml file <build> <statisticValue key='Voting' value='667'/> <statisticValue key='PerfGetEvent' value='3689'/> </build> ● Configure TeamCity to convert the data to graphs ● Read more here ● http://www.zealake.com/2011/05/19/automated-performance-trends/
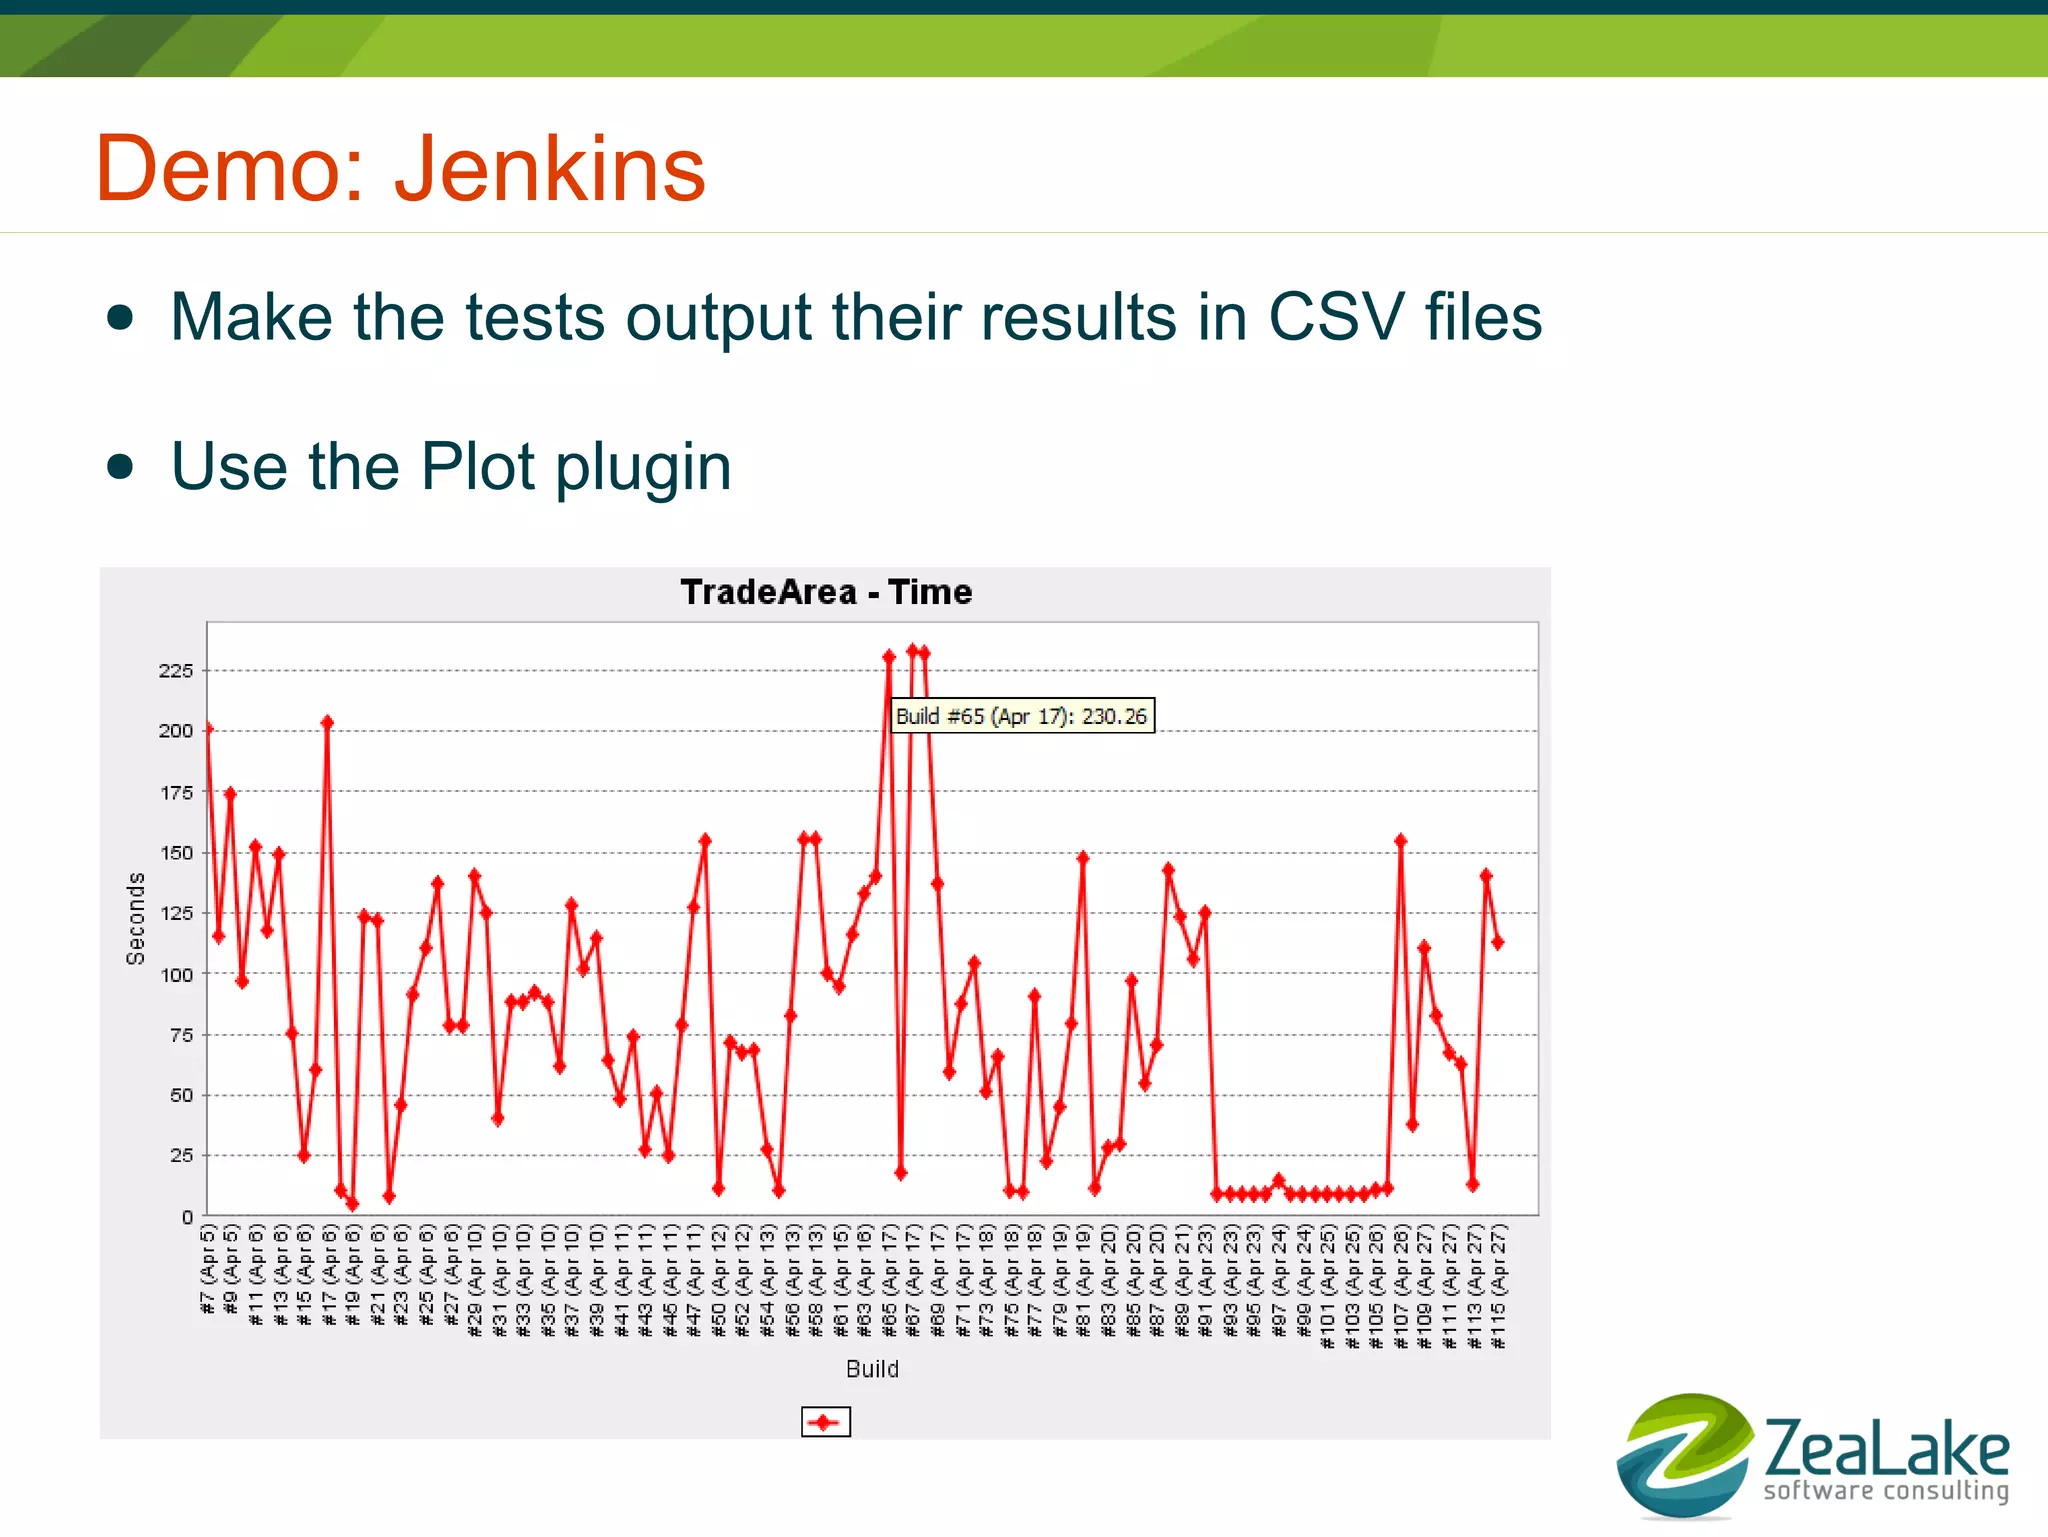
Demo: Jenkins ● Make the tests output their results in CSV files ● Use the Plot plugin

Automated Performance Testing

  • 1.
  • 2.
    Who is LarsThorup? ● Software developer/architect ● C++, C# and JavaScript ● Test Driven Development ● Coach: Teaching agile and automated testing ● Advisor: Assesses software projects and companies ● Founder and CEO of BestBrains and ZeaLake
  • 3.
    We want toknow when performance drops ● ...or improves :-) ● Examples ● this refactoring means the cache is no longer used for lookups ● introducing this database index on that foreign key is way faster ● Write a test to measure performance var stopwatch = Stopwatch.StartNew(); for (int i = 0; i < 200; ++i) { var url = string.Format("Vote?text={0}", Guid.NewGuid()); var response = client.DownloadString(url); Assert.That(response, Is.True); } stopwatch.Stop(); ● When and how should the test fail?
  • 4.
    We cannot useassert for this Assert.That(requestsPerSecond, Is.InRange(40, 50)); ● But the resulting time can vary widely ● range too narrow: many false negatives ● range too broad: many false positives
  • 5.
    Use trend curvesinstead ● Does not fail automatically :-( ● unless we add automated trend line analysis ● Need manual inspection ● weekly, before every release ● and it takes only 10 seconds ● So the feedback is not fast ● but shows which commit caused the performance issue
  • 6.
    Demo: TeamCity fromJetBrains ● Make the tests output their results stopwatch.Stop(); PerformanceTest.Report(stopwatch.ElapsedMilliseconds); ● In an .xml file <build> <statisticValue key='Voting' value='667'/> <statisticValue key='PerfGetEvent' value='3689'/> </build> ● Configure TeamCity to convert the data to graphs ● Read more here ● http://www.zealake.com/2011/05/19/automated-performance-trends/
  • 7.
    Demo: Jenkins ● Make the tests output their results in CSV files ● Use the Plot plugin