INTRODUCTION TO DATA SCIENCE
What is data science? • The term “data science” was coined in 2001, attempting to describe a new field. Some argue that it’s nothing more than the natural evolution of statistics, and shouldn’t be called a new field at all. But others argue that it’s more interdisciplinary. For example, in The Data Science Design Manual (2017), Steven Skiena says the following. • Data science is thought of lying at the intersection of computer science, statistics, and substantive application domains. From computer science comes machine learning and high-performance computing technologies for dealing with scale. From statistics comes a long tradition of exploratory data analysis, significance testing, and visualization. From application domains in business and the sciences comes challenges worthy of battle, and evaluation standards to assess when they have been adequately conquered.
• Drew Conway in 2013, called The Data Science Venn Diagram, in which he drew the following diagram to indicate the various fields that come together to form what we call “data science.” The Data Science Venn Diagram
The Data Science Venn Diagram
Steps of Data Science 1. Data Collection 2. Data Pre Processing Data in form of structured data Predictions from data i) Selection of important attributes ii) Handling missing values 3. Data Analysis 4. Driving insights and generating reports and charts 5. Decision making based on insight
5 V's of Big Data i) Raw Data : Volume ii)Change over time : Velocity iii) Data type : Variety iv) Data Quality : Veracity v)Info for decision making: Value Making e.g. Population distribution based on Statistical Methods
TASKS OF DATA SCIENTISTS
What do data scientists do? • Turning data into actionable value usually involves answering questions using data. Here’s a typical workflow for how that plays out in practice. • 1. Obtain data that may help answer the question. • 2. Explore the data to understand it. • 3. Clean and prepare the data for analysis. • 4. Perform analysis, model building, testing, etc. • (The analysis is the step most people think of as data science, but it’s just one step! Notice how much more there is that surrounds it.) • 5. Draw conclusions from your work. • 6. Report those conclusions to the relevant stakeholders.
What should we learn in Data Science? • Introductory Data analysis • Simple Linear Regression • Hypothesis Testing • Statistics, Mathematical Modeling, Econometrics is added advantage but not mandatory for Data Science
Foundational aspects of data science • Mathematics: We should cover foundational mathematical concepts, such as functions, relations, assumptions, conclusions, and abstraction, so that we can use these concepts to define and understand many aspects of data manipulation. We will also make use of statistical formulae including graphs for social network analysis, matrices for finding themes in relations, and supervised machine learning. • Technology: We will extend our Python knowledge with more advanced table manipulation functions, extended practice with data cleaning and manipulation tasks, computational notebooks (such as Jupyter), and GitHub for version control and project publishing.
Foundational aspects of data science • Visualization: We will learn new types of plots for a wide variety of data types and what you intend to communicate about them. We will also study the general principles that govern when and how to use visualizations and will learn how to build and publish interactive online visualizations (dashboards). • Communication: We will study how to write comments in code, documentation for code, motivations in computational notebooks, interpretation of results in computational notebooks, and technical reports about the results of analyses. We will prioritize clarity, brevity, and knowing the target audience. Many of these same principles will arise when creating presentations or videos as well. Each of these modes of communication is required at some point in our course.
Technical View of Data Science • We will discuss Data Science in terms of scientific analysis and data extraction from huge unstructured data
Data Science is an interdisciplinary field about scientific methods, processes, and systems to extract knowledge or insights from data in various forms, either structured or unstructured, similar to data mining. “Unstructured data” can include emails, videos, photos, social media, and other user-generated content. Data science often requires sorting through a great amount of information and writing algorithms to extract insights from this data. Data Science
Data Science • Data science is the application of computational and statistical techniques to address or gain insight into some problem in the real world • Mathematically Data science = statistics + data processing + machine learning + scientific inquiry + visualization + business analytics + big data + …
Example: Lists of Best Jobs
Data science is not machine learning • Machine learning involves computation and statistics, but has not (traditionally) been very concerned about answering scientific questions • Machine learning has a heavy focus on fancy algorithms… • ... but sometimes the best way to solve a problem is just by visualizing the data, for instance
Data science is not machine learning
Data Science Competitions • Data science competitions like Kaggle ask you to optimize a metric on a fixed data set • This may or may not ultimately solve the desired business/scientific problem • Data science is the iterative cycle of designing a concrete problem, building an algorithm to solve it (or determining that this is not possible), and evaluating what insights this provides for the real underlying question
Data science is not statistics • “Analyzing data computationally, to understand some phenomenon in the real world, you say? … that sounds an awful lot like statistics” • Statistics (at least the academic type) has evolved a lot more along the mathematical/theoretical frontier • Not many statistics courses have a lecture on e.g.web scraping, or a lot of data processing more generally • Plus, statisticians use R, while data scientists use Python ... clearly these are completely different fields
Data science is not big data • Sometimes, in order to truly understand and answer your question, you need massive amounts of data …. • .… But sometimes you don’t • Don’t create more work for yourself than you need to
Data Science Diagram
Some examples of Data Science
How to manage, model and visualise data in Data Science • Data collection and management: relational data, matrices and vectors, graphs and networks, free text processing, geographical data • Statistical modeling and machine learning: linear and nonlinear classification and regression, regularization, data cleaning, hypothesis testing, kernel methods and SVMs, boosting, clustering, dimensionality reduction, recommender systems, deep learning, probabilistic models, scalable ML • Visualization: basic visualization and data exploration, data presentation and interactivity

Data_Science_Presentationforlearning machine learning

  • 1.
  • 2.
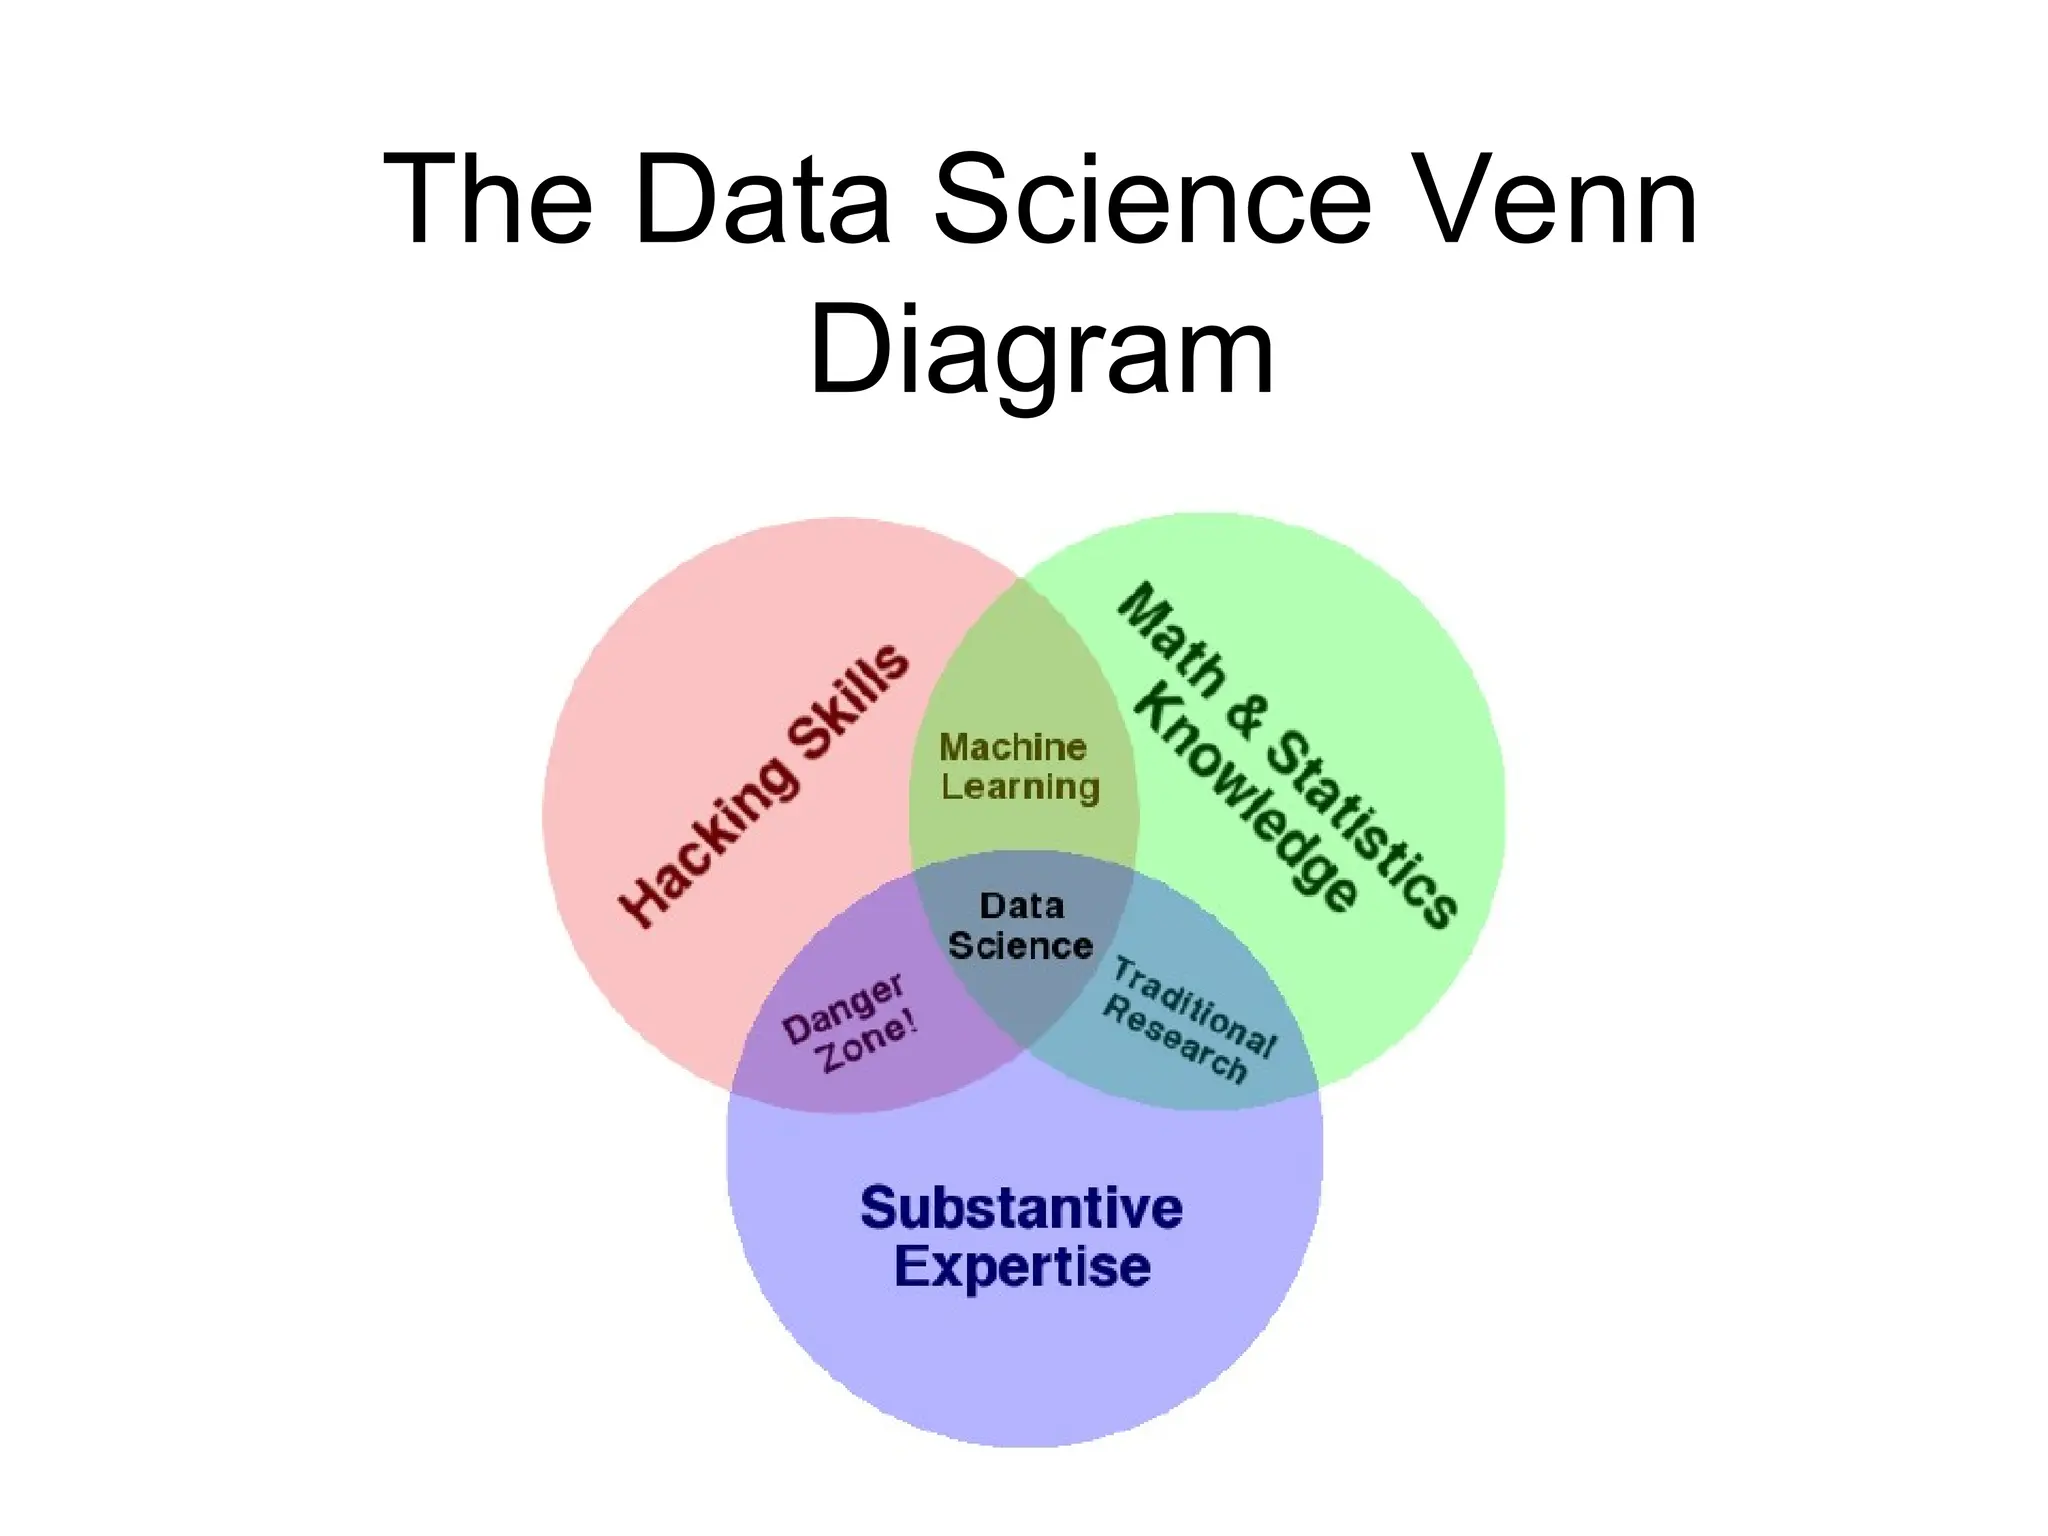
    What is datascience? • The term “data science” was coined in 2001, attempting to describe a new field. Some argue that it’s nothing more than the natural evolution of statistics, and shouldn’t be called a new field at all. But others argue that it’s more interdisciplinary. For example, in The Data Science Design Manual (2017), Steven Skiena says the following. • Data science is thought of lying at the intersection of computer science, statistics, and substantive application domains. From computer science comes machine learning and high-performance computing technologies for dealing with scale. From statistics comes a long tradition of exploratory data analysis, significance testing, and visualization. From application domains in business and the sciences comes challenges worthy of battle, and evaluation standards to assess when they have been adequately conquered.
  • 4.
    • Drew Conwayin 2013, called The Data Science Venn Diagram, in which he drew the following diagram to indicate the various fields that come together to form what we call “data science.” The Data Science Venn Diagram
  • 5.
    The Data ScienceVenn Diagram
  • 6.
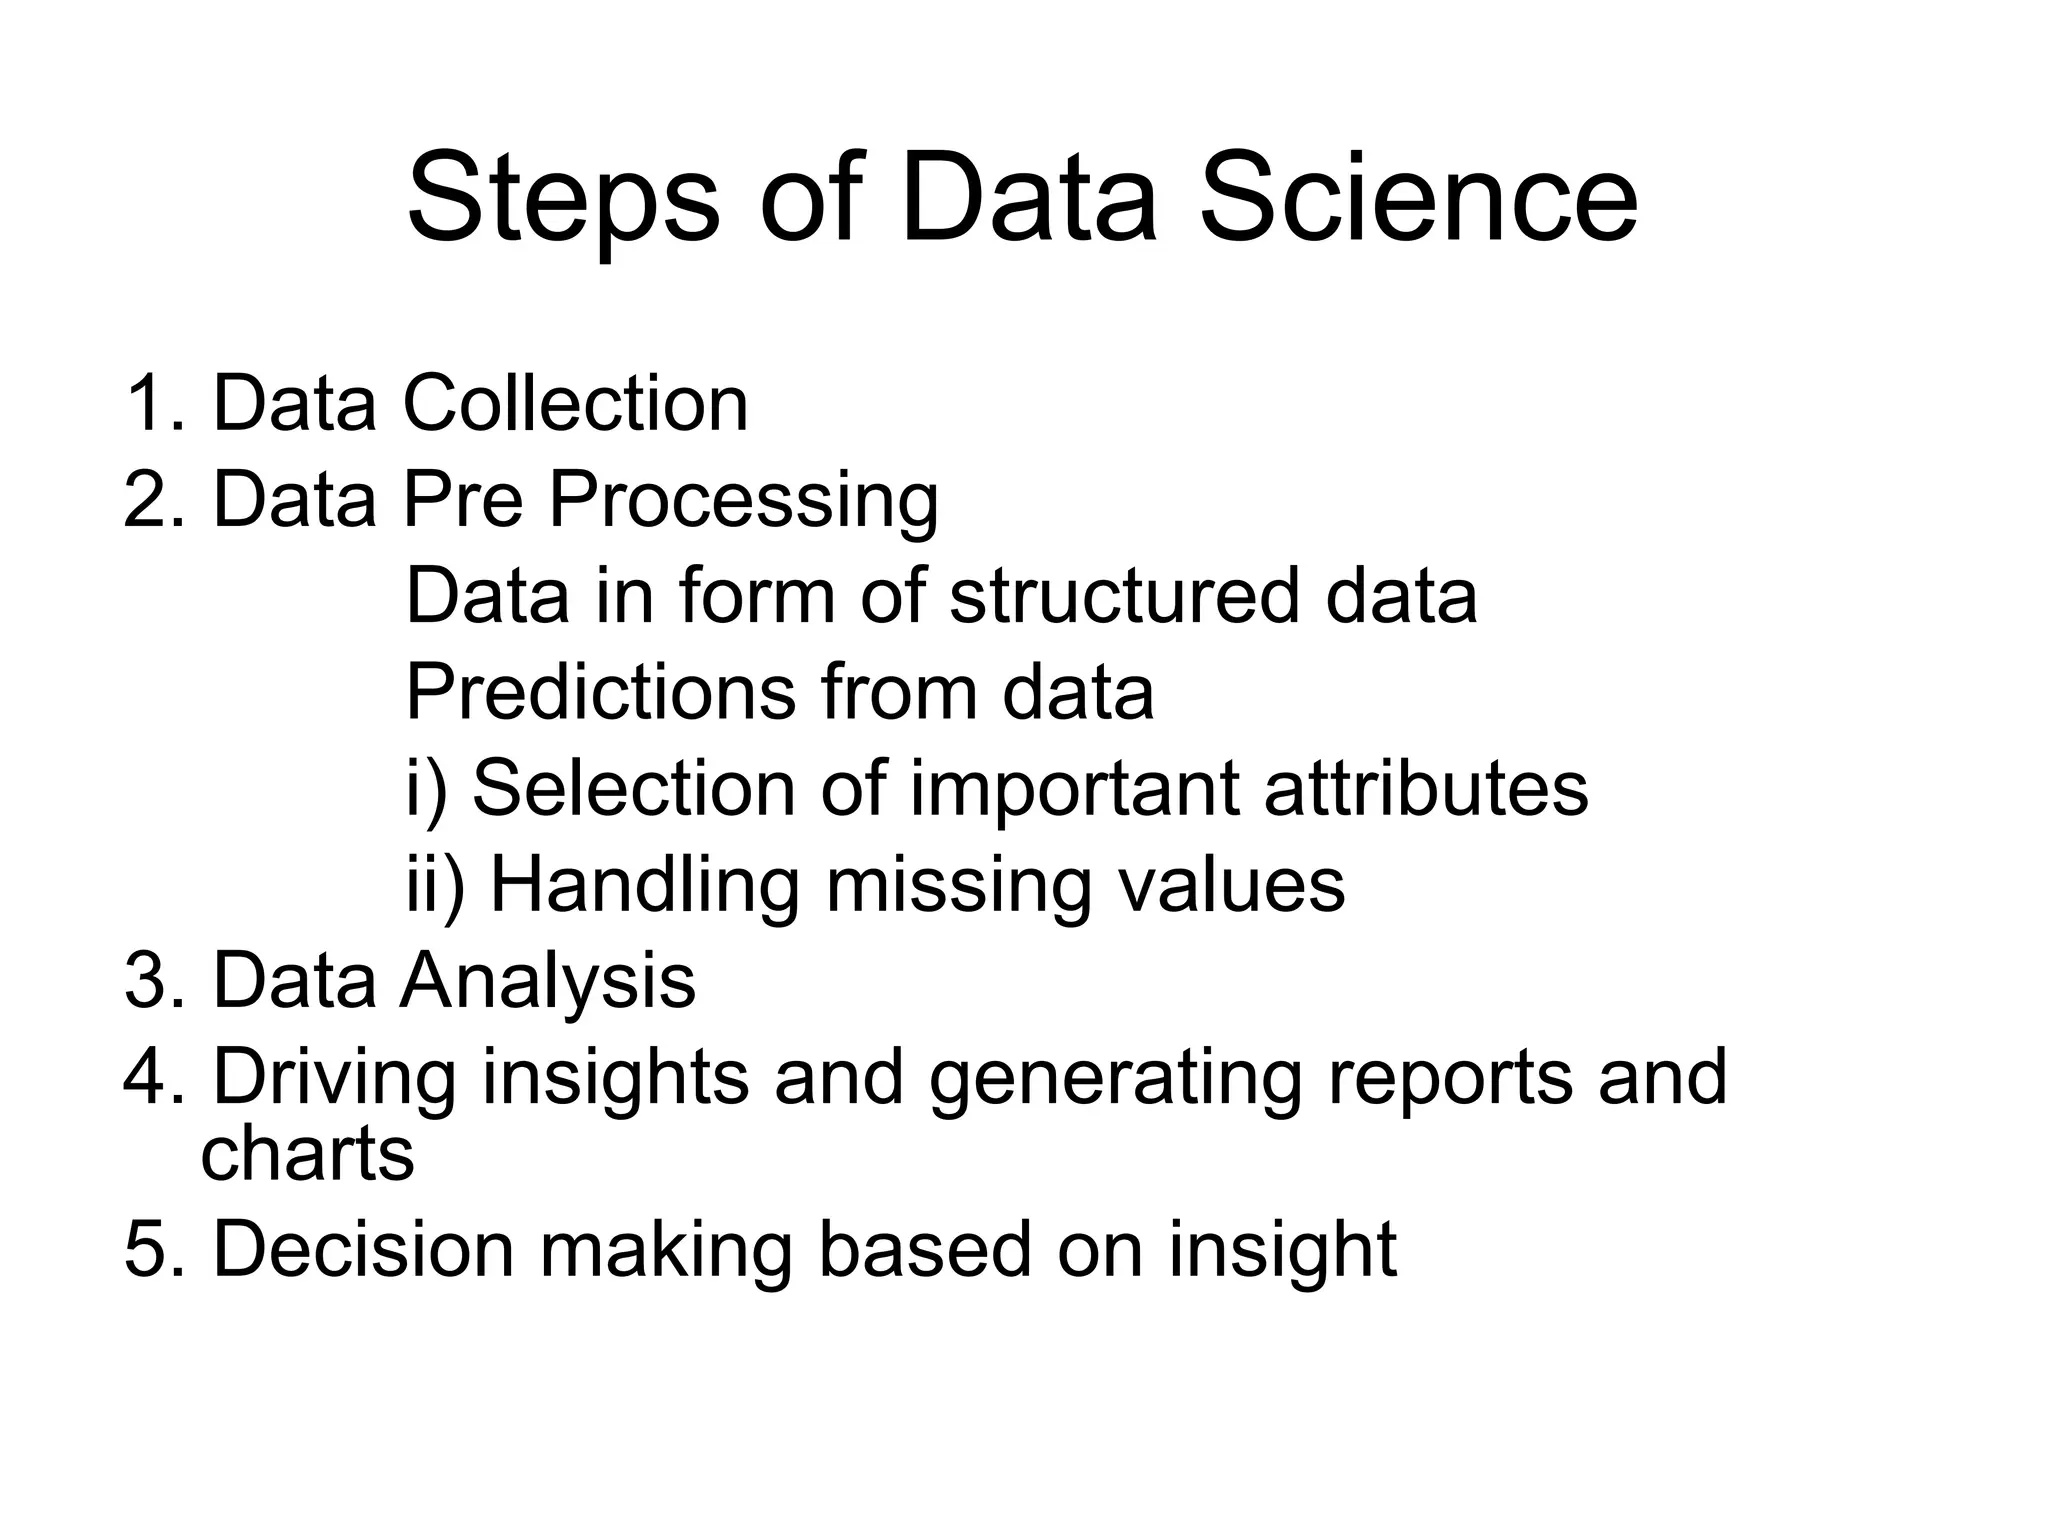
    Steps of DataScience 1. Data Collection 2. Data Pre Processing Data in form of structured data Predictions from data i) Selection of important attributes ii) Handling missing values 3. Data Analysis 4. Driving insights and generating reports and charts 5. Decision making based on insight
  • 7.
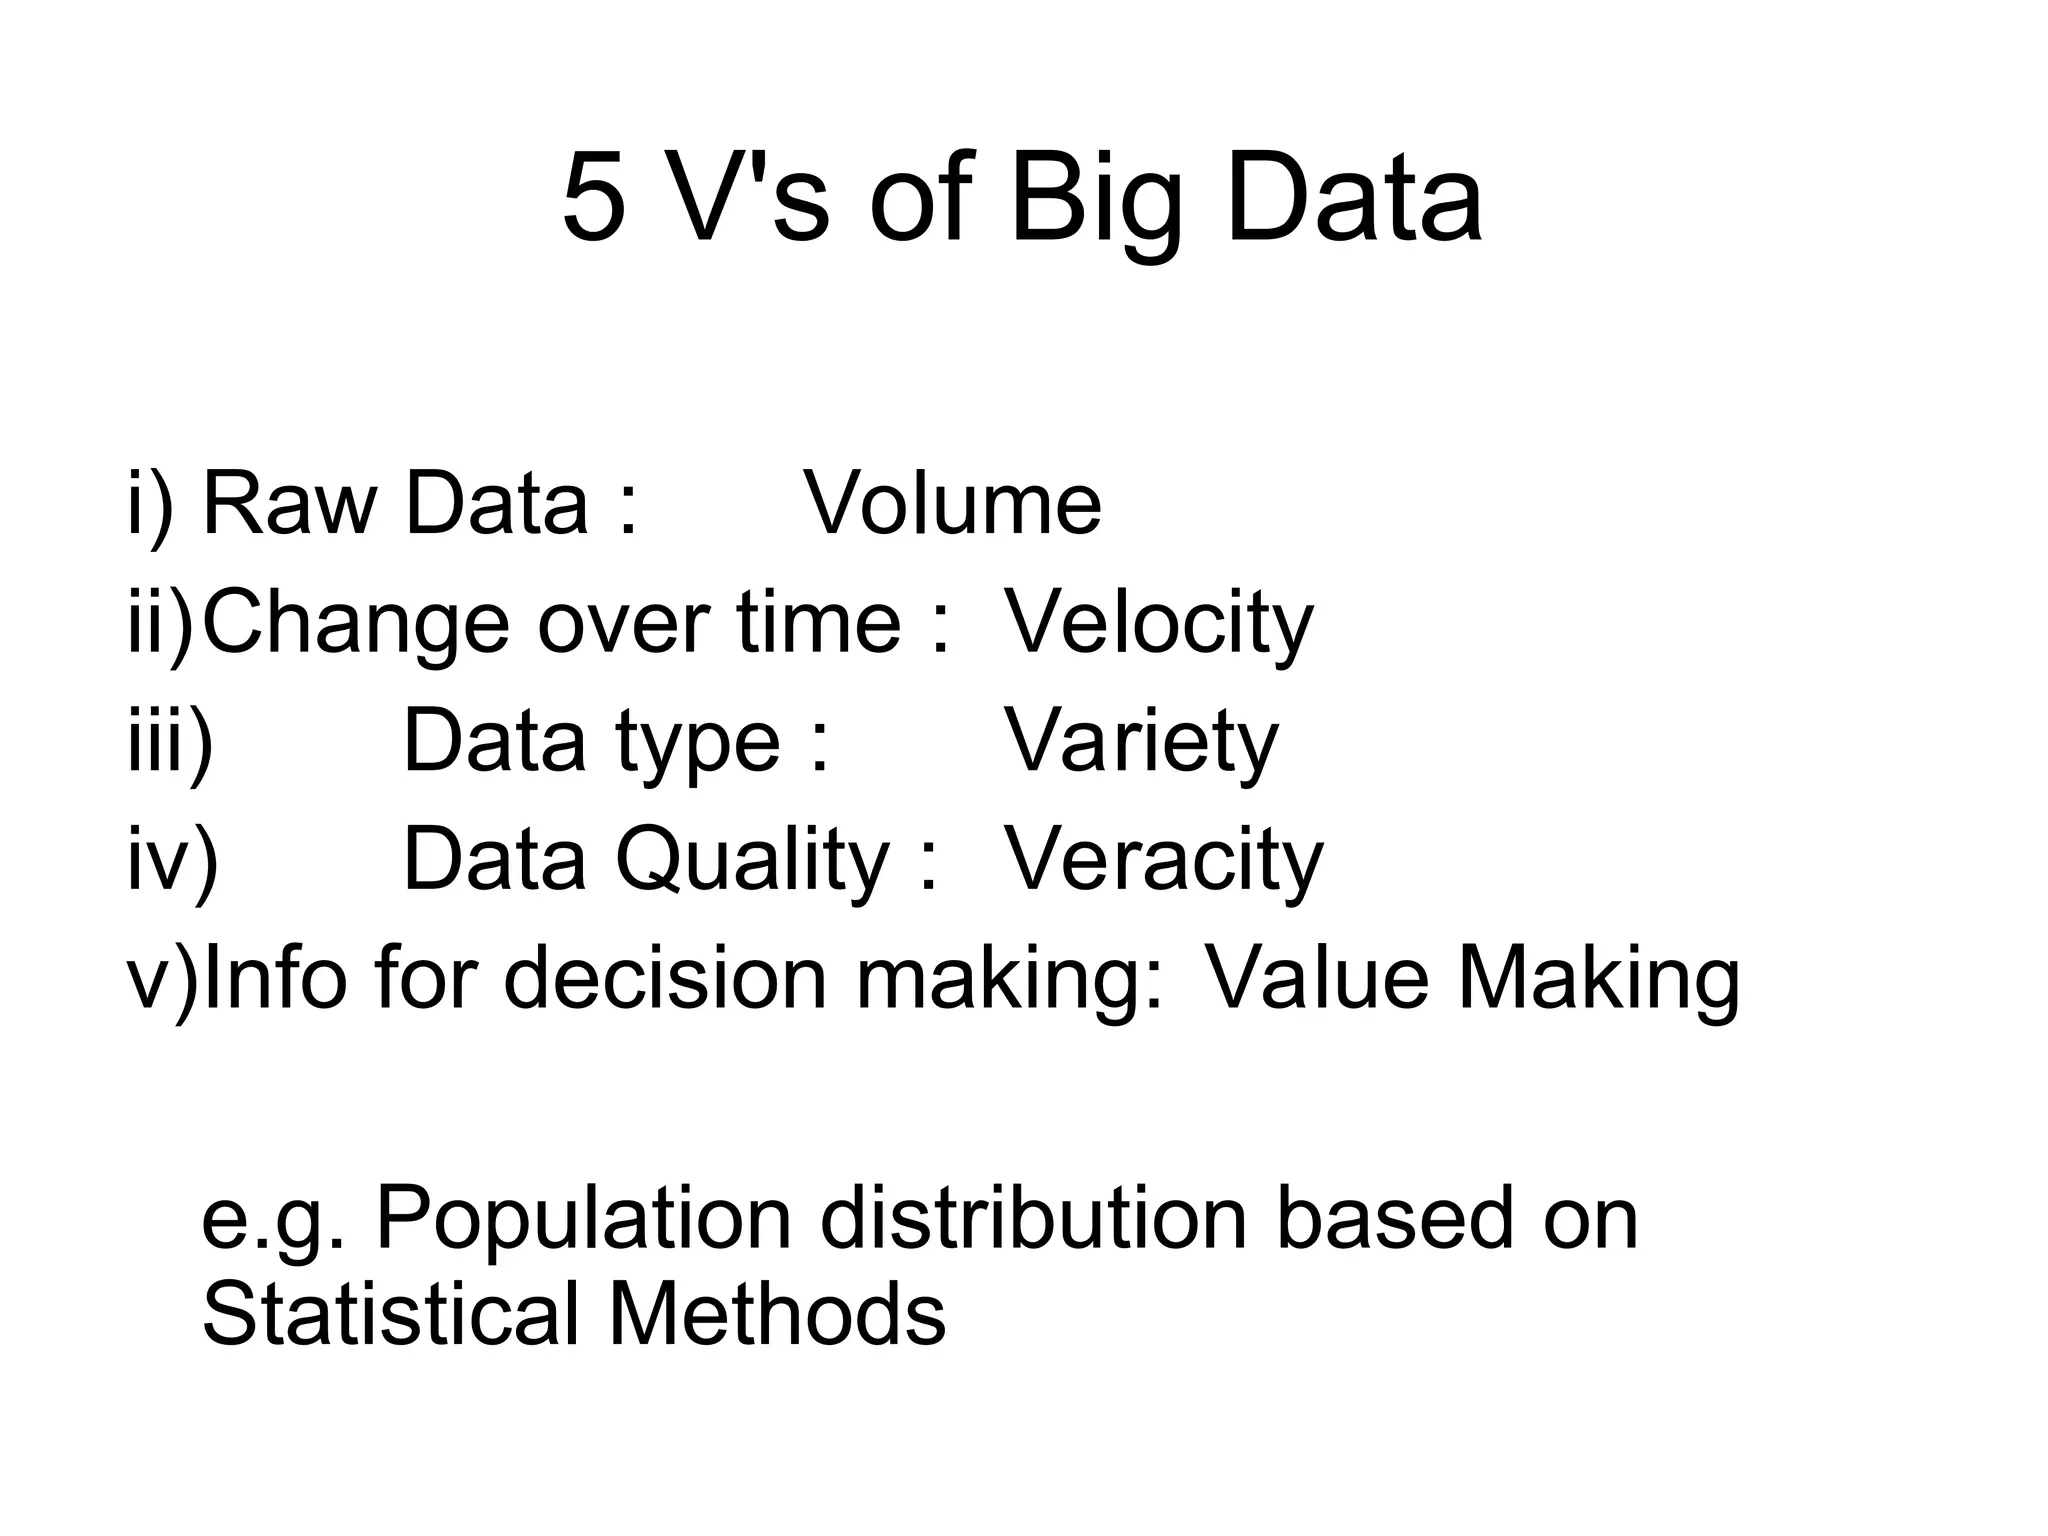
    5 V's ofBig Data i) Raw Data : Volume ii)Change over time : Velocity iii) Data type : Variety iv) Data Quality : Veracity v)Info for decision making: Value Making e.g. Population distribution based on Statistical Methods
  • 8.
    TASKS OF DATASCIENTISTS
  • 9.
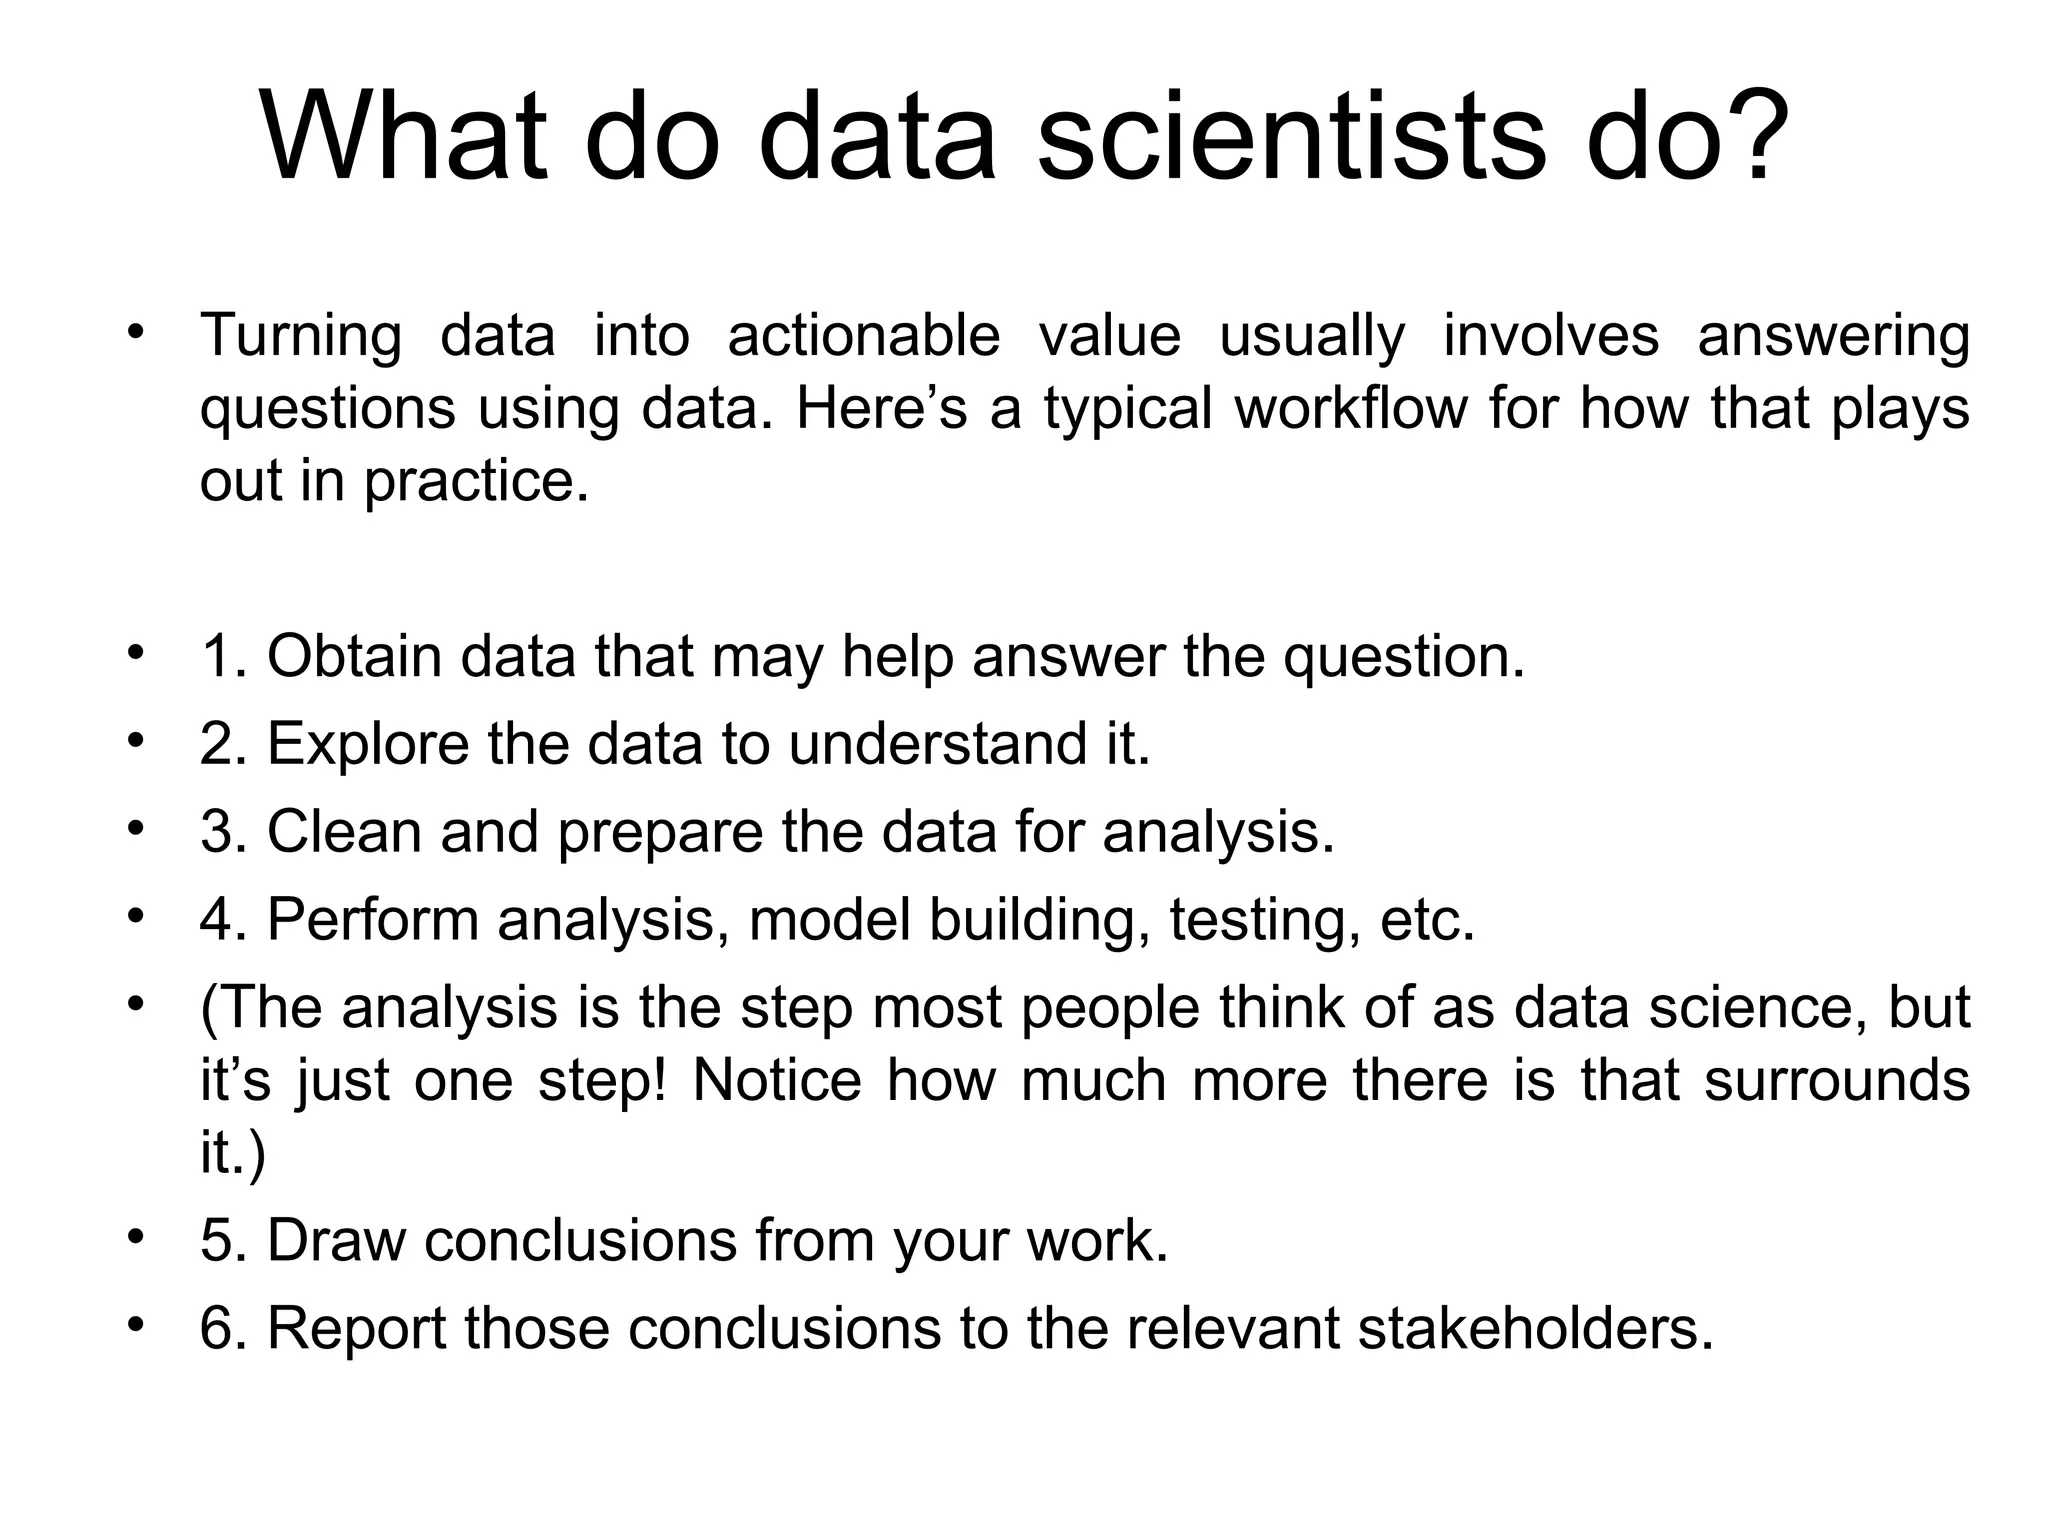
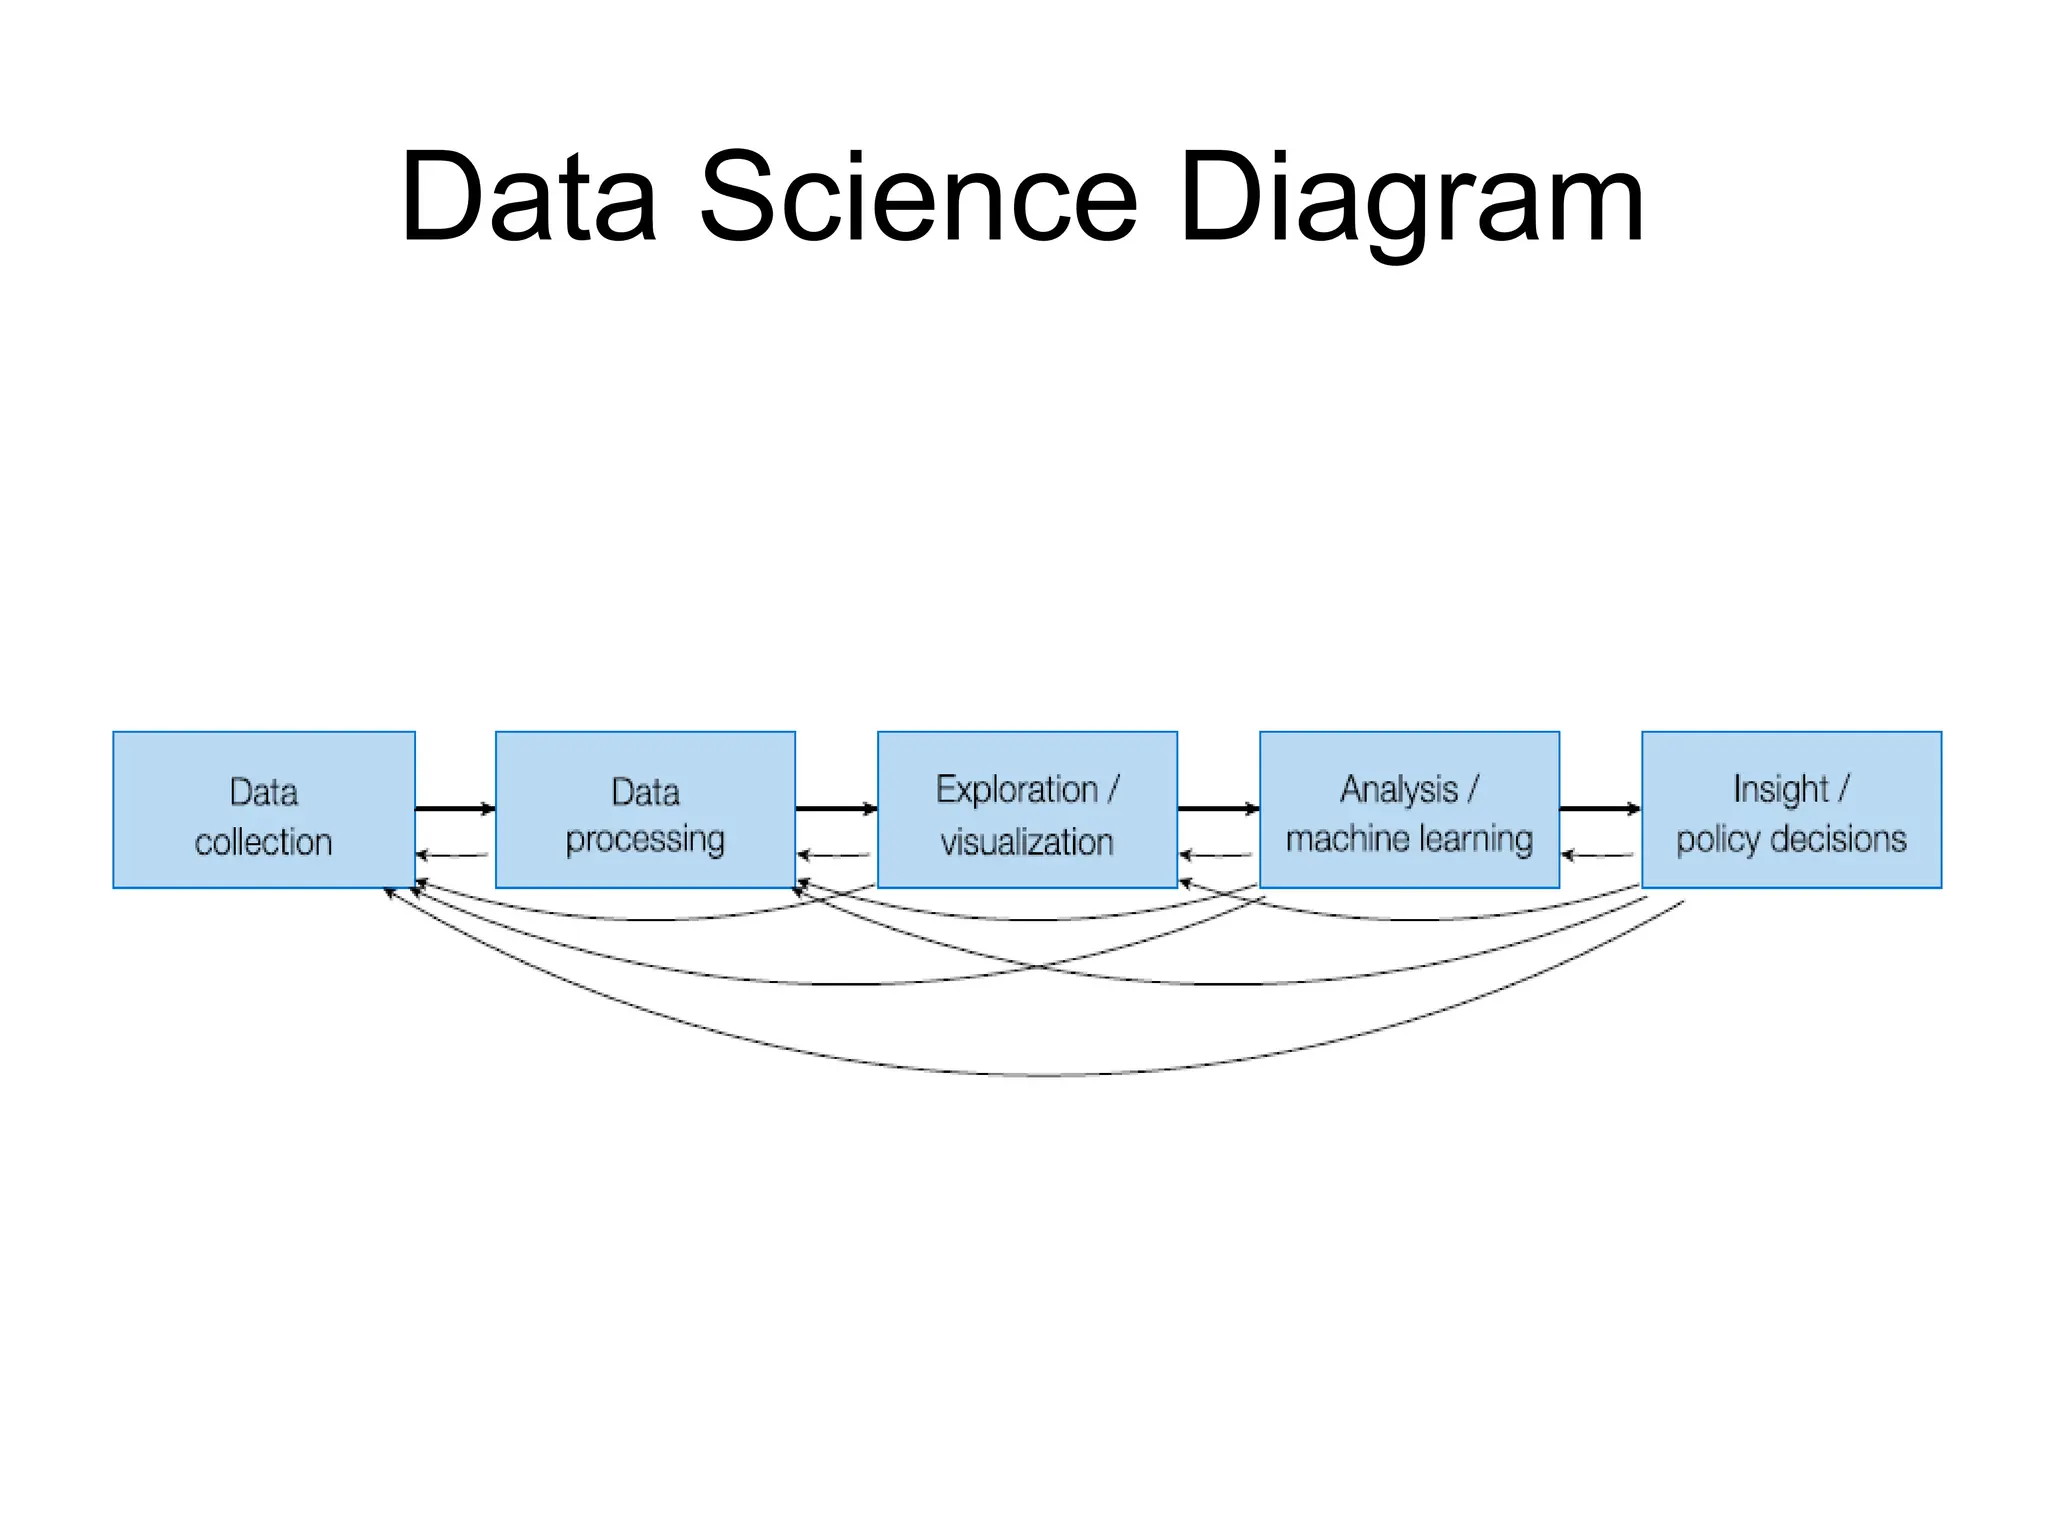
    What do datascientists do? • Turning data into actionable value usually involves answering questions using data. Here’s a typical workflow for how that plays out in practice. • 1. Obtain data that may help answer the question. • 2. Explore the data to understand it. • 3. Clean and prepare the data for analysis. • 4. Perform analysis, model building, testing, etc. • (The analysis is the step most people think of as data science, but it’s just one step! Notice how much more there is that surrounds it.) • 5. Draw conclusions from your work. • 6. Report those conclusions to the relevant stakeholders.
  • 10.
    What should welearn in Data Science? • Introductory Data analysis • Simple Linear Regression • Hypothesis Testing • Statistics, Mathematical Modeling, Econometrics is added advantage but not mandatory for Data Science
  • 12.
    Foundational aspects ofdata science • Mathematics: We should cover foundational mathematical concepts, such as functions, relations, assumptions, conclusions, and abstraction, so that we can use these concepts to define and understand many aspects of data manipulation. We will also make use of statistical formulae including graphs for social network analysis, matrices for finding themes in relations, and supervised machine learning. • Technology: We will extend our Python knowledge with more advanced table manipulation functions, extended practice with data cleaning and manipulation tasks, computational notebooks (such as Jupyter), and GitHub for version control and project publishing.
  • 13.
    Foundational aspects ofdata science • Visualization: We will learn new types of plots for a wide variety of data types and what you intend to communicate about them. We will also study the general principles that govern when and how to use visualizations and will learn how to build and publish interactive online visualizations (dashboards). • Communication: We will study how to write comments in code, documentation for code, motivations in computational notebooks, interpretation of results in computational notebooks, and technical reports about the results of analyses. We will prioritize clarity, brevity, and knowing the target audience. Many of these same principles will arise when creating presentations or videos as well. Each of these modes of communication is required at some point in our course.
  • 14.
    Technical View ofData Science • We will discuss Data Science in terms of scientific analysis and data extraction from huge unstructured data
  • 15.
    Data Science isan interdisciplinary field about scientific methods, processes, and systems to extract knowledge or insights from data in various forms, either structured or unstructured, similar to data mining. “Unstructured data” can include emails, videos, photos, social media, and other user-generated content. Data science often requires sorting through a great amount of information and writing algorithms to extract insights from this data. Data Science
  • 16.
    Data Science • Datascience is the application of computational and statistical techniques to address or gain insight into some problem in the real world • Mathematically Data science = statistics + data processing + machine learning + scientific inquiry + visualization + business analytics + big data + …
  • 17.
  • 18.
  • 19.
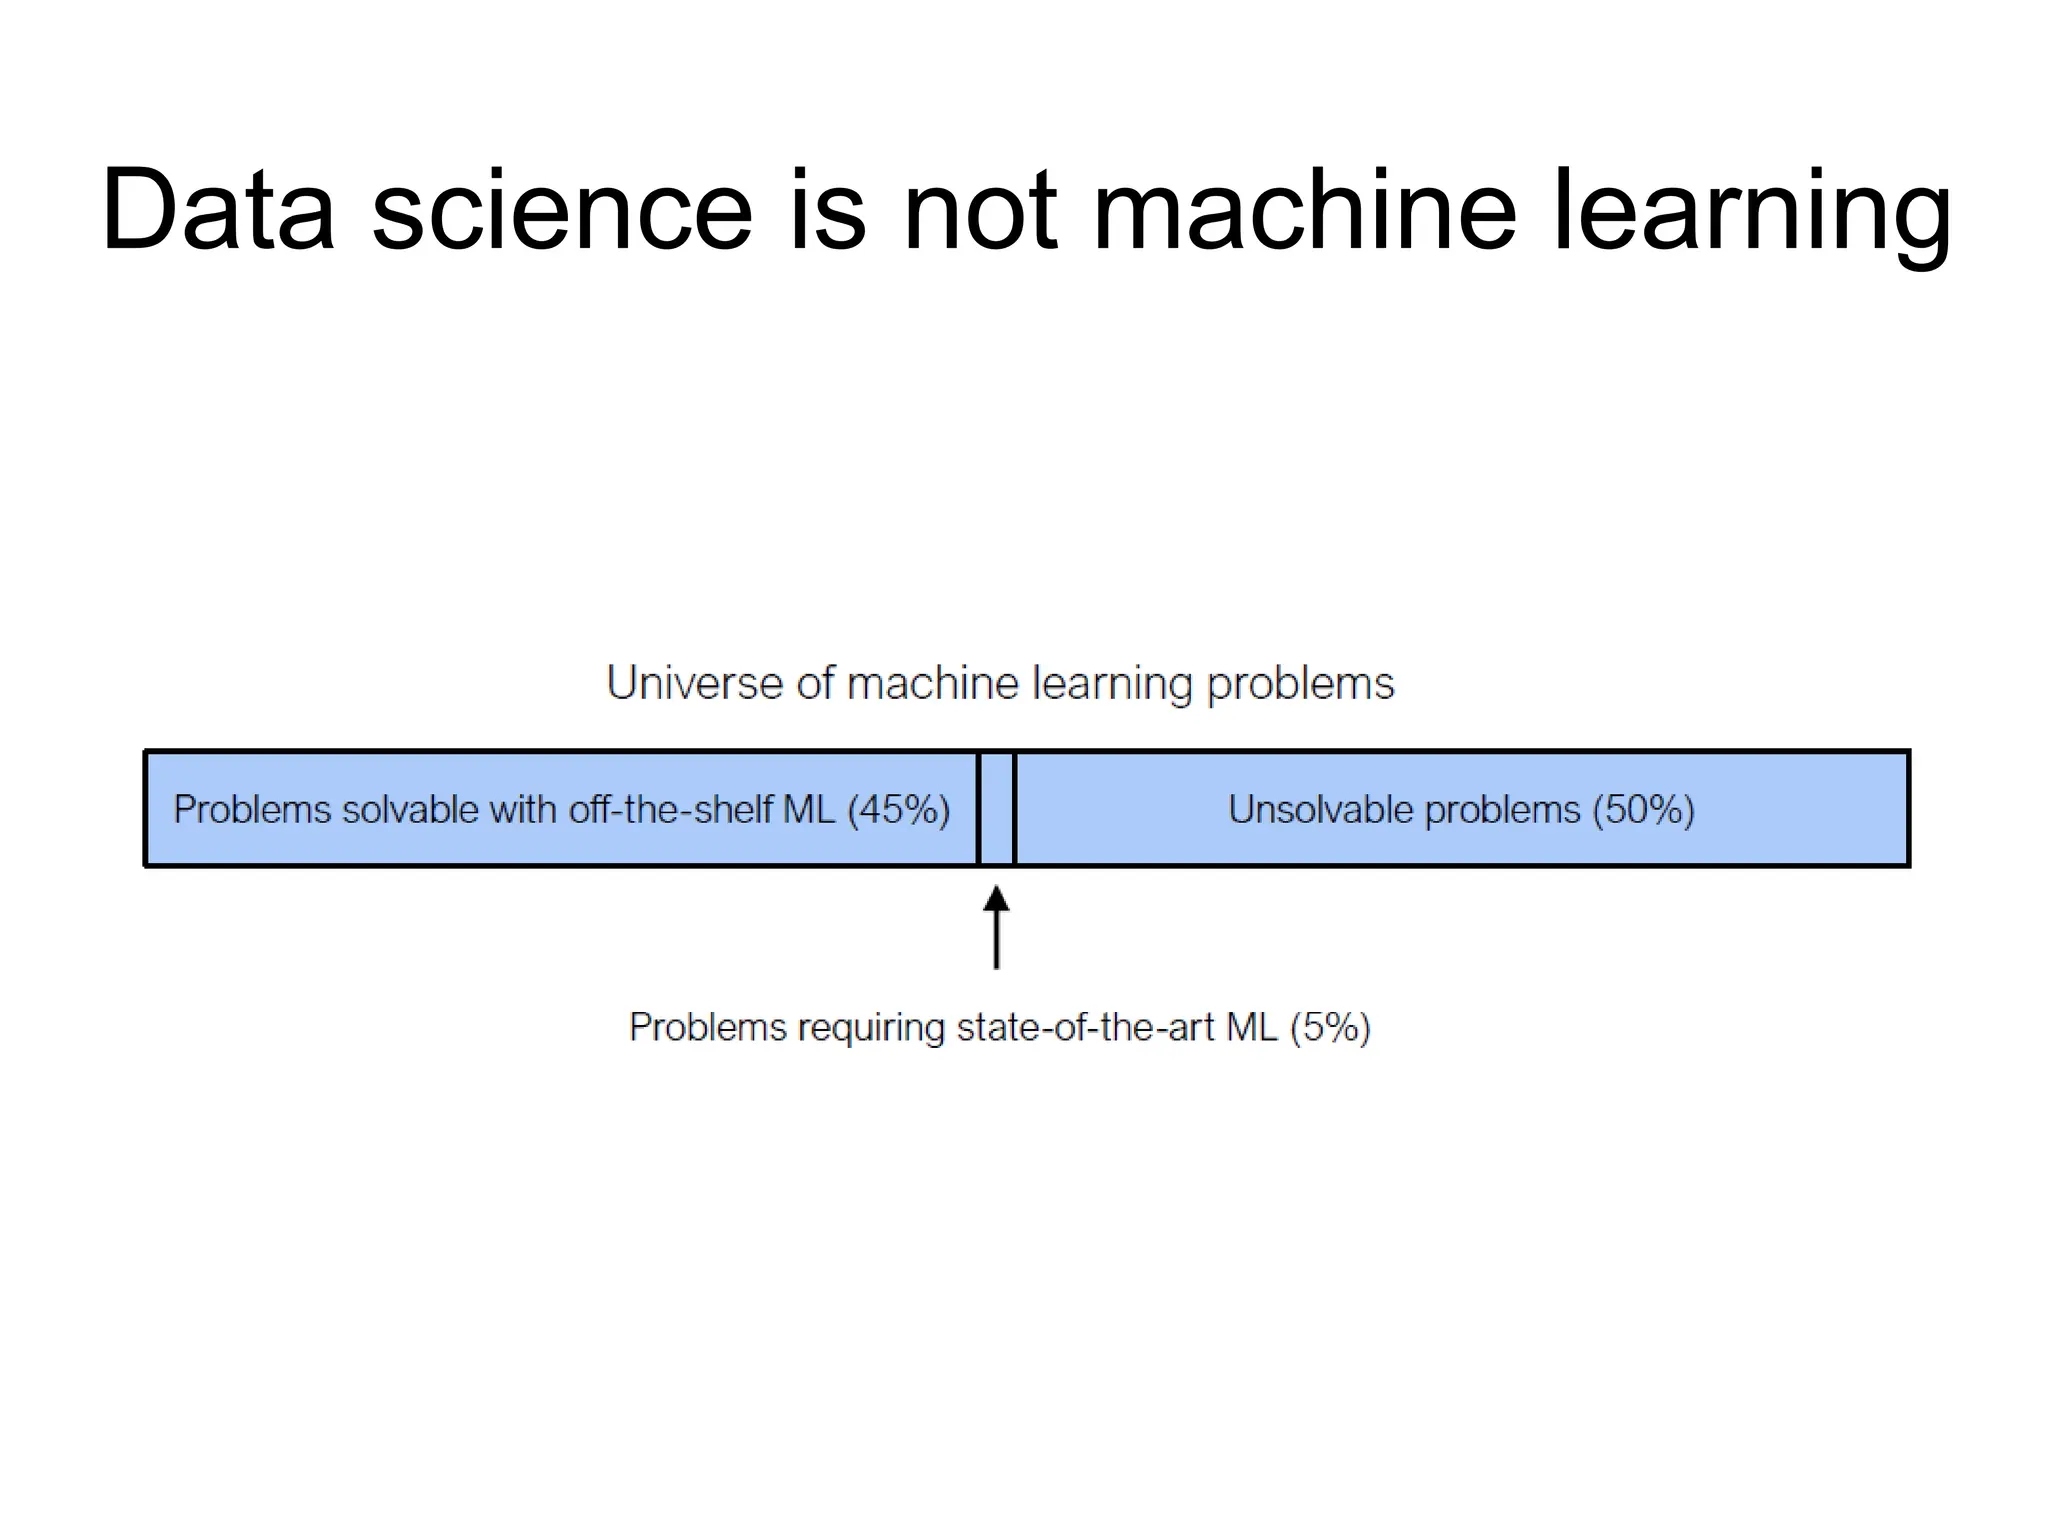
    Data science isnot machine learning • Machine learning involves computation and statistics, but has not (traditionally) been very concerned about answering scientific questions • Machine learning has a heavy focus on fancy algorithms… • ... but sometimes the best way to solve a problem is just by visualizing the data, for instance
  • 20.
    Data science isnot machine learning
  • 21.
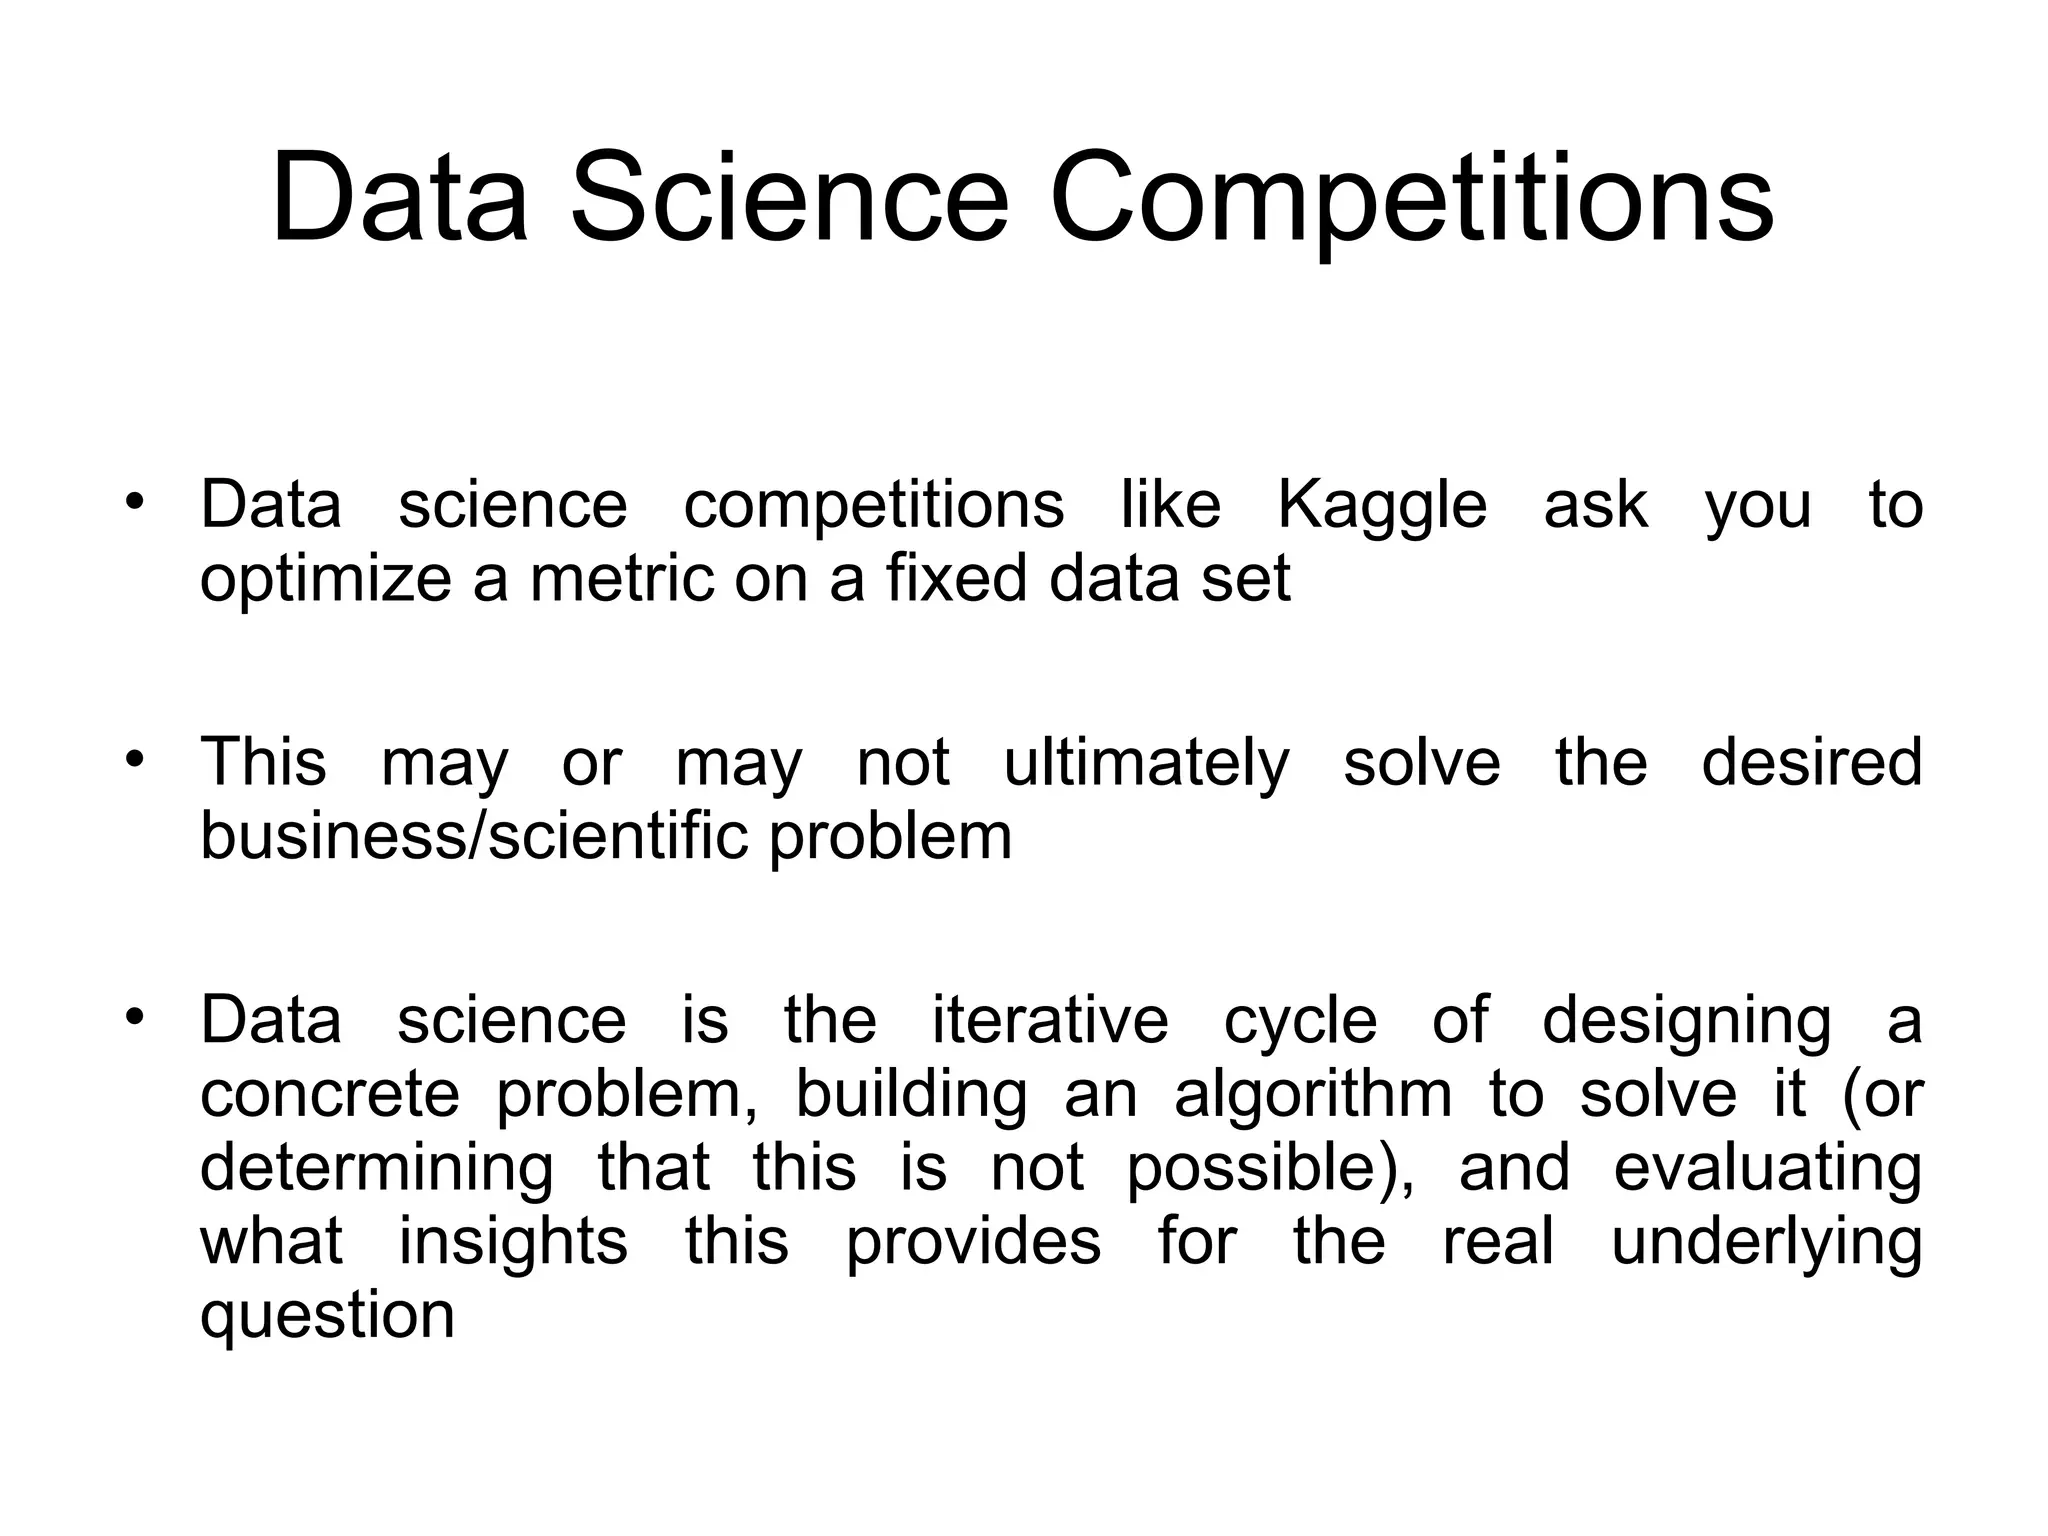
    Data Science Competitions •Data science competitions like Kaggle ask you to optimize a metric on a fixed data set • This may or may not ultimately solve the desired business/scientific problem • Data science is the iterative cycle of designing a concrete problem, building an algorithm to solve it (or determining that this is not possible), and evaluating what insights this provides for the real underlying question
  • 22.
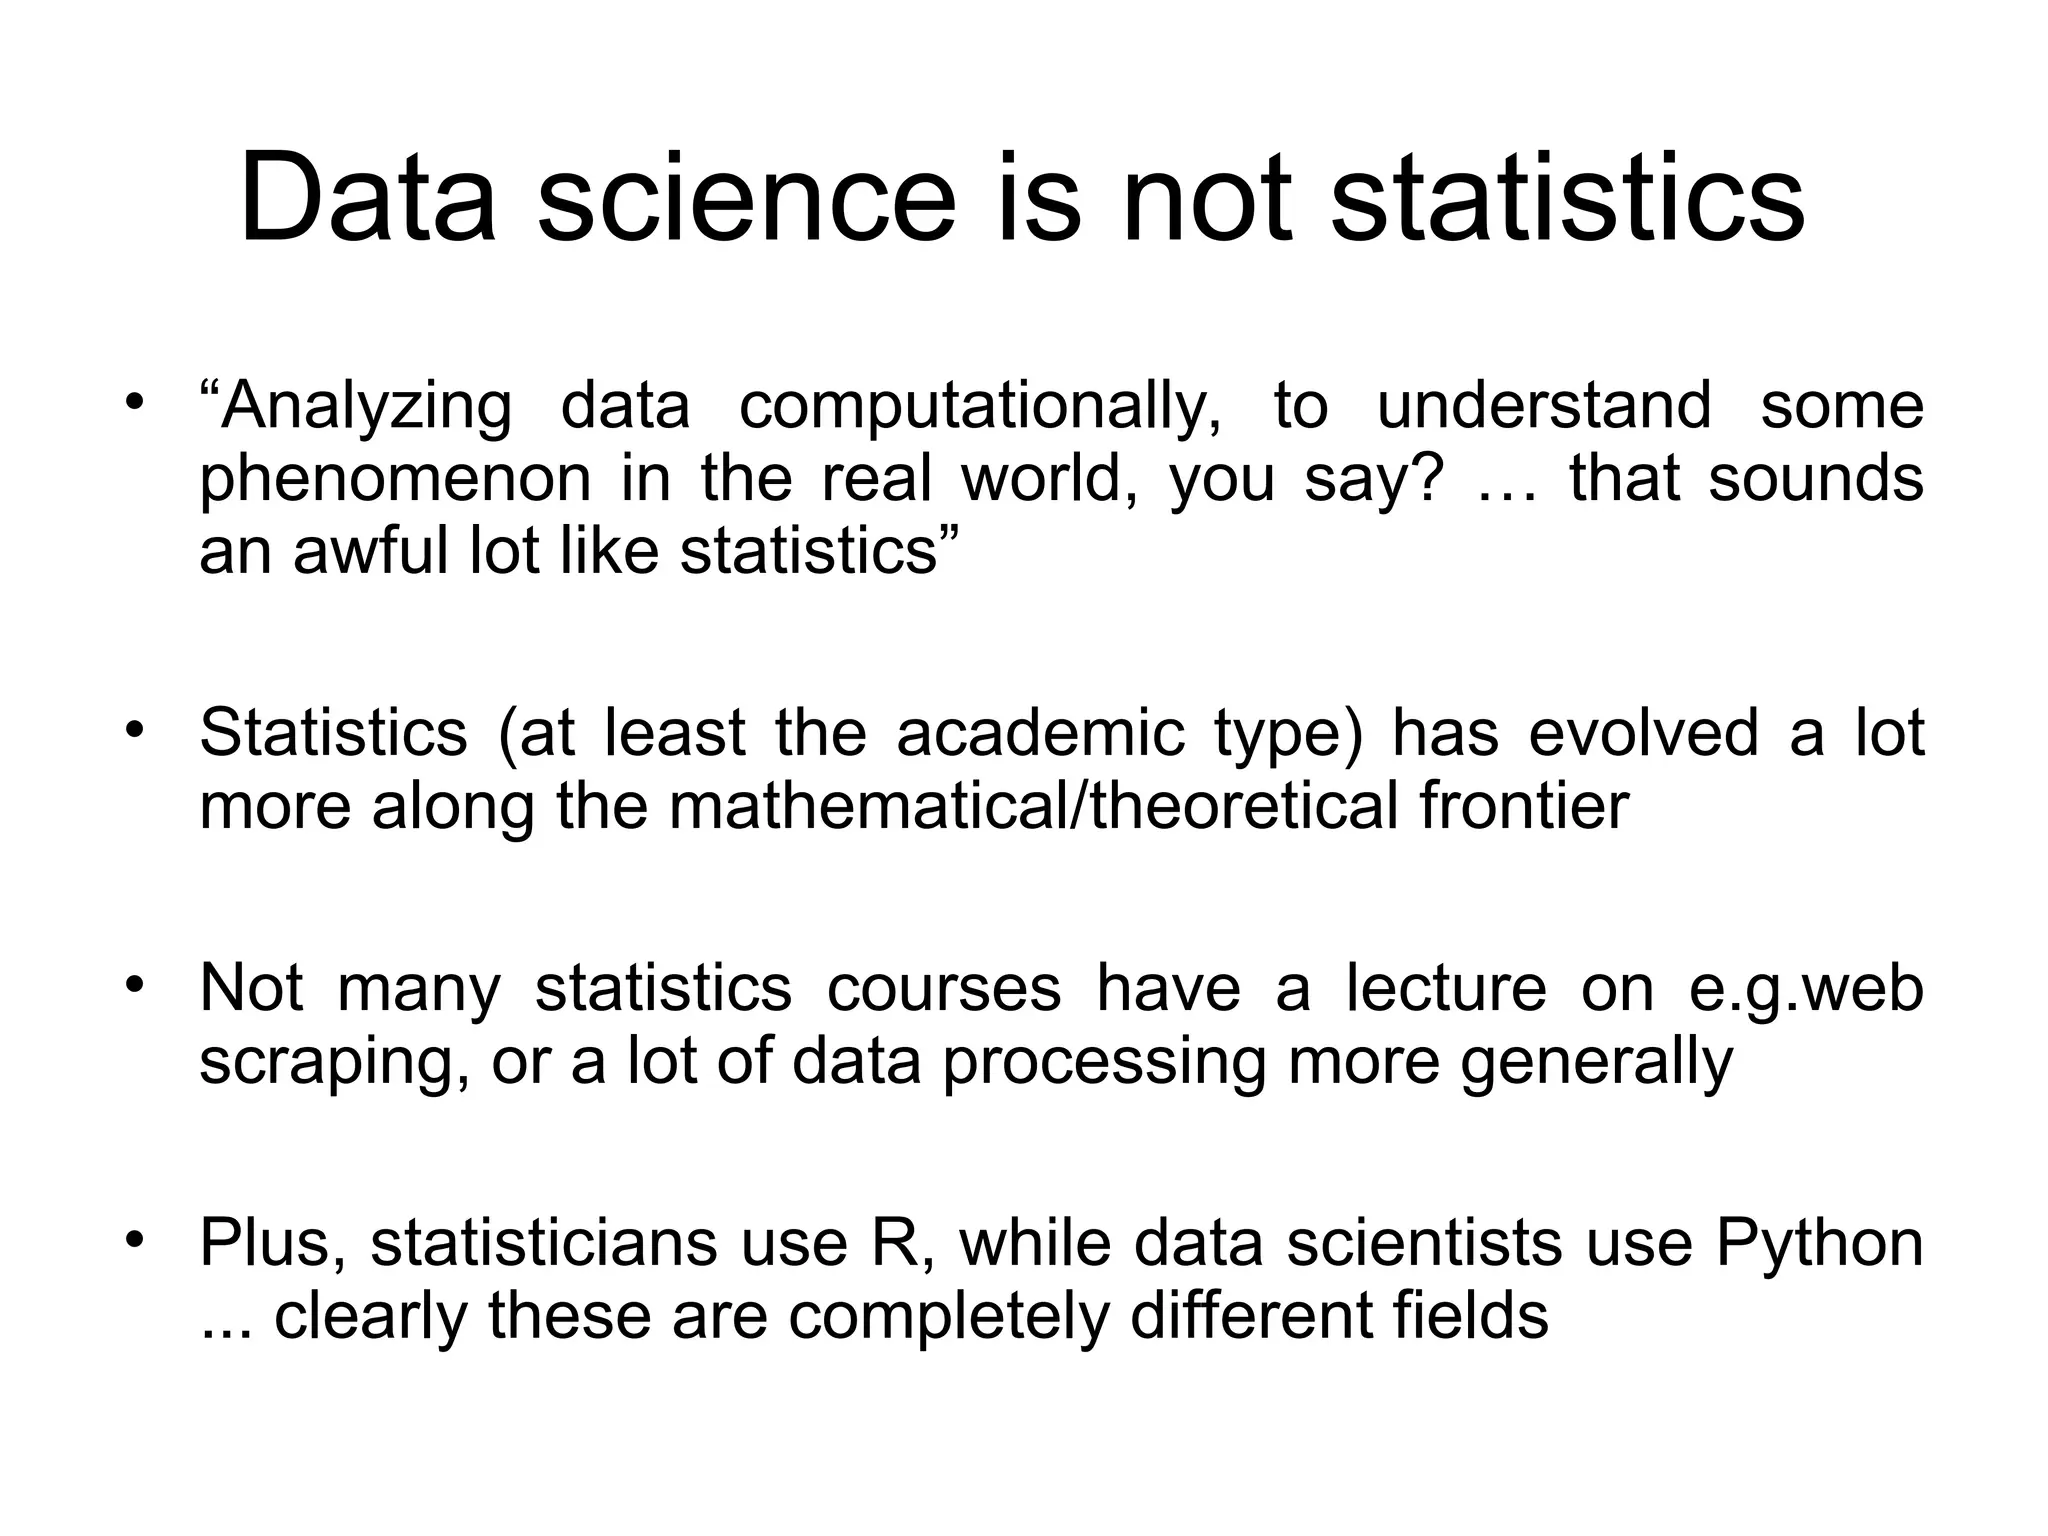
    Data science isnot statistics • “Analyzing data computationally, to understand some phenomenon in the real world, you say? … that sounds an awful lot like statistics” • Statistics (at least the academic type) has evolved a lot more along the mathematical/theoretical frontier • Not many statistics courses have a lecture on e.g.web scraping, or a lot of data processing more generally • Plus, statisticians use R, while data scientists use Python ... clearly these are completely different fields
  • 23.
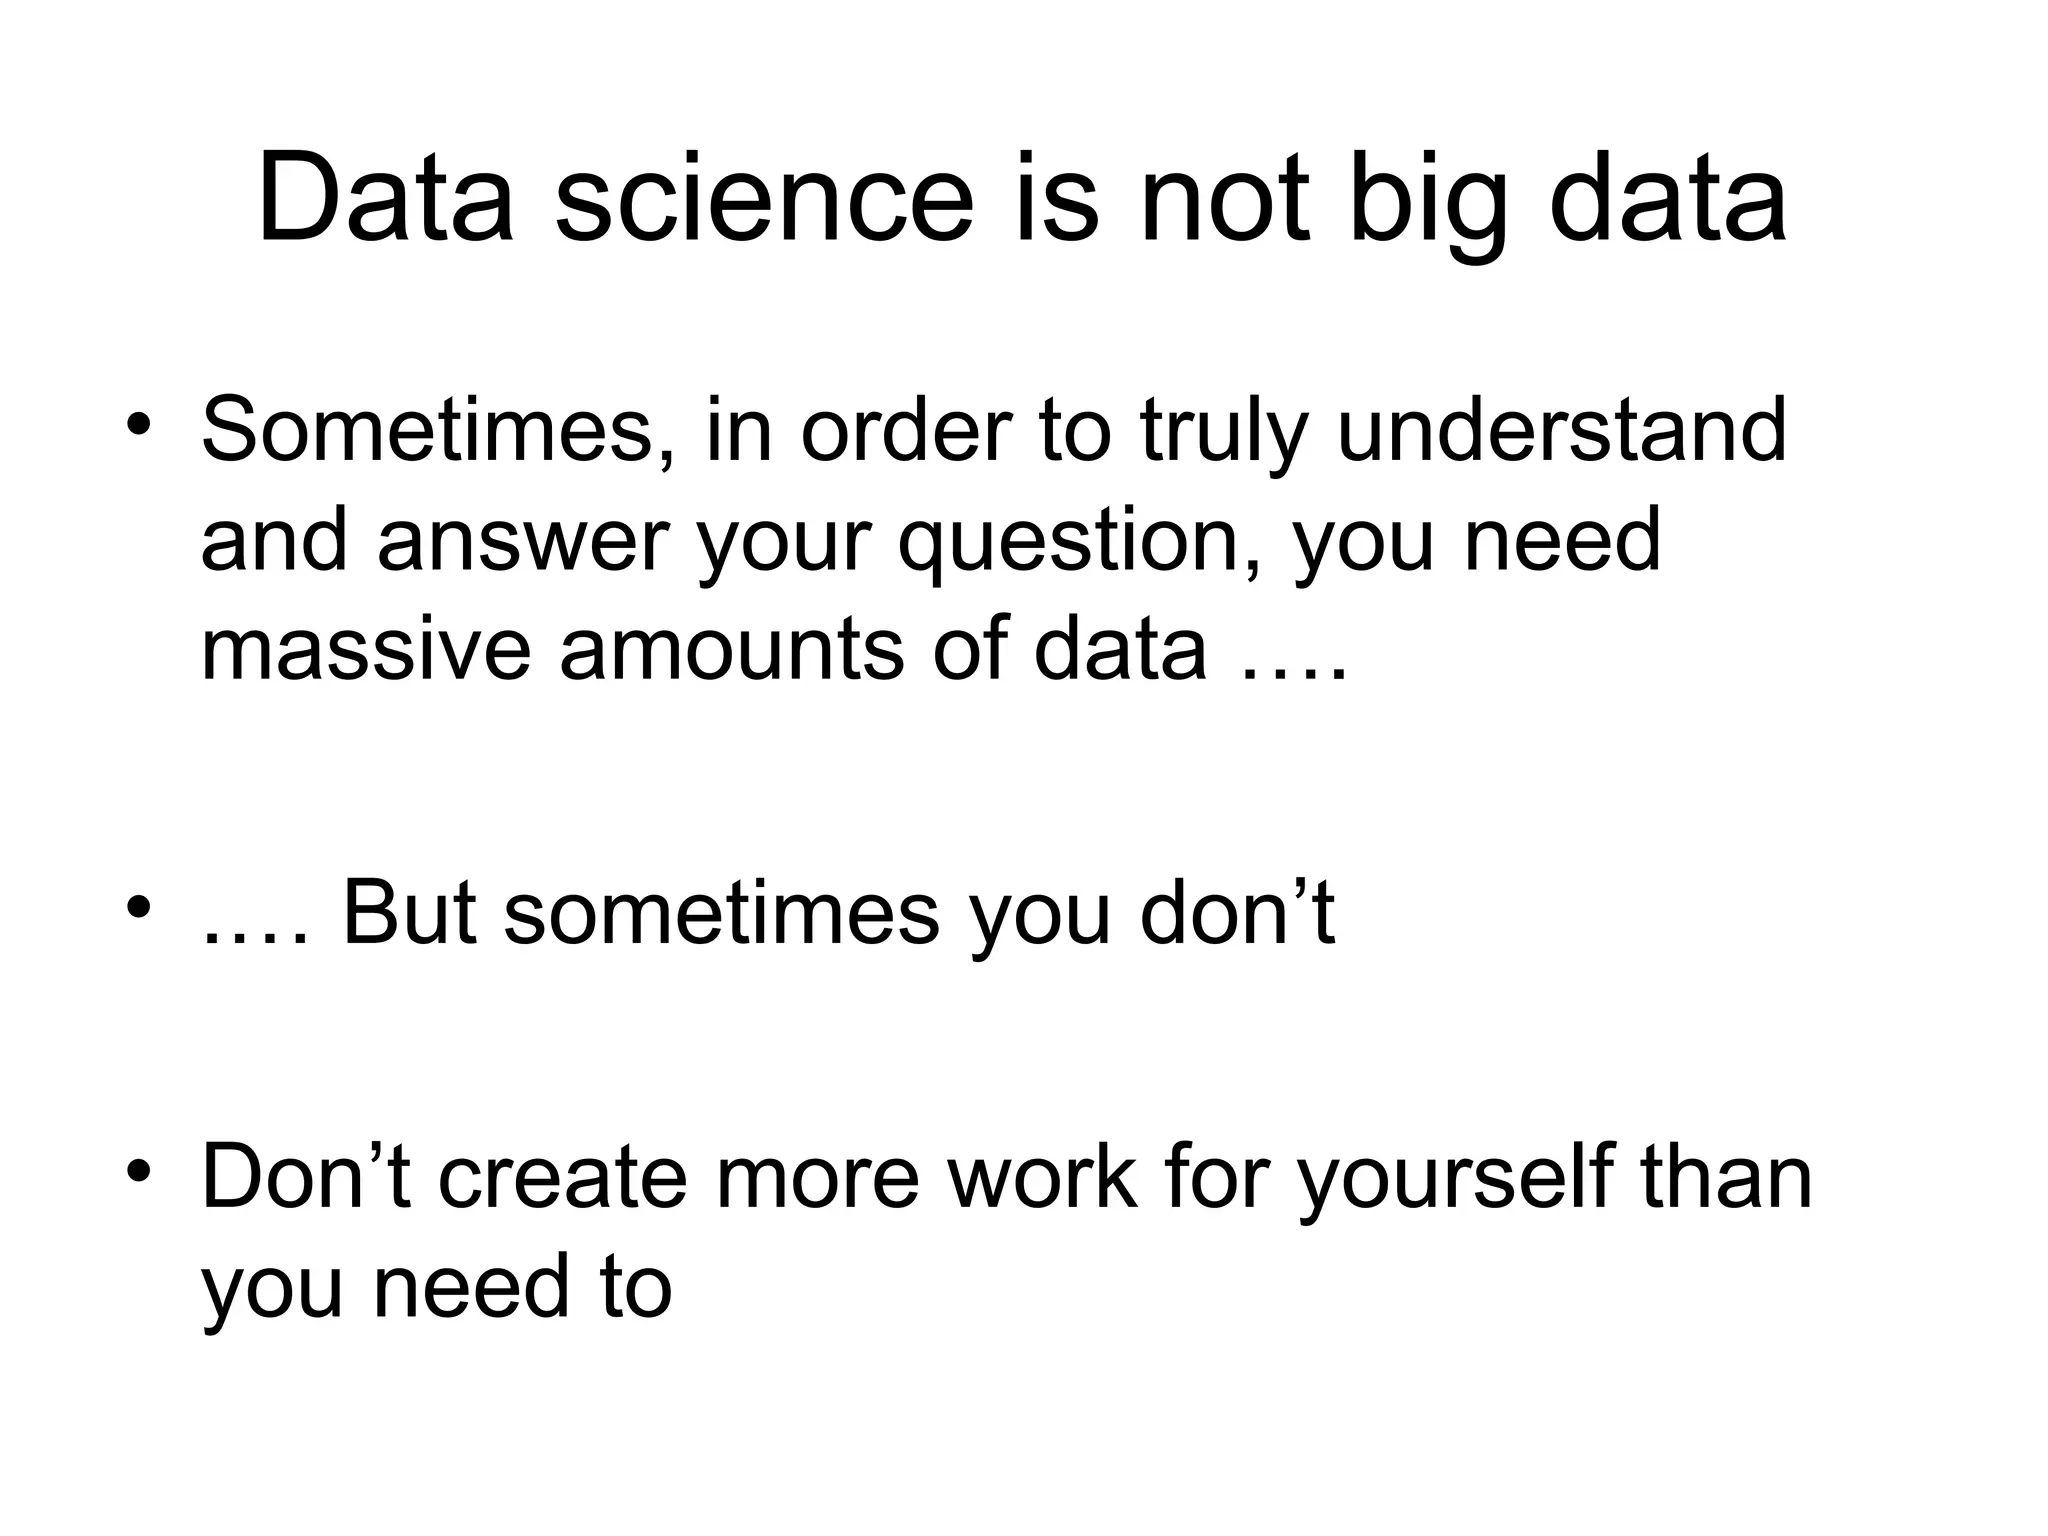
    Data science isnot big data • Sometimes, in order to truly understand and answer your question, you need massive amounts of data …. • .… But sometimes you don’t • Don’t create more work for yourself than you need to
  • 24.
  • 25.
  • 27.
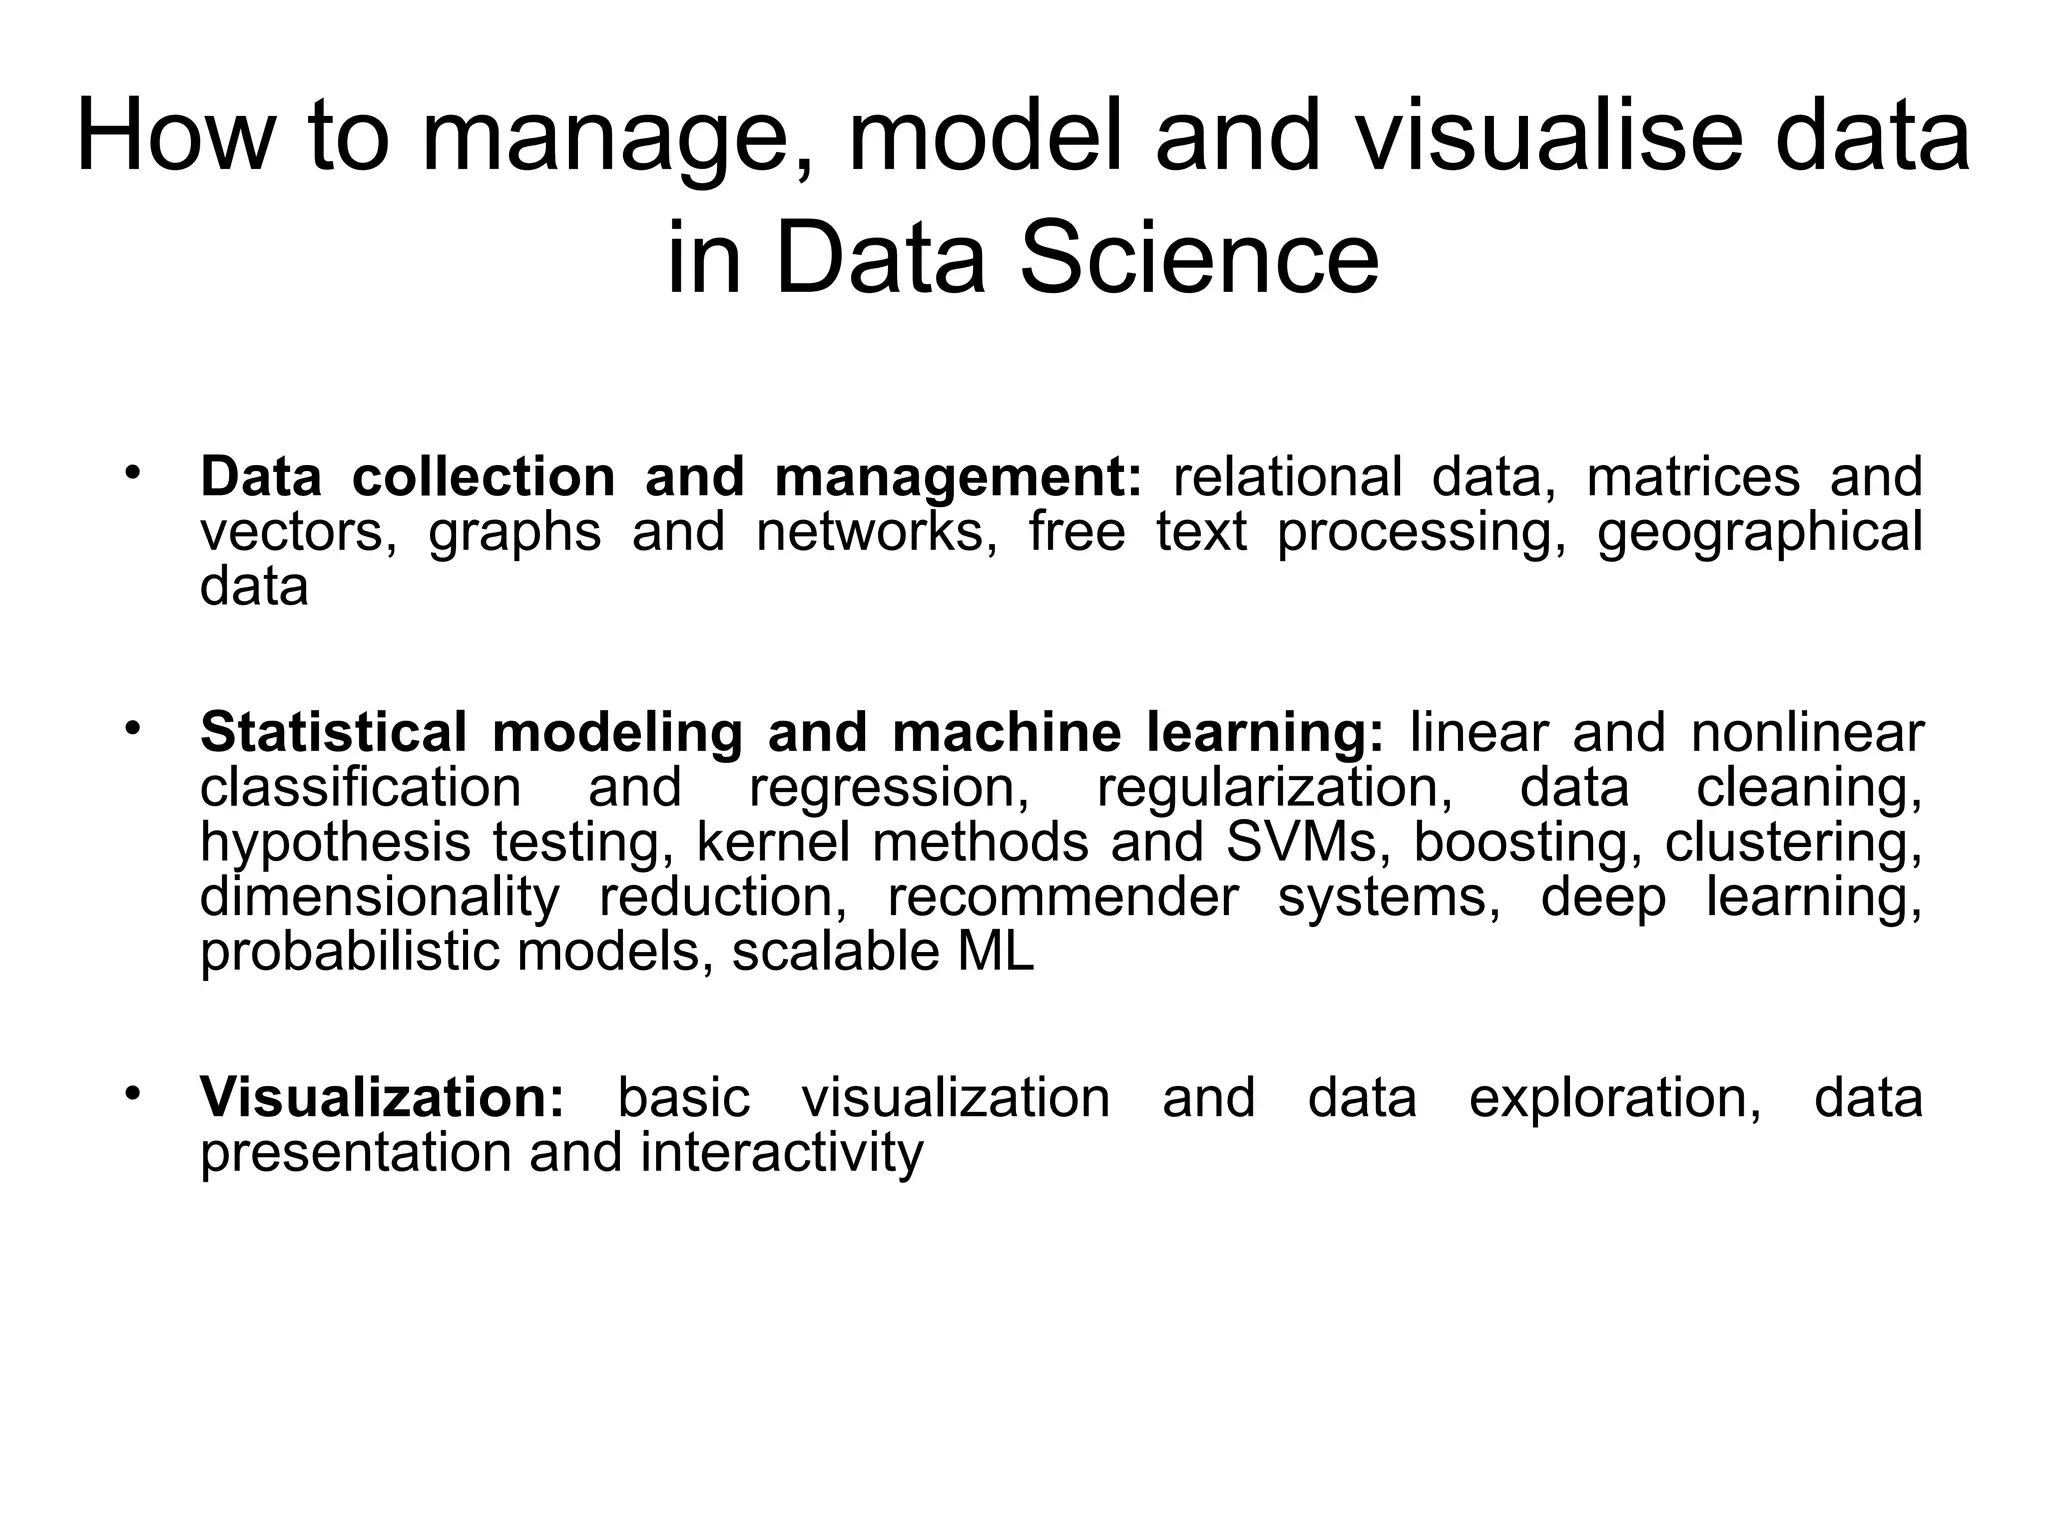
    How to manage,model and visualise data in Data Science • Data collection and management: relational data, matrices and vectors, graphs and networks, free text processing, geographical data • Statistical modeling and machine learning: linear and nonlinear classification and regression, regularization, data cleaning, hypothesis testing, kernel methods and SVMs, boosting, clustering, dimensionality reduction, recommender systems, deep learning, probabilistic models, scalable ML • Visualization: basic visualization and data exploration, data presentation and interactivity