Download to read offline
![International Research Journal of Engineering and Technology (IRJET) e-ISSN: 2395-0056 Volume: 09 Issue: 03 | Mar 2022 www.irjet.net p-ISSN: 2395-0072 © 2022, IRJET | Impact Factor value: 7.529 | ISO 9001:2008 Certified Journal | Page 2152 Stock Price Prediction using Machine Learning Algorithms: ARIMA, LSTM & Linear Regression Krushali Sohil Patel1, Udit Rajesh Prahladka1, Jaykumar Babulal Patel1, Yogita Shelar2 1Dept. of Information Technology, Atharva College of Engineering, Maharashtra, India 2Assistant Professor, Dept. of Information Technology, Atharva College of Engineering, Maharashtra, India ---------------------------------------------------------------------***--------------------------------------------------------------------- Abstract - This paper aims to promote the use of the ARIMA, LSTM & Linear Regression algorithm to predict stock prices of NASDAQ (American) and NSE (Indian) and to compare their accuracy. These are machine learning algorithms used for historical stock 2 years ago and real- time stock prices. The NASDAQ stock data was downloaded from the Yahoo Finance API and that the NSE stock was downloaded from the Alpha Vantage API. The full source code of the project was written via Python. It is thought that the ARIMA and LSTM models are more compatible than the Linear Regression model for the NASDAQ (American Company) forecasting model. Although, in the NSE (Indian Company) stocks, LSTM and Linear Regression appear to be more efficient than ARIMA. Key Words: Machine Learning, ARIMA, LSTM, Linear Regression, Stock Market, Prediction, Stock Exchange, Trading, Time Series, Historical Data, Python 1. INTRODUCTION Stock prices fluctuate greatly naturally. They vary based on various factors such as previous prices, current market scenario, financial matters, competing companies etc. It is important to have an accurate forecast of future trends in stock prices with wise investment decisions [1] [2]. However, the volatile nature of stock prices makes it difficult to measure accurately. Stock Market Prediction is an attempt to determine the future value of a company's stock [3]. NASDAQ stock stock prices were downloaded from the Yahoo Finance API and those of the NSE stock were downloaded from the Alpha Vantage API. This data was previous processed and transferred to Machine Learning models. Finally, the results for each model are shown. 2. LITERATURE REVIEW A. Machine learning strategies and application information for Stock Market forecasting information Paul D. Yoo, Maria H. Kim and Tony Jan compared and examined some of the existing ML strategies used to predict the stock market. After comparing easy retreats, multivariate retreats, Neural Networks, Vector Support Machines and Case Based Reasoning models concluded that Neural Networks provides the ability to predict market directions more accurately compared to other strategies. Vector Support Machines and Case Based Consultations are also popular in stock market predictions. In addition, they found that capturing event information on a predictive model plays a very important role in more accurate forecasting. The web provides up-to- date and up-to-date information about the stock market needed to deliver the highest accuracy of predictions and short-term forecasts [1]. B. Predicting Stock Stocks Using Financial News Articles M.I. Yasef Kaya and M. Elef Karshgil analyzed the relationship between the content of financial news articles and stock prices. Labeled news articles are positive or negative depending on their impact on the stock market. Instead of using one word as attributes, they use the names of pairs as attributes. The word couple included a combination of noun and verb. The SVM classifier was trained with labeled articles to predict stock prices. [2]. C. Predicting Market Market Indicators Through the Emotional Network Drs. Jay Joshi, Nisarg A Joshi in his career, used the neural artificial network (ANN) to predict stock prices in the respected Bombay Stock Exchange (BSE) Sensitive Index (Sensex) indexes. They performed experiments and case studies to compare neural network functionality with random mobility and direct autoregressive models. They reported that the neural network exceeds the direct and indirect travel models by all performance measurements in both sample and out-of-sample predictions for BSE Sensex daily return.[3] D. Stock price forecast using the ARIMA model Ayodele A. Adebiyi, Aderemi O. Adewumi and Charles K. Ayo used the ARIMA model to predict stock prices on data obtained from the New York Stock Exchange (NYSE) and the Nigeria Stock Exchange (NSE). They used a data set that included four components: open, low, near and high price. In their work, they have taken the amount of closure as a predictive factor. The reason for this is that the closing price is the most appropriate price at the end of the day. Show them that there is no correlation between](https://image.slidesharecdn.com/irjet-v9i3388-220920102409-0fe4cdcd/75/Stock-Price-Prediction-using-Machine-Learning-Algorithms-ARIMA-LSTM-Linear-Regression-1-2048.jpg)
![International Research Journal of Engineering and Technology (IRJET) e-ISSN: 2395-0056 Volume: 09 Issue: 03 | Mar 2022 www.irjet.net p-ISSN: 2395-0072 © 2022, IRJET | Impact Factor value: 7.529 | ISO 9001:2008 Certified Journal | Page 2153 autocorrelation function (ACFs) and component autocorrelation function (PACFs) using Q statistics and integration sites. In addition, in static data, it is stabilized with the help of various techniques. It was concluded near the end of the study that the ARIMA model was very useful for short-term prediction [4]. 3. METHODOLOGY Fig-1: System Design A. Auto Regressive Integrated Moving Average (ARIMA) ARIMA Complete Form Auto Regressive Integrated Moving Average. There are two types of ARIMA models that can be used in prediction: ARIMA seasonal and non-seasonal ARIMA. In our case, the off-season ARIMA model was used due to the nature of the stock data. ARIMA is actually an example of models based on its past values, so that this relationship can be used to predict future values. The ARIMA model takes three main parameters, described as follows: p = Number of times left. For example, if p = 4, we use the last four times of our data in the default calculation. p enables us to adjust the appropriate timeline line. d = At ARIMA, we equate and convert the related time series into a standard time series by dividing. We use d to determine the number of different numbers. q = q is used to indicate a feature error. Part of the error is part of the unforgivable historical data for the general price range Autoregressive component: The independent AR model relies on a combination of historical values. This dependence is so great that it is seen in the reversal of the old line that the number of parts of the Auto Regressive has a direct dependence on the calculation of previous times. We use the Auto Regressive component if: 1) ACF graphs show the slope descending toward zero 2) The advantages of lag-1 are expressed in the ACF framework of the timeline 3) The PACF numerical graph suddenly drops to zero Moving Rates: Moving ratings are random jumps to data that lead to more than two possible or non-sequential events. These hops are used to clarify the calculated error and to explain what part of the MA is left behind. The MA model completely can justify and clarify this defect similar to the descriptive slider method. We use the Moving Averages component if: a) Significant decrease in ACF is observed after just a few delays b) The model shows a negative Lag c) The slope usually decreases downwards in the PACF Combined component: Combined component is only started when real-time or historical series data is static or seasonal. The number of times that a series of time needs to be divided and calculated to make it a static type of the common component term. Fig-2: ARIMA model [5]](https://image.slidesharecdn.com/irjet-v9i3388-220920102409-0fe4cdcd/75/Stock-Price-Prediction-using-Machine-Learning-Algorithms-ARIMA-LSTM-Linear-Regression-2-2048.jpg)
![International Research Journal of Engineering and Technology (IRJET) e-ISSN: 2395-0056 Volume: 09 Issue: 03 | Mar 2022 www.irjet.net p-ISSN: 2395-0072 © 2022, IRJET | Impact Factor value: 7.529 | ISO 9001:2008 Certified Journal | Page 2154 B. Long Short Term Memory (LSTM) The Long Short-Term Memory network is a RNN that is trained using Backpropagation. It takes care of the disappearing gradient problem encountered earlier. LSTM networks have their own memory and so they prove to be efficient in creating large RNNs and handle time specific scheduling problems. The memory blocks in LSTM network are connected through recurrent layers rather than having neurons. A block has many basic and a few complex components that make it smarter as compared to the standard neuron. It consists of many gates that coordinate relative input functions with output functions. Whenever a block receives an input, a gate is triggered which takes decision about whether or no to pass the block forward for further processing. The standard LSTM block, in its simplest form, consists of an input gate, an output gate, a cell and a forget gate. 1) Cell: It is used to remember the values over arbitrary time intervals. 2) Input Gate: It decides which information to keep in the cell. 3) Output Gate: It is used to decide which part of cell state should be given as an output. 4) Forget Gate: It is used to decide which information to throw away from the cell. Fig-3: LSTM model [6] C. Line Decline In the Line Redistribution model, the calculation line calculation is used to combine a set of input data values (x) into a predicted output data set of input values (y). Both the input and output variables and values are considered integers. The unique number given by the Line Rotation equation is represented using the Greek capital letter Beta (B) and is commonly known as a coefficient. In addition to this, another coefficient is added to give the line additional degrees of freedom. This additional term is often referred to as the bias coefficient. Typically, the bias coefficient is calculated or otherwise measured by finding the distance of our mathematical points from the most relevant line. This can be displayed as a straight line at right angles to the vertex and calculated using the line bias. Statistically, a line tangent is used to measure its proximity to the relative linear Regression. A problem model model in Linear Regression will be provided as follows: y = B0 + Bt * xt + Et This same line is also called a plane or plane when we are dealing with more than one input. This is often the case with high-volume data. The Linear Regression model is therefore represented by the mathematical and introverted values measured by the specific coefficients. However, before using this line number, we are faced with a number of issues. These issues often increase the complexity of the model which makes accurate estimates difficult. This complexity is often discussed in terms of the number of dependent and independent factors. The effect of input variables on the model is effectively disrupted when a certain coefficient becomes zero. Therefore, due to the empty values, the accuracy is reduced in the estimates made from the model (0 * x = 0). When we analyze adaptive techniques that can change the learning algorithm to reduce the complexity of models by emphasizing the importance of the perfect coefficient, which drives some to zero, this exact position is important. Fig-4: Linear Regression [7] Twitter Sentiment Analysis- Social media data has high impact today than ever, it can aid in predicting the trend of the stock market. The method involves collecting news and social media data](https://image.slidesharecdn.com/irjet-v9i3388-220920102409-0fe4cdcd/75/Stock-Price-Prediction-using-Machine-Learning-Algorithms-ARIMA-LSTM-Linear-Regression-3-2048.jpg)
![International Research Journal of Engineering and Technology (IRJET) e-ISSN: 2395-0056 Volume: 09 Issue: 03 | Mar 2022 www.irjet.net p-ISSN: 2395-0072 © 2022, IRJET | Impact Factor value: 7.529 | ISO 9001:2008 Certified Journal | Page 2158 C. CLASSIFICATION MODELS COMPARISON The three models in consideration, namely Arima, Lstm, Linear regression, were then compared based on multiple areas of attention like the number of parameters and a comparison of trainable and non-trainable parameters, in Table-3, the rmse value and loss graphs of each of the models were investigated along with the ease of learning taken into account, and finally, the classification results were examined individually for all evaluation parameters, in table-1. Table-1: Classification Results of All Models Algorithms RMSE Value Predicted value Present value ARIMA 3.06 175.57 177.77 LSTM 6.66 166.61 177.77 LINEAR REGRESSION 9.11 173.71 177.77 8. CONCLUSION The proposed algorithms work best with NASDAQ stock market data and NSE stocks. From the headings and tables presented above, it appears that although the model's predictions are slightly deviant from real prices, they offer a good measure of future trends in stock prices. This balance helps to obtain important information about stocks, thus facilitating wise investment decisions. It is noted that the ARIMA and LSTM models are more compatible with the Linear Regression model for the NASDAQ (US Company) forecast. Although, in the NSE (Indian Company) stocks, LSTM and Linear Regression appear to be more efficient than ARIMA. This also supports the argument that different models and algorithms react differently to stock of different indicators. Therefore, one should choose models and algorithms depending on the scale and indicators of their stock. 9. REFERENCES [1] P. D. Yoo, M. H. Kim and T. Jan, "Machine Learning Techniques and Use of Event Information for Stock Market Prediction: A Survey and Evaluation," International Conference on Computational Intelligence for Modeling, Control and Automation and International Conference on Intelligent Agents, Web Technologies and Internet Commerce (CIMCA-IAWTC 06), Vienna, 2005, pp. 835-841. [2] M. İ. Y. Kaya and M. E. Karsligil, "Stock price prediction using financial news articles," 2010 2nd IEEE International Conference on Information and Financial Engineering, Chongqing, 2010, pp. 478-482. [3] Hedayati, Amin & Moghaddam, Moein & Esfandyari, Morteza. (2016). Stock market index prediction using artificial neural network:. Journal of Economics, Finance and Administrative Science. 10.1016/j.jefas.2016.07.002. [4] Ayodele A. Adebiyi., Aderemi O. Adewumi, “Stock Price Prediction Using the ARIMA Model”, IJSST, Volume-15, Issue-4. [Online]. Available :https://ijssst.info/Vol- 15/No-4/data/4923a105.pdf [5] Chen, Peiyuan. (2020). STOCHASTIC MODELING AND ANALYSIS OF POWER SYSTEM WITH RENEWABLE GENERATION, ResearchGate Publication [6] Angle Qian (2018), Structure of LSTM RNNs, Stack Exchange [Online]. Available: https://ai.stackexchange.com/questions/6961/struct ure-of-lstm-rnns [7] Rob J Hyndman and George Athanasopoulos, Forecasting: Principles and Practice, OTexts, Kindle Edition. [Online]. Available: https://otexts.com/fpp2/](https://image.slidesharecdn.com/irjet-v9i3388-220920102409-0fe4cdcd/75/Stock-Price-Prediction-using-Machine-Learning-Algorithms-ARIMA-LSTM-Linear-Regression-7-2048.jpg)

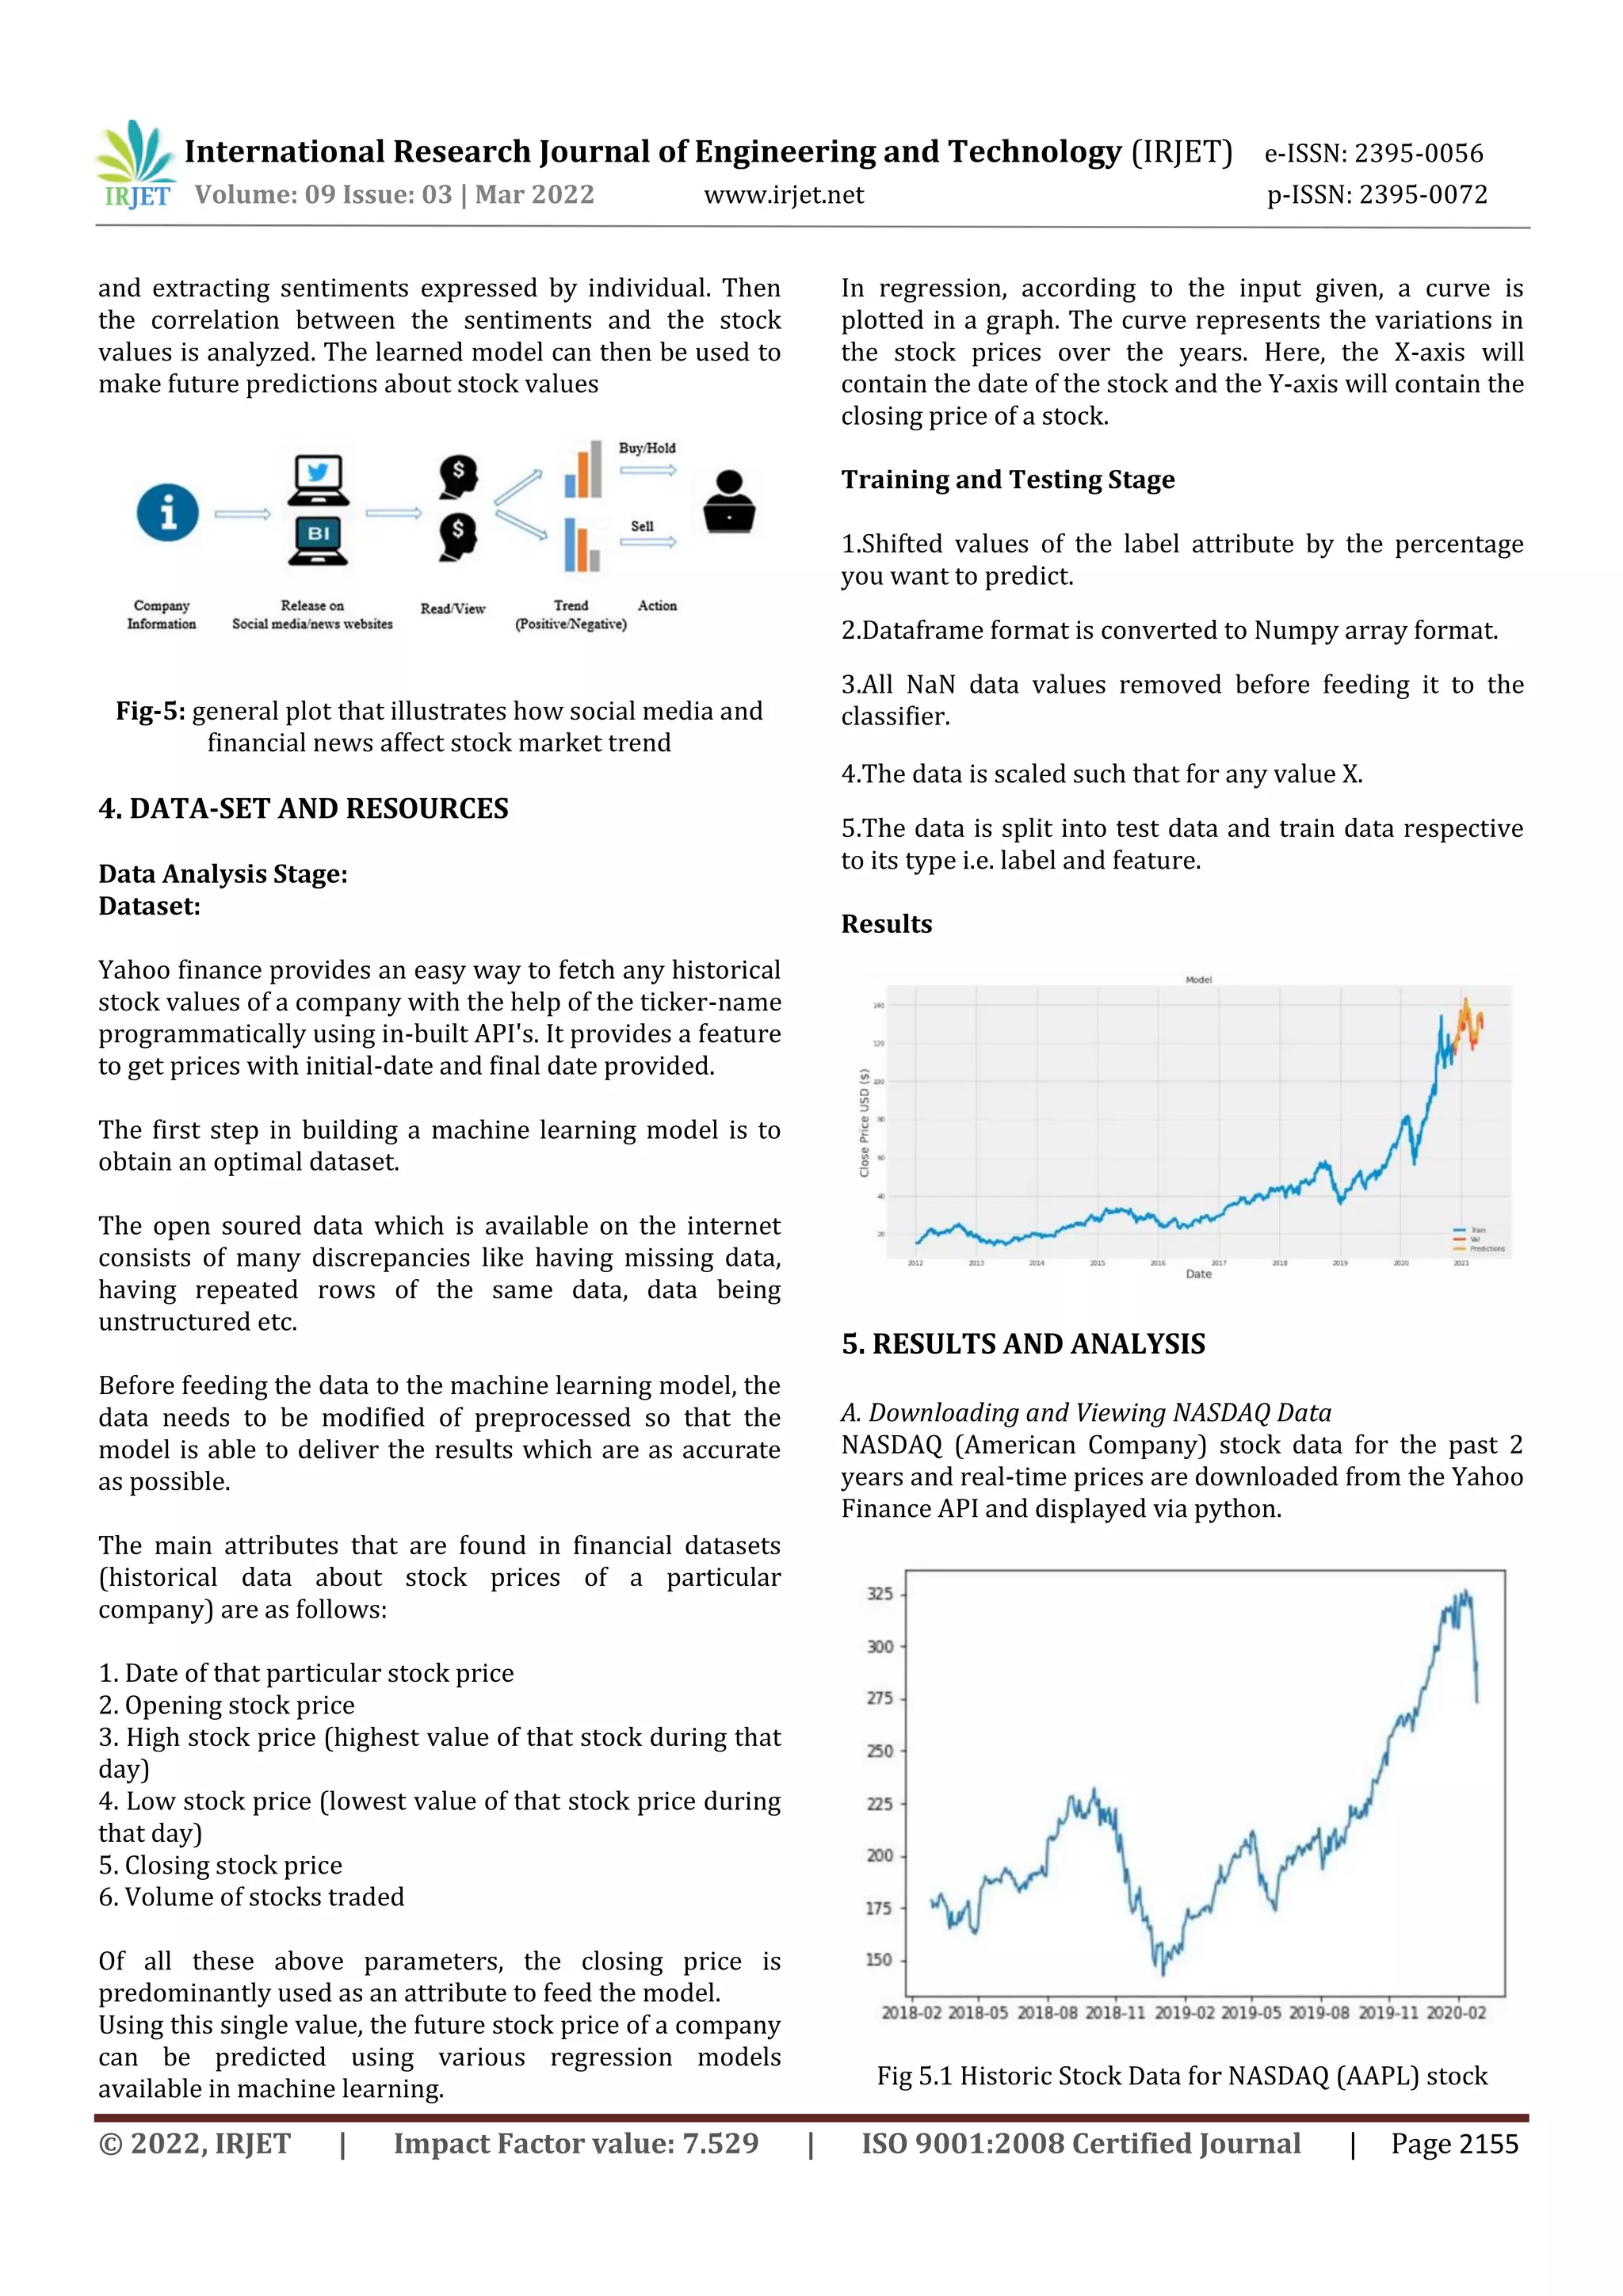
This document compares the accuracy of ARIMA, LSTM, and linear regression models for stock price prediction. It downloads historic stock price data for NASDAQ and NSE stocks and uses 80% for training and 20% for testing the models. For the NASDAQ stock, ARIMA and LSTM models have more accurate predictions than linear regression, with lower RMSE values. However, for the NSE stock, LSTM and linear regression predictions are more accurate than ARIMA. The results are displayed using Python plots and code, with RMSE values provided to compare prediction accuracy between the different models.