The document presents 'Survey Surfer', a web-based application for creating and analyzing surveys with an emphasis on automated data assessment and graphical visualization. It employs a three-tier architecture for improved data security and utilizes MS chart controls for dynamic data visualization, enabling users to make informed decisions based on survey responses. The application simplifies the survey process by allowing users to create, distribute, and analyze surveys in real-time, providing insights into user engagement and behavior.
![Advanced Computational Intelligence: An International Journal (ACII), Vol.3, No.3, July 2016 DOI:10.5121/acii.2016.3302 9 SURVEY SURFER: A WEB BASED DATA GATHERING AND ANALYSIS APPLICATION Mrs. Dhanamma Jagli1 , Ms. Krutika Tawde2 , Mrs. Pratima Musale3 , Ms. Swathi Muthukumar4 1 Department of MCA,V.E.S.Institute of Technology, Mumbai, India 2,3,4 MCA Final year Students,V.E.S. Institute of Technology, Mumbai, India ABSTRACT The most important need for a web based survey technology is speedy performance and accurate results .Though there are variety of ways a survey can be taken manually and have it assessed manually but here we are introducing the survey site concept where the assessment of the survey responses are created automatically by applying certain statistics. In this paper we propose the idea of automated approach to the analysis of the survey where the results would be evident graphically to take a wise decision. Additional to graphical view we aim on forming a platform to view complex, tedious data in simple, understandable, interactive and visualized form. KEYWORDS Data Analysis, Data Mining, Real Time Analysis, Three Tier Architecture, Web Based Survey. 1. INTRODUCTION This paper presents Survey Surfer, a Web-based survey development and implementation technology, designed for creating on-line surveys for generic purposes. Surveys are considered as general data collection field of application which provide the survey creator on-line access to real time information on survey responses. The system is a three-tiered database-backed application that has been developed to support the user to gain insights for easy decision making. Surveys are mostly taken manually. Mostly the techniques used to analyse these gained information have to undergo much manual processing and there is a need of expert advice to take decisions. Analysis of the data obtained from gaining the responses from the visitor to the sites are visually displayed with the help of Ms charting controls .This tool is helpful in giving the output into different graph types and thereby helping to compare the results in many different views and perspective, providing insights to the user to reach to a certain decision. This technology provides data mining process for exploring data in search of consistent pattern by using real time analysis over the received data. 2. RELATED WORK The main purpose of Survey Surfer application is to interact with user as well as present data in well-defined style and matter. Robert A. Dennis and Sanjiv S. Gambhir [2] have proposed an approach to move survey-building software application toward the WWW by exporting content to HTML format [6][7].Addition to usage of HTML and ASP.NET server technology, dynamic branching is possible using custom set of interfaces where response to the next page is already set to default values. When the respondents answer is not accurate with the default response answers then the next page is invoked only when none of the defined response are encountered.](https://image.slidesharecdn.com/3316acii02-160805100554/75/SURVEY-SURFER-A-WEB-BASED-DATA-GATHERING-AND-ANALYSIS-APPLICATION-1-2048.jpg)
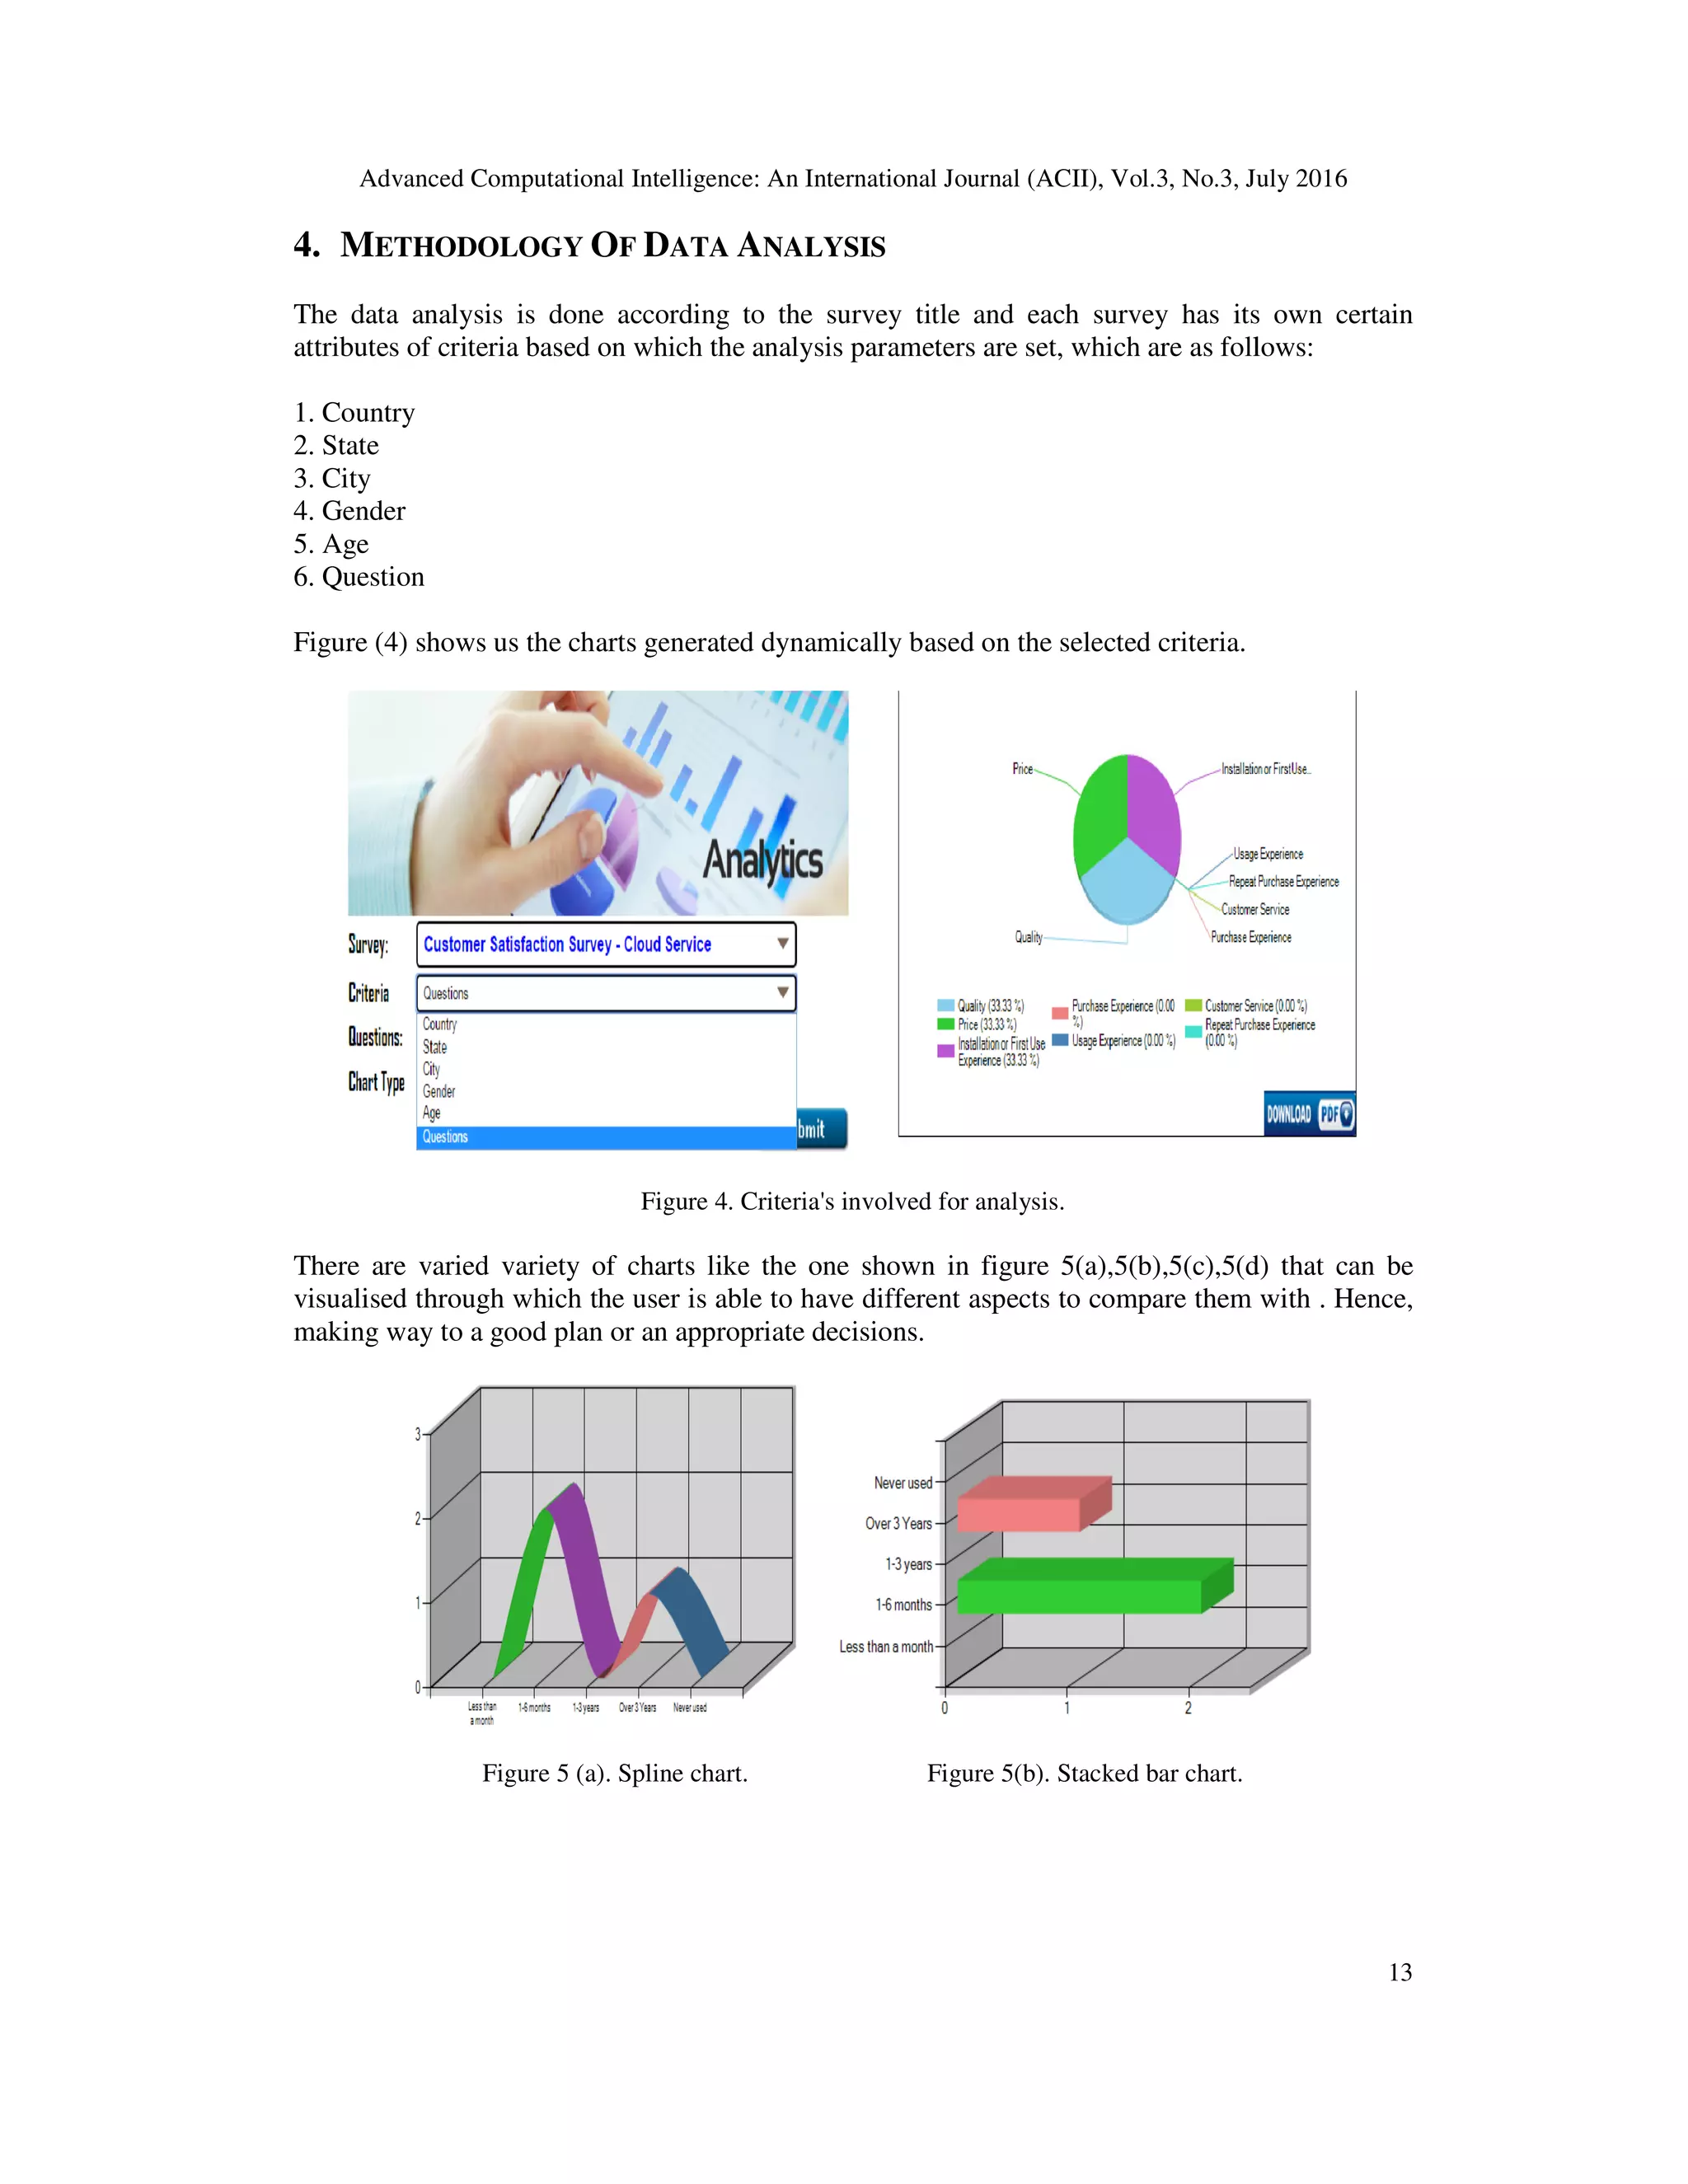
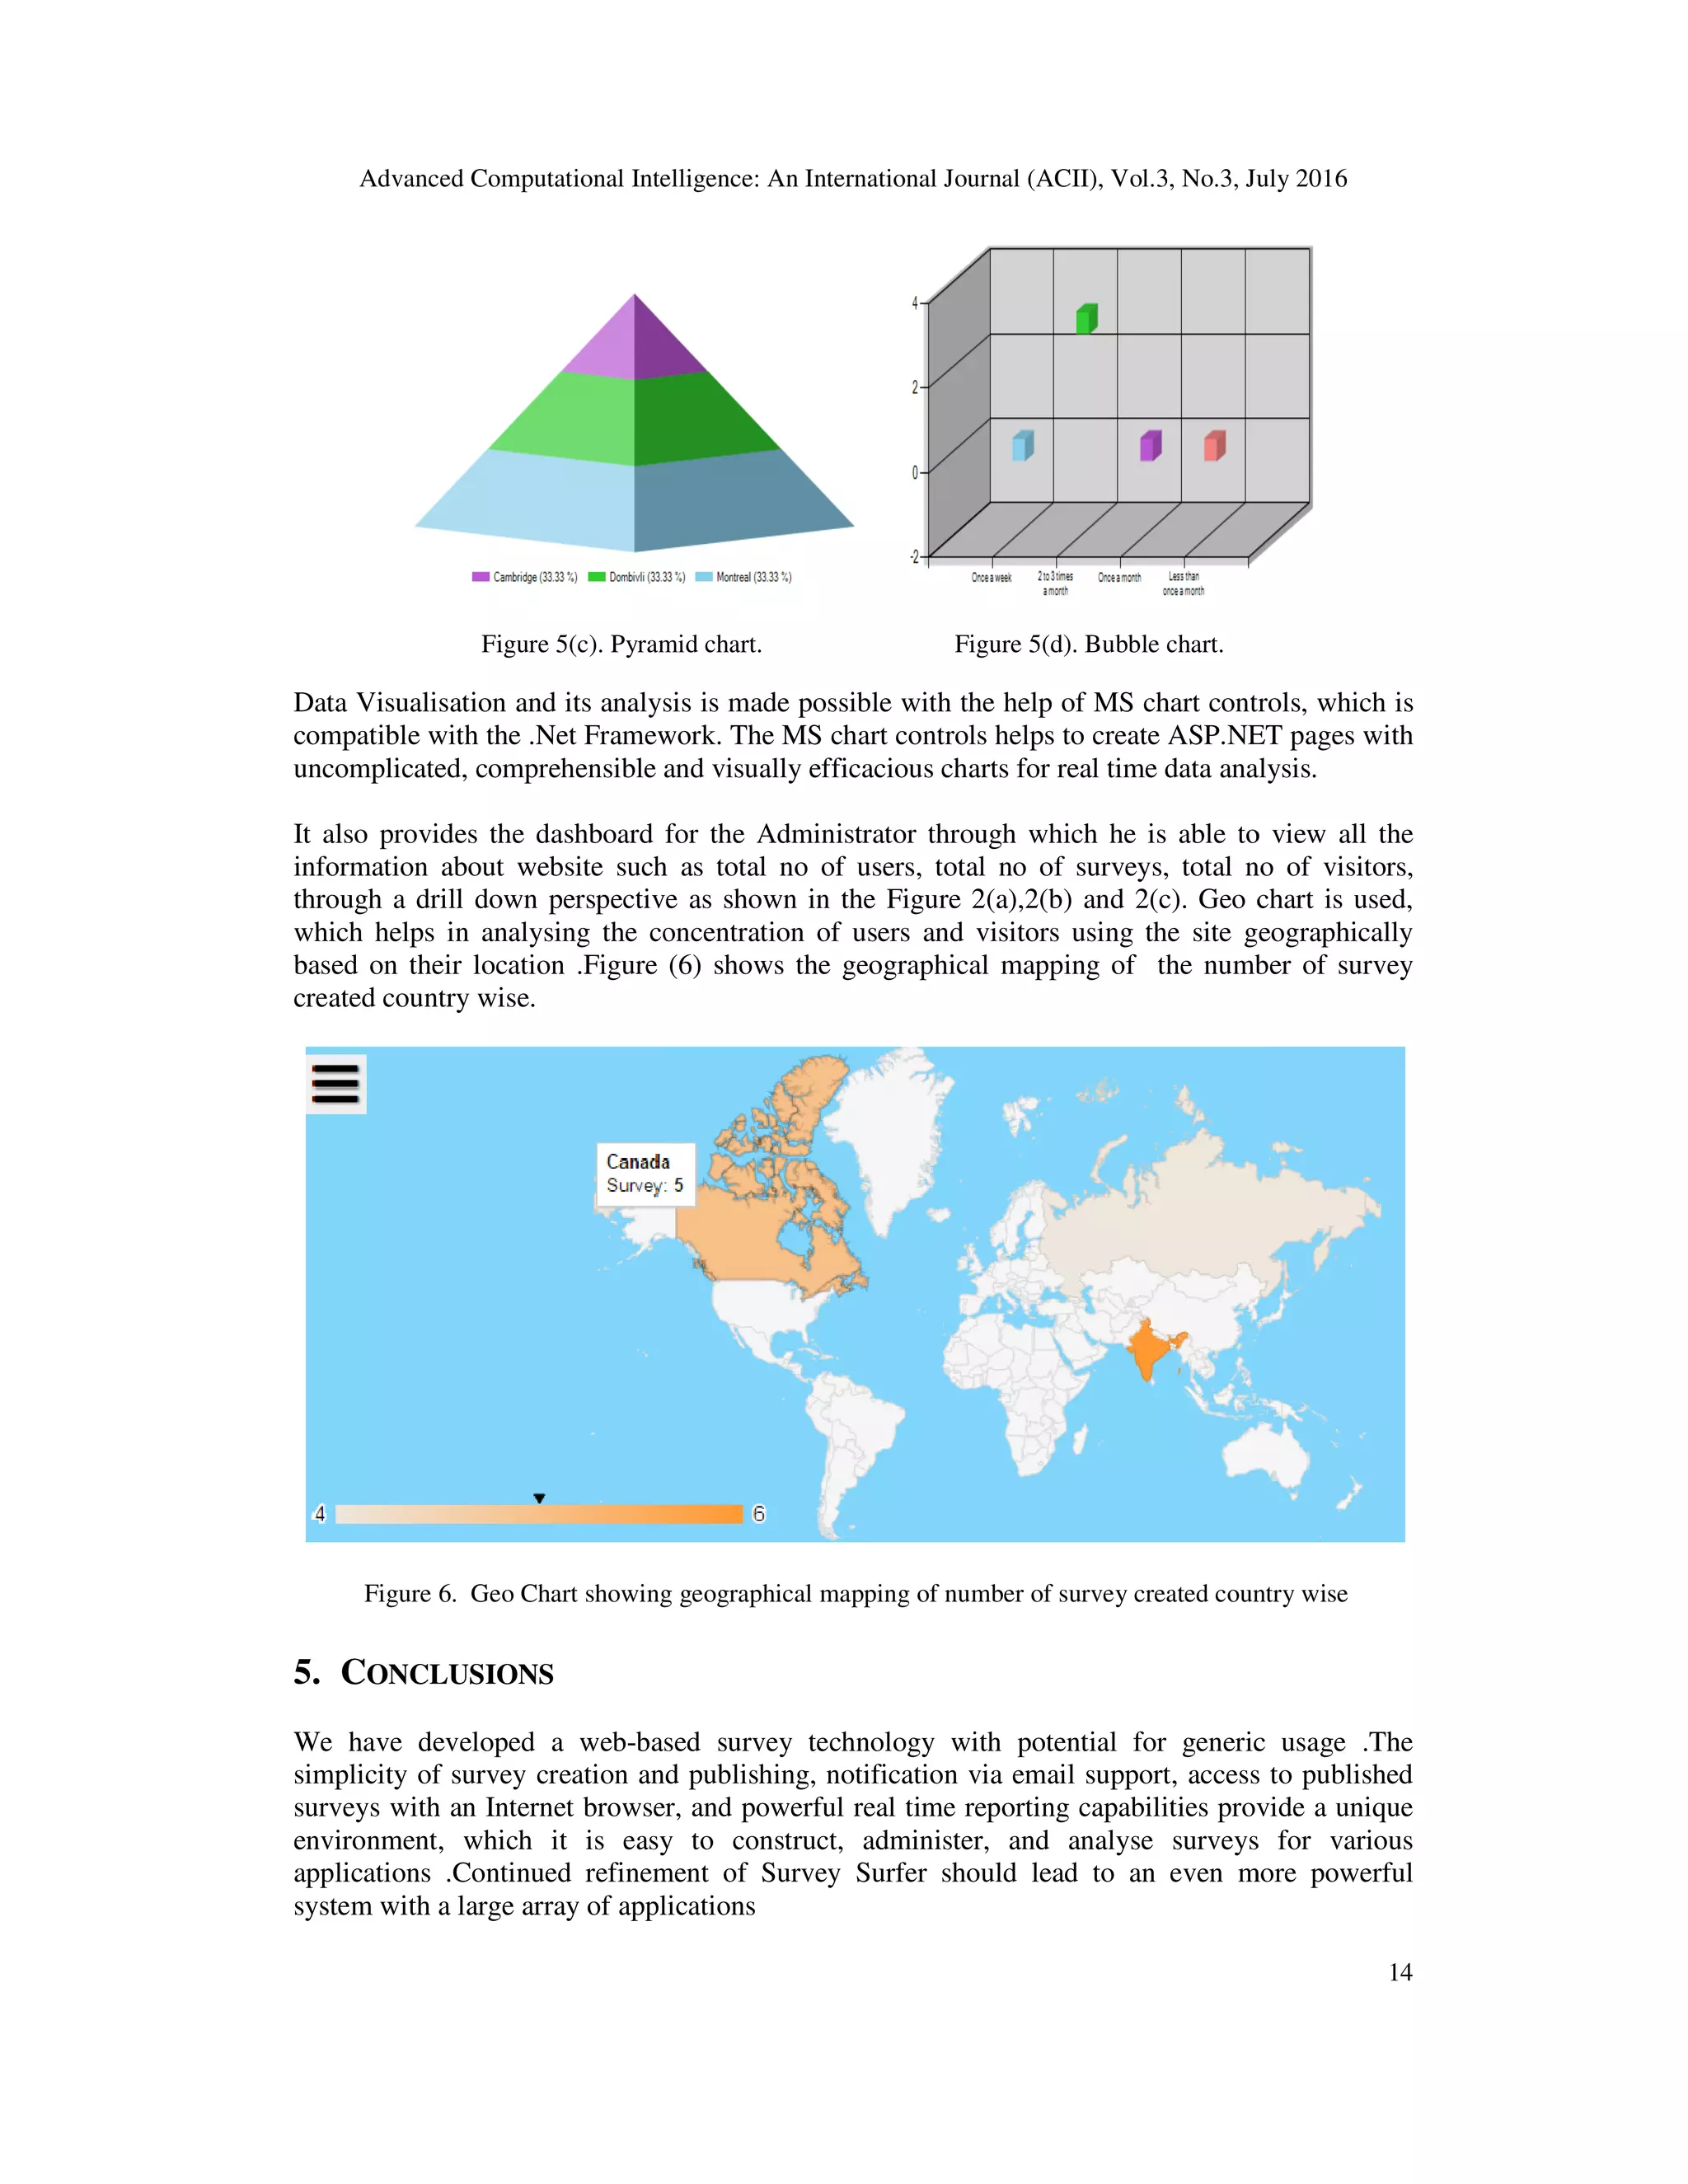
![Advanced Computational Intelligence: An International Journal (ACII), Vol. Robert A. Dennis and Sanjiv S. Gambhir [2] under a particular section and creator of survey can edit the changes to those sections even after survey creation. The order of questions within a are sorted by the use of a unique graphical sorting tool. Excel sheet is provided for creating the questionnaires with appropriate validation. Data Visualisation and its analysis is made possible with the help of MS chart controls, which is compatible with the .Net Framework the drill down approach for visualization of data in Admin Dashboard Sebastian Lauer and Mihai Lazarescu comparison and change detection of the sport and minimum norms and parameters of players are time statistics. This comparison results in the change detection and helps in gaining insights and estimation about the player’s future performance. 3. PROPOSED SYSTEM 3.1. THREE TIER ARCHITECTURE The basic concept of a tiered architecture involves breaking up an application into logic or tiers, each of which is assigned general or specific roles. We have implemented the 3 architecture to gain high data structure security, where each and every query is written as a stored procedure. The stored procedure is pre compiled ob execution time and reduces the risk of or query entries exist in the aspx or aspx.vb page. The architecture of the whole system is as in aspx and the code behind it i.e. common query procedures used to access the database. Data a between the application layer [.asp MySQL database. 3.2. DATA MINING Data mining is the process of examining allows users to analyse data obtained from the survey taken by the visitors, Advanced Computational Intelligence: An International Journal (ACII), Vol.3, No.3, July 2016 Robert A. Dennis and Sanjiv S. Gambhir [2] developed iQ&A system where questions are added creator of survey can edit the changes to those sections even after The order of questions within a particular sections and the sections of the survey are sorted by the use of a unique graphical sorting tool. Whereas in the Survey Surfer sheet is provided for creating the questionnaires with appropriate validation. Data Visualisation and its analysis is made possible with the help of MS chart controls, which is compatible with the .Net Framework as shown in fig 5[1]. The Survey Surfer application the drill down approach for visualization of data in Admin Dashboard as shown in fig 2[7]. Lazarescu [1] proposed a visual data analysis tool developed for comparison and change detection of the sport player’s performance. Where previous conditions and minimum norms and parameters of players are considered, which are compared with the real on results in the change detection and helps in gaining insights and future performance. RCHITECTURE The basic concept of a tiered architecture involves breaking up an application into logic or tiers, each of which is assigned general or specific roles. We have implemented the 3 architecture to gain high data structure security, where each and every query is written as a stored ocedure is pre compiled object which helps in reducing the query n time and reduces the risk of security being breached by SQL injection as no table name or query entries exist in the aspx or aspx.vb page. The architecture of the whole system is as in Fig (1) where the first application layer contains the i.e. aspx.vb pages while the DAL(Data Access Layer) have the common query procedures used to access the database. Data access layer acts as a gateway asp page (presentation) & .aspx.vb page (business logic) Figure 1. 3-Tier Architecture. of examining the data obtained and gain new insights from those. It obtained from the survey taken by the visitors, visualize them in , No.3, July 2016 10 where questions are added creator of survey can edit the changes to those sections even after and the sections of the survey rvey Surfer application, sheet is provided for creating the questionnaires with appropriate validation. Data Visualisation and its analysis is made possible with the help of MS chart controls, which is Survey Surfer application provides as shown in fig 2[7]. visual data analysis tool developed for previous conditions are compared with the real on results in the change detection and helps in gaining insights and The basic concept of a tiered architecture involves breaking up an application into logical chunks, or tiers, each of which is assigned general or specific roles. We have implemented the 3-tier architecture to gain high data structure security, where each and every query is written as a stored which helps in reducing the query security being breached by SQL injection as no table name 1) where the first application layer contains the aspx.vb pages while the DAL(Data Access Layer) have the ccess layer acts as a gateway business logic)] and the gain new insights from those. It visualize them in](https://image.slidesharecdn.com/3316acii02-160805100554/75/SURVEY-SURFER-A-WEB-BASED-DATA-GATHERING-AND-ANALYSIS-APPLICATION-2-2048.jpg)
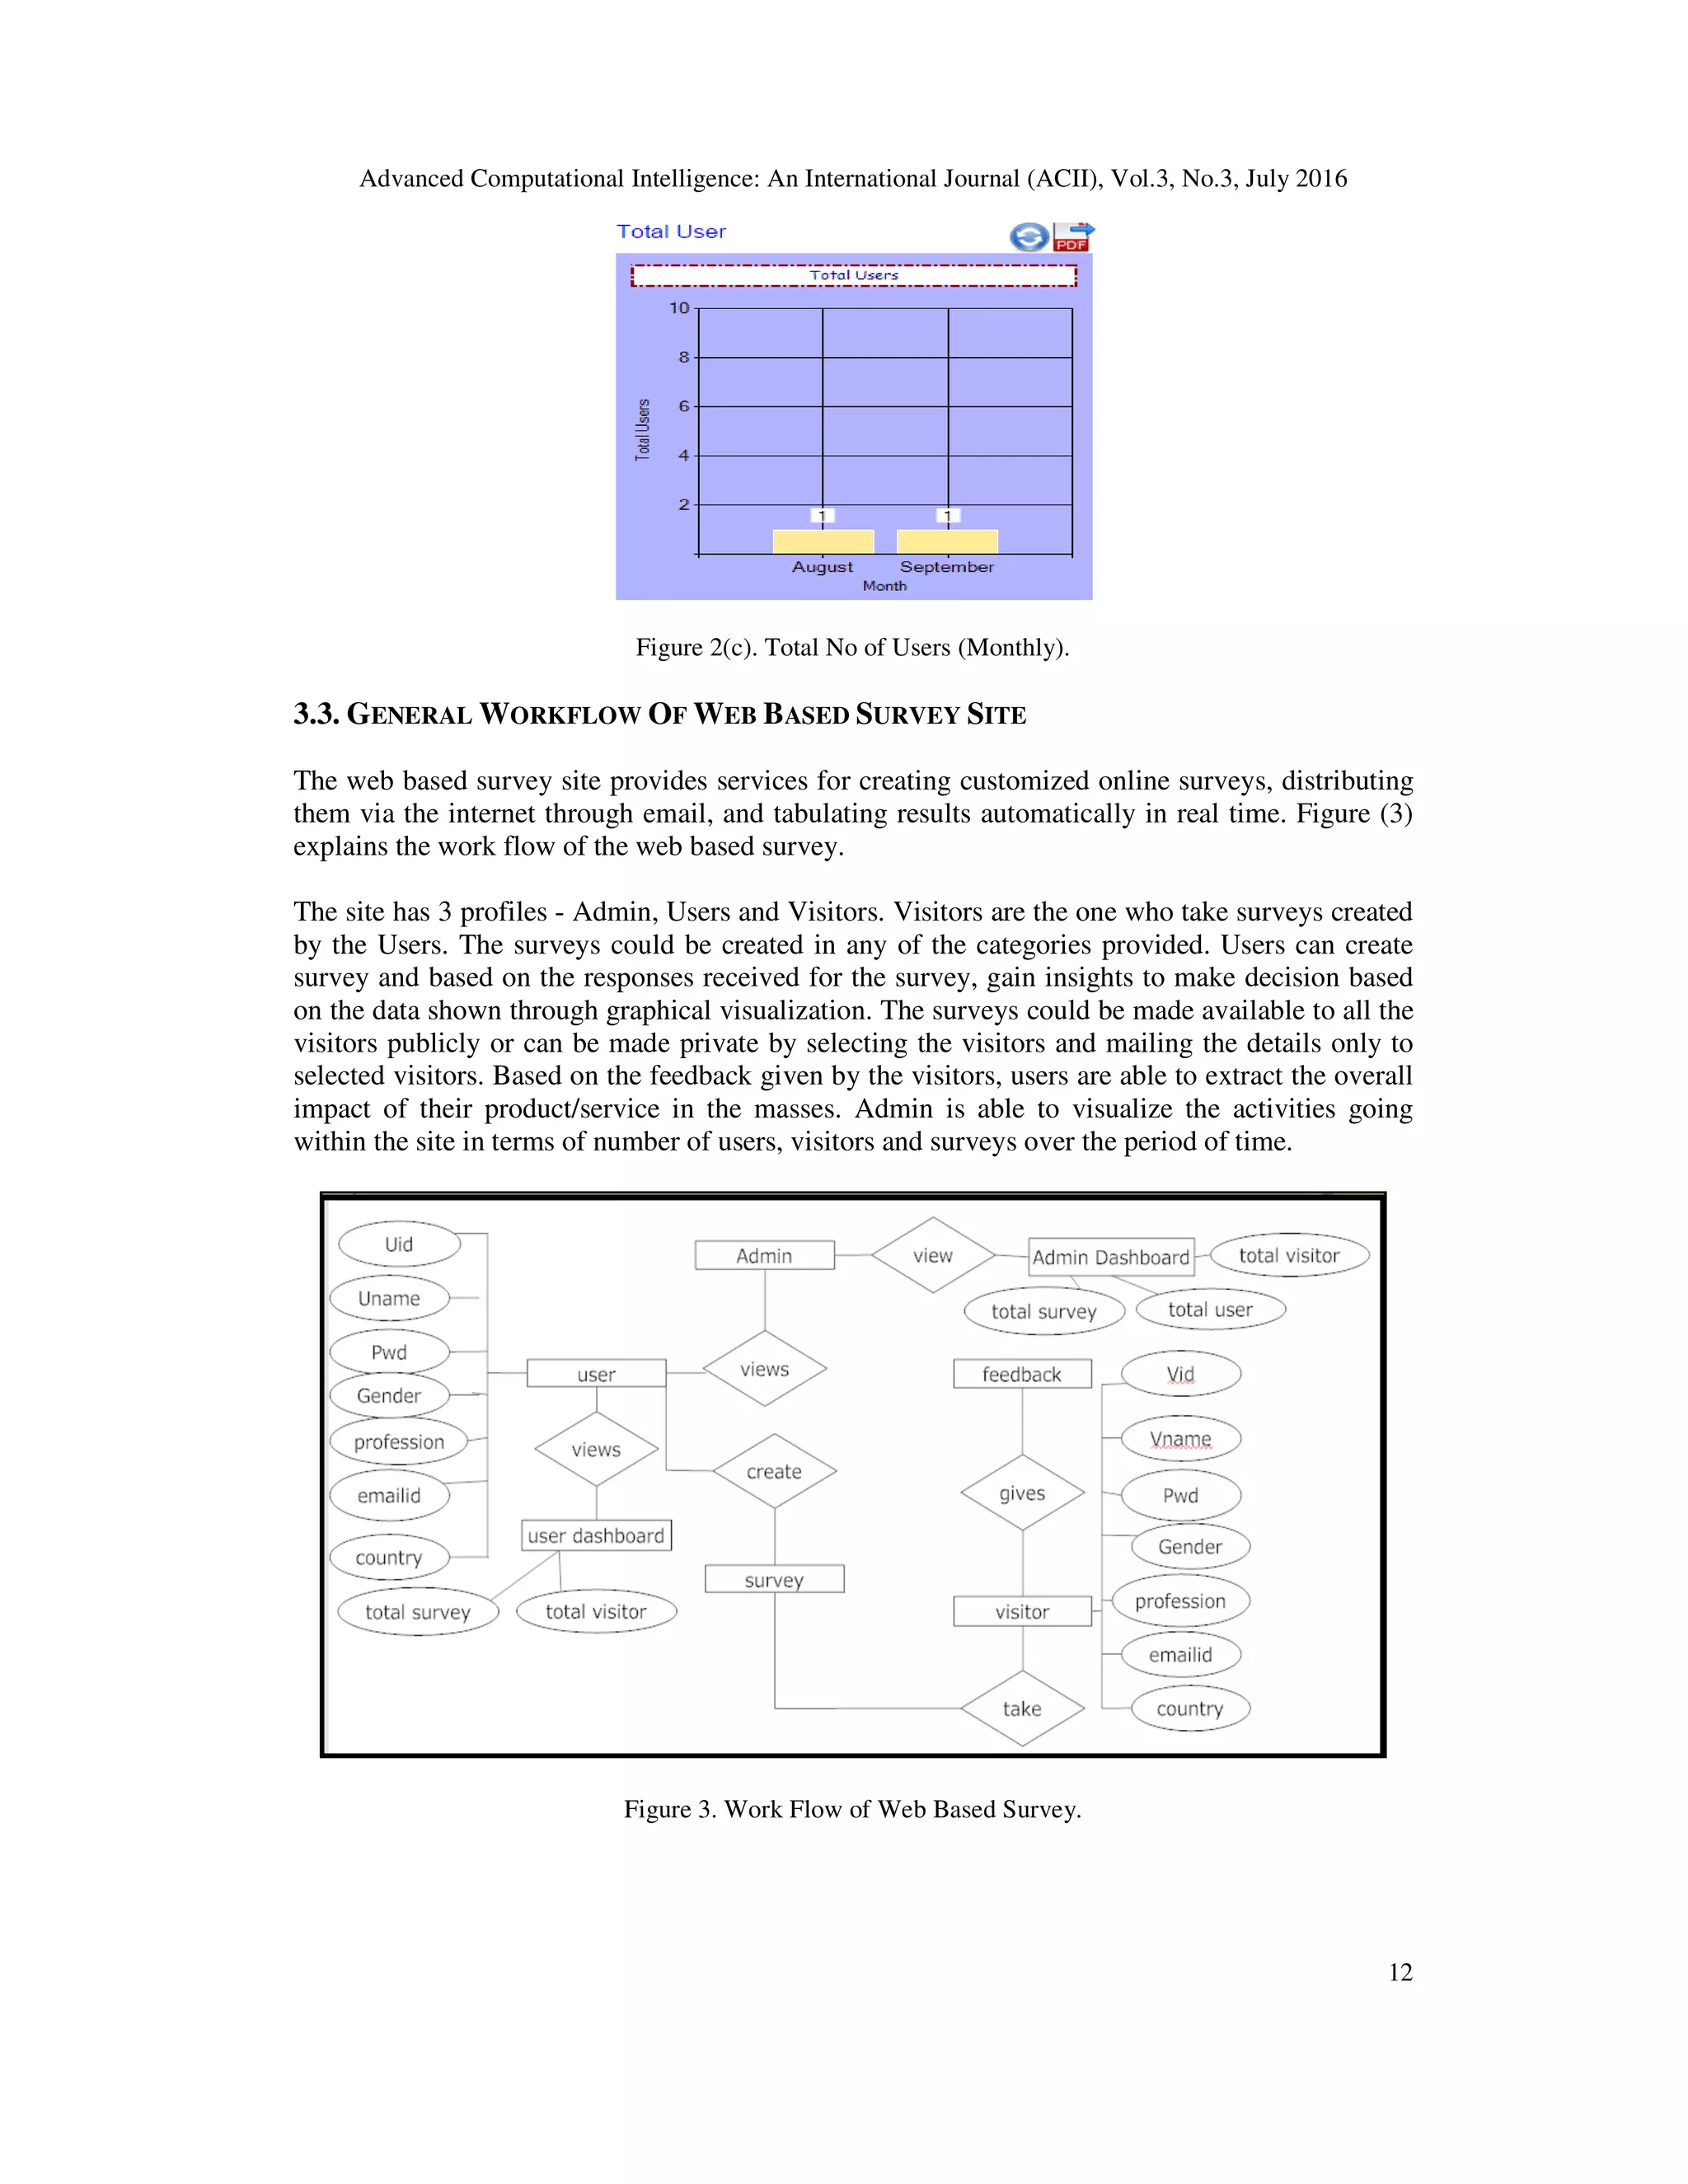
![Advanced Computational Intelligence: An International Journal (ACII), Vol. different perspectives by changing the dimensions of charts Technically, data mining is the process of finding correlations or patterns among dozens o in large relational databases. In information technology, to move from summary information to detailed data by focusing in on something, drill-down is used. Drill operations carried out in the survey site analytics, and the term is commonly heard in game data mining contexts[10]. This is because drill depth analysis of data, making it very useful for the behaviour analysis of users and visito where the root causes of behavioural patterns are often nestled deep within the data. The dashboard shows administrator the view for all information about website such as total no of users, total no of surveys, total no of visitor Figure 2(a), 2(b) and 2(c)[7].Where the F Survey Surfer site on yearly basis ,when the required part on quarterly basis as displayed the monthly basis level as shown in Fig materialized by consolidating the metrics at a lower level. Figure 2(a). Total No of Figure 2( Advanced Computational Intelligence: An International Journal (ACII), Vol.3, No.3, July 2016 by changing the dimensions of charts and summarize the results Technically, data mining is the process of finding correlations or patterns among dozens o , to move from summary information to detailed data by focusing in down is used. Drill-down analysis is one of the most common forms of survey site analytics, and the term is commonly heard in game data . This is because drill-down analysis is a very comprehensible method for in depth analysis of data, making it very useful for the behaviour analysis of users and visito where the root causes of behavioural patterns are often nestled deep within the data. The dashboard shows administrator the view for all information about website such as total no of users, total no of surveys, total no of visitors, through a drill down perspective as shown in the .Where the Figure 2(a) represents the total number of users joined the rfer site on yearly basis ,when clicking on the particular bar of the year it drills down to uarterly basis as displayed in Figure 2(b) which can be further the monthly basis level as shown in Figure2(c). By this a higher level of abstraction is materialized by consolidating the metrics at a lower level. Figure 2(a). Total No of Users (yearly). Figure 2(b). Total No of Users (Quarterly). , No.3, July 2016 11 ize the results. Technically, data mining is the process of finding correlations or patterns among dozens of fields , to move from summary information to detailed data by focusing in down analysis is one of the most common forms of survey site analytics, and the term is commonly heard in game data method for in- depth analysis of data, making it very useful for the behaviour analysis of users and visitors , The dashboard shows administrator the view for all information about website such as total no of own perspective as shown in the igure 2(a) represents the total number of users joined the clicking on the particular bar of the year it drills down to 2(b) which can be further reduced to 2(c). By this a higher level of abstraction is](https://image.slidesharecdn.com/3316acii02-160805100554/75/SURVEY-SURFER-A-WEB-BASED-DATA-GATHERING-AND-ANALYSIS-APPLICATION-3-2048.jpg)
![Advanced Computational Intelligence: An International Journal (ACII), Vol.3, No.3, July 2016 15 REFERENCES [1] Sebastian Lahr and Mihai Lazarescu ,"A Visual Data Analysis Tool for Sport Player Performance Benchmarking,Comparison and Change Detection", 19th IEEE International Conference on Tools with Artificial Intelligence [2] Robert A. Dennis and Sanjiv S. GambhirJ. Breckling, Ed.,Internet Question & answer(iQ&A):A web based survey technology. Berlin, Germany: Springer, 1989, vol. 61. [3] Robert A. Dennis and Sanjiv S. GambhirJ. Breckling, Ed., The Analysis of Directional Time Series: Applications to Wind Speed and Direction, ser. Lecture Notes in Statistics. Berlin, Germany: Springer, 1989, vol. 61. [4] www.wikipedia.org [6] Extracting and Visualizing Insights from Real-Time Conversations Around Public Presentations Nicolas Garcia Belmonte Visual Analytics Science and Technology (VAST), 2014 IEEE Conference on 25-31 Oct. 2014 [7] Anil Singh, Aakash Taneja, and George Mangalraj, "Creating Online Surveys: Some Wisdom from the Trenches Tutorial", IEEE transactions on professional communication, vol. 52, No. 2, June 2009. [8] Ronald J. Glotzbach, Laura A. Kocur," Work in Progress - Evaluation and Feedback for Web Programming Curriculum ", October 12 - 15, 2011, Rapid City, SD 41st ASEE/IEEE Frontiers in Education Conference Session F4E. [9] http://techbrij.com/drill-down-asp-net-chart-control, Drill down for ASP.NET 4.0 Chart Control [10] http://blog.gameanalytics.com/blog/using-drill-down-analysis-to-find-out-why.html, Using drill-down analysis to find-out why. Authors Mrs.Dhanamma Jagli Short Biography: Mrs.Dhanamma Jagli is an Assistance professor in V.E.S Institute of Technology, Mumbai, currently Pursuing Ph.D in Computer Science and Engineering and received M.Tech in Information Technology from Jawaharlal Nehru Technological University, Hyderabad and Andhra Pradesh. She has around 12 years teaching experience at the post Graduate and undergraduate level. She had published and presented papers in refereed international journals and conferences. Her areas of research interest are Data Mining, Cloud Computing, Software Engineering, Database Systems and Embedded Real time systems. She has been associated with Indian Society of Technical Education (ISTE) as a life member. Ms. Krutika Tawde Short Biography:Krutika Tawde is currently a final year MCA student in Vivekanand Education Society’s Institute of Technology (V.E.S.I.T), Mumbai. She has experience in software development and maintenance using .NET and SQL technologies of about a year and a half. A technology enthusiast and avid reader, she is interested in open source systems, data mining and analysis as well as application development. Ms. Pratima Musale Short Biography:Pratima Musale has completed her BCA from C.O.C.S.I.T. Latur, from S.R.T. University, Nanded. She is currently pursuing her MCA from Vivekanand Education Society's Institute of Technology, Mumbai. She has an abiding interest in Software Engineering and programming languages like C, C++. Ms. Swathi Muthukumar Short Biography:Swathi Muthukumar is a final year student of Master of Computer Application (M.C.A) from Vivekanand Education Society’s Institute of Technology (V.E.S.I.T), Mumbai University. Swathi has completed her B.Sc. In Computer science from Ramniranjan Jhunjhunwalla College, Mumbai University. She has been selected as an intern at Nomura. She is an ardent programmer with an abiding interest in data analytics and programming languages like C, C++ and .Net technologies.](https://image.slidesharecdn.com/3316acii02-160805100554/75/SURVEY-SURFER-A-WEB-BASED-DATA-GATHERING-AND-ANALYSIS-APPLICATION-7-2048.jpg)