1
$\begingroup$

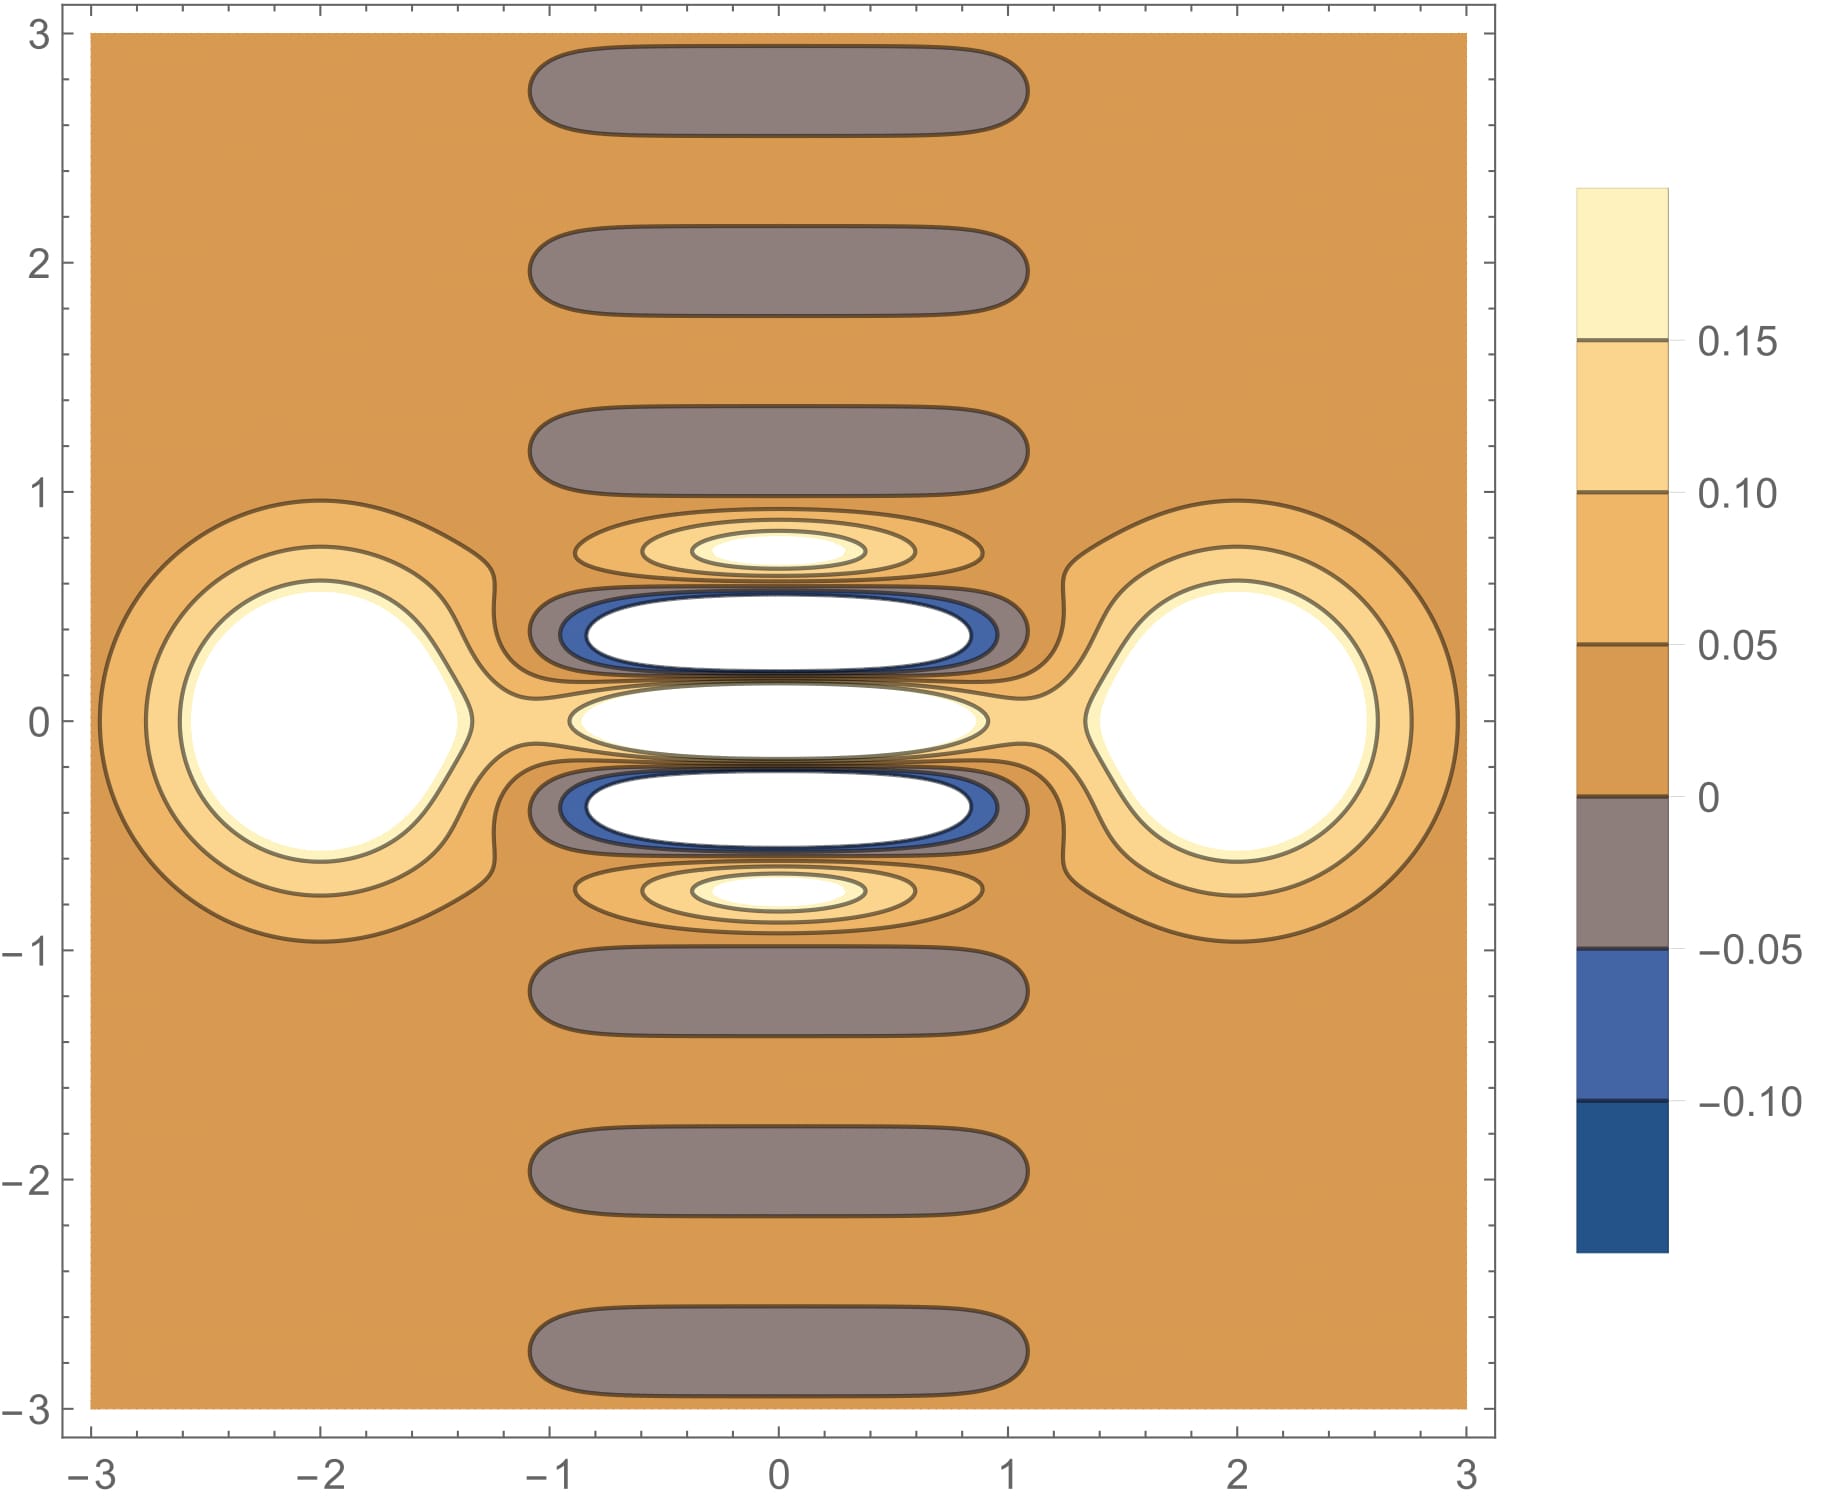
I have created a 3D plot and a contour plot for the same (Wigner) function, but as you see the contour plot is not right. It has some "extra" regions in gray color (ovals). What is going wrong? The 3D plot code is

Plot3D[2/((2 + 2/E^8) \[Pi]) (Exp[-2 (4 - 4 x + x^2 + y^2)] + Exp[-2 (4 + 4 x + x^2 + y^2)] + 2 Exp[-2 (x^2 + y^2)] Cos[8 y]), {x, -4, 4}, {y, -4, 4}, PlotRange -> Full, Exclusions -> None, PlotPoints -> 180, FaceGrids -> {{0, -1, 0}, {1, 0, 0}, {0, 0, -1}}, FaceGridsStyle -> Directive[Blue, Dotted], Boxed -> False, BoxRatios -> {1, 1, 1}, AxesLabel -> {"x", "y", "\!\(\*SubscriptBox[\(W\), \(c\)]\)(x,y)"}, LabelStyle -> {Bold, Black, FontSize -> 16}] 

The contour plot code is

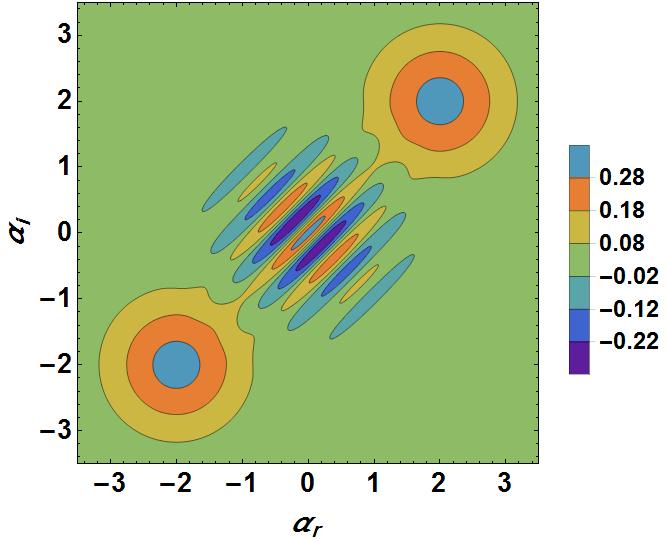
ContourPlot[ 2/((2 + 2/E^8) \[Pi]) (Exp[-2 (4 - 4 x + x^2 + y^2)] + Exp[-2 (4 + 4 x + x^2 + y^2)] + 2 Exp[-2 (x^2 + y^2)] Cos[8 y]), {x, -3, 3}, {y, -3, 3}, PlotLegends -> Automatic, PlotPoints -> 180] 

And here are the figures: enter image description here enter image description here

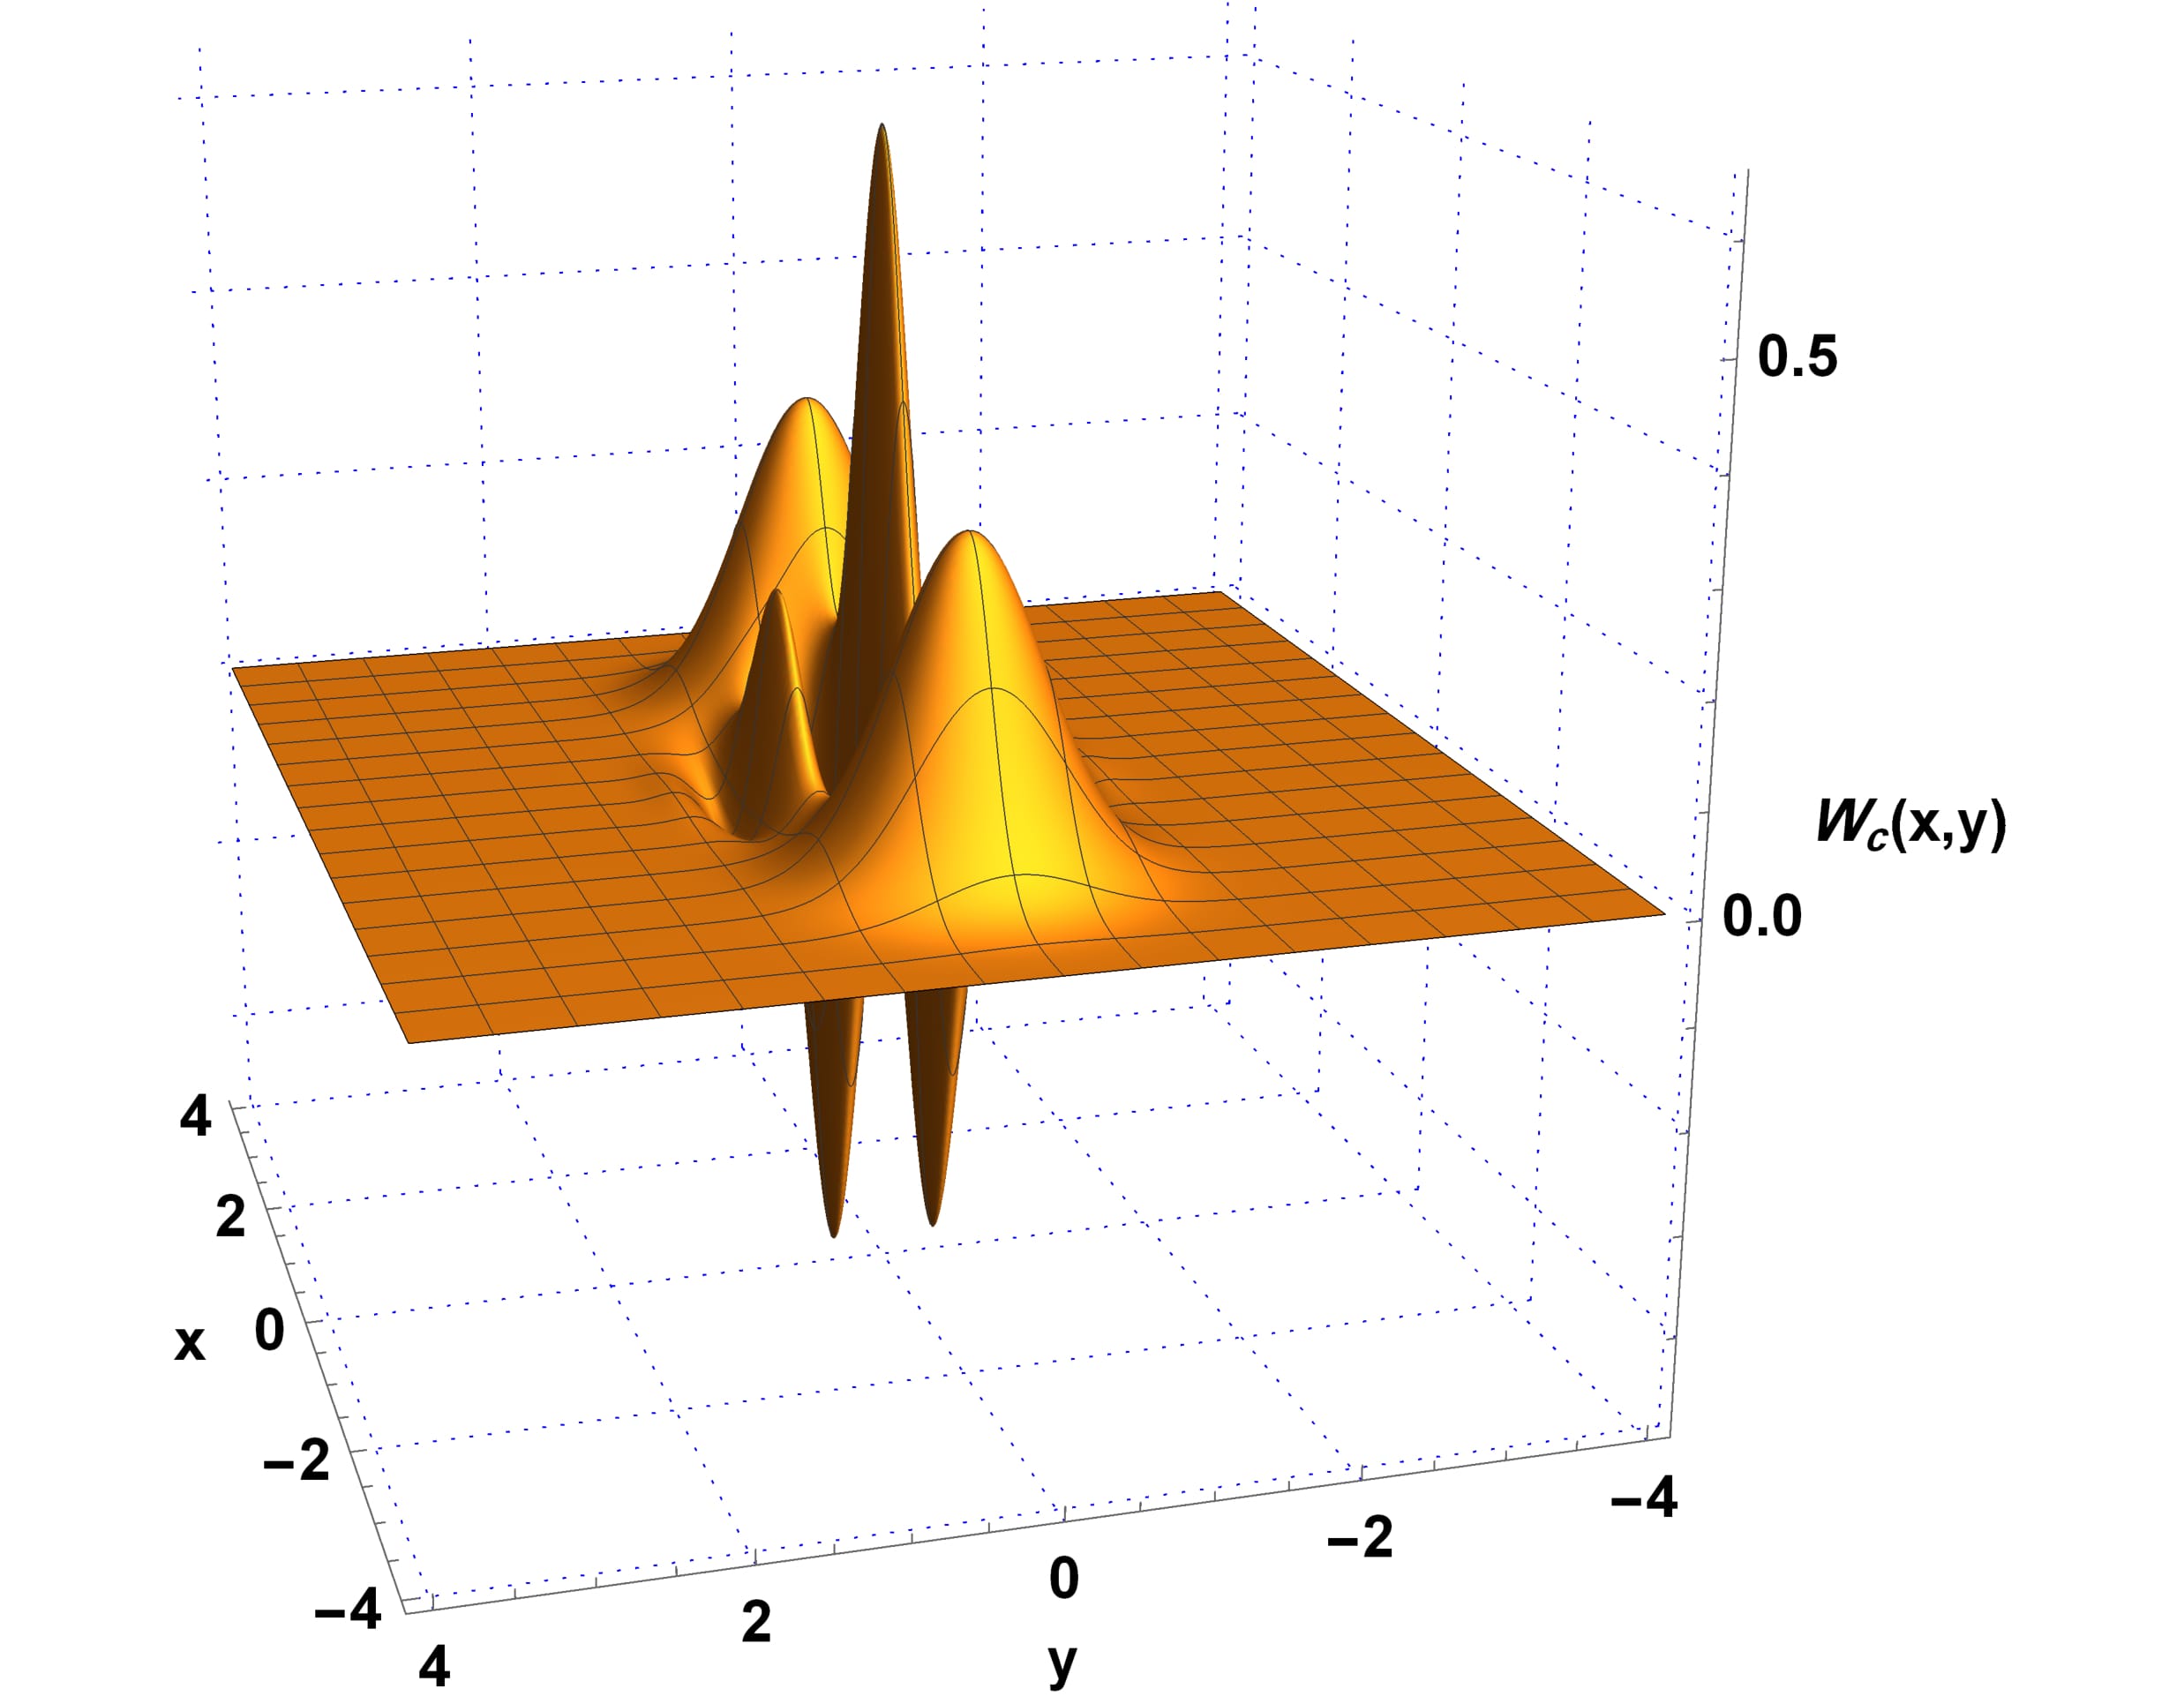
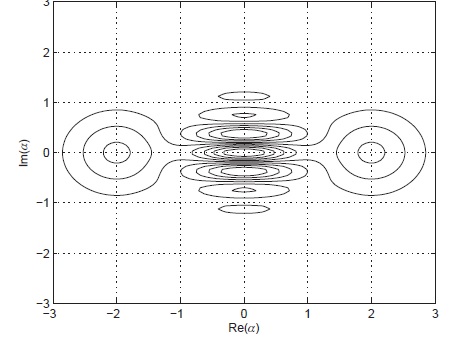
The real contour plot is taken from a textbook (Quantum Optics by Girish Agarwal, Cambridge U Press, 2013, page 80):

enter image description here

To emphasize that it is not a problem for a special case, here I have added another code and figure. You can see the "ugly" ovals are definitely incorrect.

ContourPlot[ 1/((2 + 2/E^16) \[Pi]) 2 (E^(((2 + 2 I) - x - I y) ((-2 + 2 I) + x - I y)) + E^(((-2 - 2 I) - x - I y) ((2 - 2 I) + x - I y)) + E^((-x - I y) (x - I y)) Cos[4 Im[(2 - 2 I) (x + I y)]]), {x, -4, 4}, {y, -4, 4}, PlotLegends -> Automatic, ColorFunction -> "Rainbow", FrameLabel -> {"x", "y"}, Frame -> True, FrameStyle -> Directive[Black, 18], PlotPoints -> 180, PlotRange -> All, PlotRangePadding -> 0] 

enter image description here

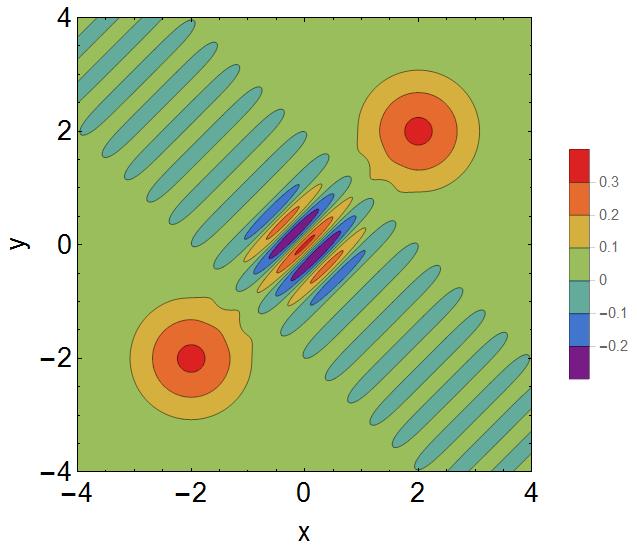
Adding Contours -> Range[-0.35, 0.35, 0.1] + 0.03 to my code generated the following plot, which is better, but another problem happened: the colors in the legend are not as they should be. For example, we have the same color for (-0.12,-0.02) and for (0.28,0.38)

enter image description here

$\endgroup$
12
  • $\begingroup$ What if you add PlotRange -> All to ContourPlot[]? $\endgroup$ Commented Sep 26, 2017 at 5:28
  • $\begingroup$ "from a textbook" - which textbook? If you don't give a citation, that statement is not very useful. $\endgroup$ Commented Sep 26, 2017 at 15:52
  • $\begingroup$ Quantum Optics by Girish Agarwal, Cambridge U Press, 2013, page 80 $\endgroup$ Commented Sep 26, 2017 at 17:21
  • $\begingroup$ PlotRange -> All did not work $\endgroup$ Commented Sep 26, 2017 at 17:22
  • 2
    $\begingroup$ does the textbook tell you the values for the contour lines? $\endgroup$ Commented Sep 26, 2017 at 17:40

1 Answer 1

6
$\begingroup$

It looks normal because if you try to draw the 1D dependence:

Plot[(2/((2 + 2/E^8) \[Pi]) (Exp[-2 (4 - 4 x + x^2 + y^2)] + Exp[-2 (4 + 4 x + x^2 + y^2)] + 2 Exp[-2 (x^2 + y^2)] Cos[8 y])) /. x -> 0, {y, -3, 3}, PlotRange -> {{0, 3}, All}, AxesLabel -> {Y, Z}, Epilog -> Inset[Plot[(2/((2 + 2/E^8) \[Pi]) (Exp[-2 (4 - 4 x + x^2 + y^2)] + Exp[-2 (4 + 4 x + x^2 + y^2)] + 2 Exp[-2 (x^2 + y^2)] Cos[8 y])) /. x -> 0, {y, 1.7, 2.5}, Frame -> True, PlotRange -> {-0.0005, 0.0001}], Scaled@{0.715, 0.75}]] 

Then:

enter image description here

The inset shows the small oscillations of the Z[y] at y>1.5

$\endgroup$
8
  • $\begingroup$ I added the real contour plot from a textbook. It shows that something is wrong $\endgroup$ Commented Sep 26, 2017 at 15:48
  • 1
    $\begingroup$ It's likely that the textbook is wrong. Those "extra" contours are contours of zero. The interior of those contours are very slightly negative. Try adding Contours->{0} to see that. And write a note to the textbook author. $\endgroup$ Commented Sep 26, 2017 at 16:03
  • 1
    $\begingroup$ @JimB - it isn't necessarily that the textbook is wrong, just that they made a decision not to put a contour at 0. This is a reasonable choice with decaying oscillatory functions. It's possible the authors list the contour values in the figure caption. $\endgroup$ Commented Sep 26, 2017 at 16:06
  • $\begingroup$ @JasonB. No disagreement with your comment. It is the color scheme plus the contour lines that makes things appear more extreme than they are. I was also using the more binary choice of "right" and "wrong" implied by the OP. $\endgroup$ Commented Sep 26, 2017 at 16:17
  • 2
    $\begingroup$ @JasonB. You should write-up your answer about not having a contour at zero. Using Contours -> {-0.4, -0.35, -0.3, -0.25, -0.2, -0.15, -0.1, -0.05, 0.05, 0.1, 0.15, 0.2, 0.25, 0.3} (which avoids the zero contour) seems to reconcile the issue. $\endgroup$ Commented Sep 26, 2017 at 16:27

Start asking to get answers

Find the answer to your question by asking.

Ask question

Explore related questions

See similar questions with these tags.