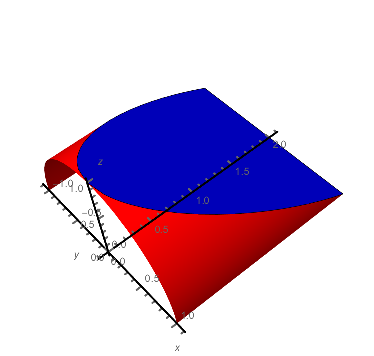
Here's a way, but you lose the misaligned mesh lines:
A1 = ParametricPlot3D[{Sqrt[1 - z^2], y, z}, {y, 0, 2}, {z, 0, -y/2 + 1}, PlotStyle -> {Red}, PlotStyle -> Thickness[0.02], AxesStyle -> Thick, Boxed -> False, AxesOrigin -> {0, 0, 0}, AxesLabel -> {x, y, z}, Mesh -> None, BoundaryStyle -> Green]; A2 = ParametricPlot3D[{-Sqrt[1 - z^2], y, z}, {y, 0, 2}, {z, 0, -y/2 + 1}, PlotStyle -> {Red}, PlotStyle -> Thickness[0.02], AxesStyle -> Thick, Boxed -> False, AxesOrigin -> {0, 0, 0}, AxesLabel -> {x, y, z}, Mesh -> None, BoundaryStyle -> Green]; boundaryPoints = Join[ First@Cases[Normal@A1, Line[p_] :> DeleteCases[p, {x_Real, y_Real, z_Real} /; (z == 0 && y != 2) || (y == 0 && z != 0 && z != 1)], Infinity], Reverse@First@Cases[Normal@A2, Line[p_] :> DeleteCases[p, {x_Real, y_Real, z_Real} /; (z == 0 && y != 2) || (y == 0 && z != 0 && z != 1)], Infinity] ]; Show[ DeleteCases[A1, _Line, Infinity], (* remove green boundary *) DeleteCases[A2, _Line, Infinity], Graphics3D[{Blue, Polygon@boundaryPoints}] ]
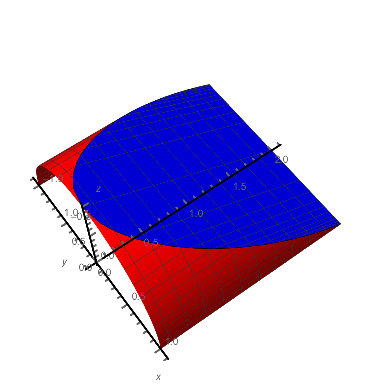
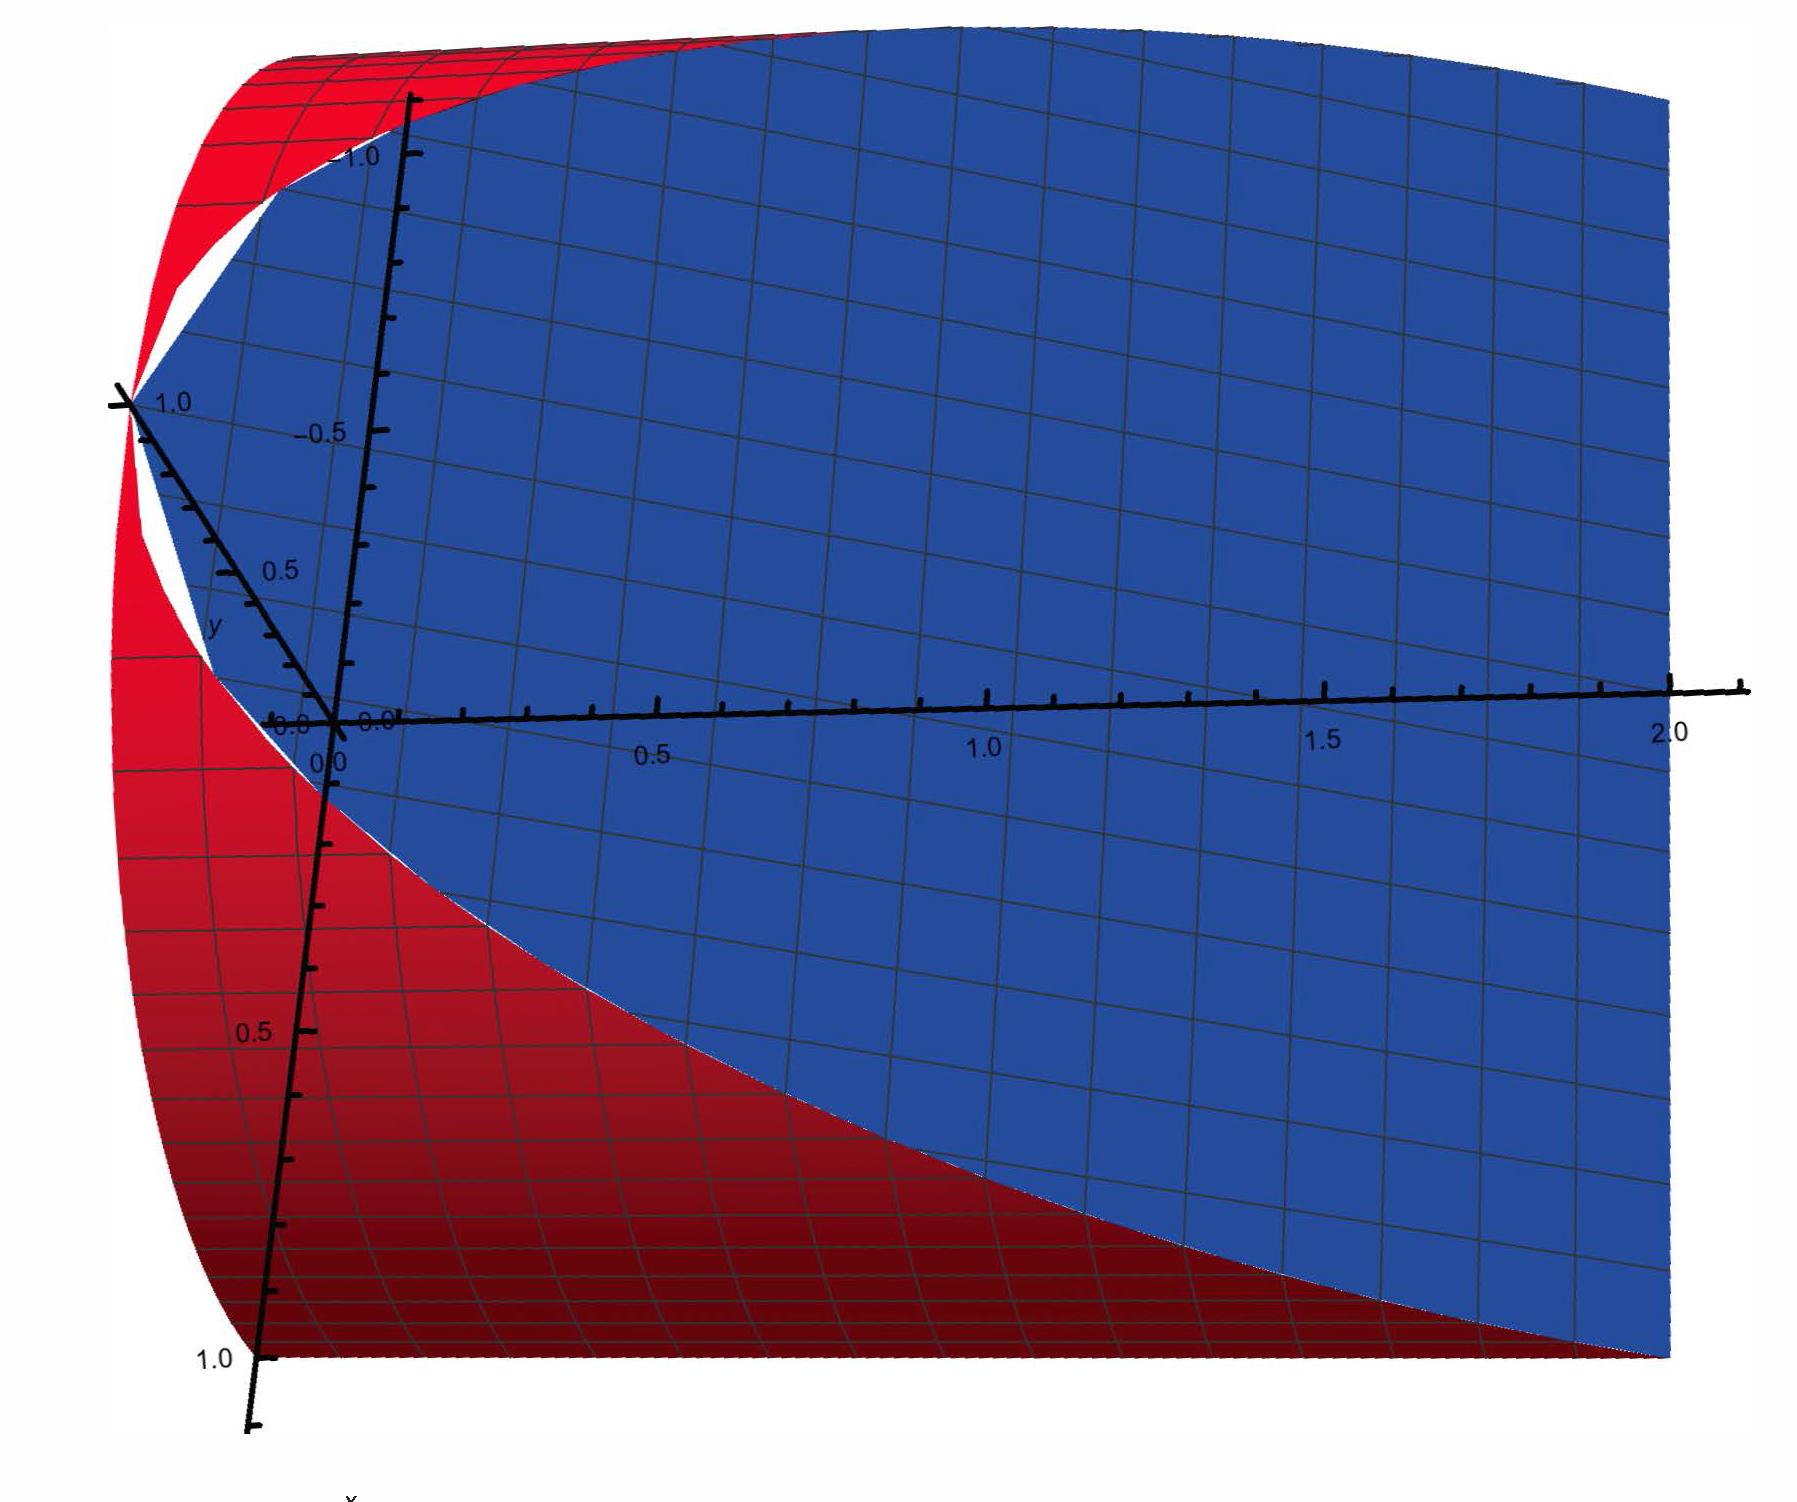
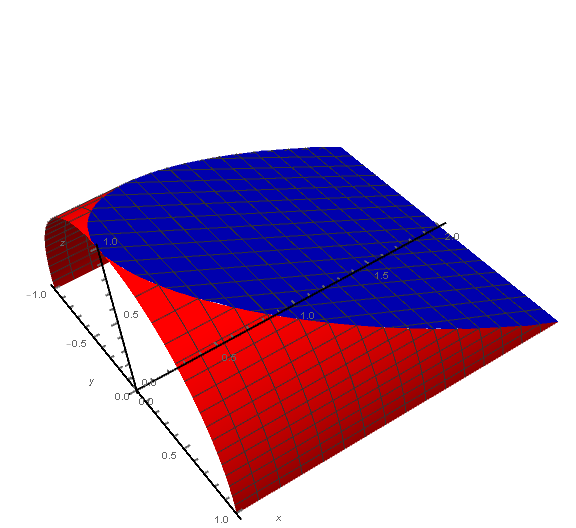
Here's a way to get the meshes aligned:
A1 = ParametricPlot3D[{Sqrt[1 - z^2], y, z}, {y, 0, 2}, {z, 0, -y/2 + 1}, PlotStyle -> {Red}, PlotStyle -> Thickness[0.02], AxesStyle -> Thick, Boxed -> False, AxesOrigin -> {0, 0, 0}, AxesLabel -> {x, y, z}, Mesh -> None, BoundaryStyle -> Green]; ypts = Cases[Normal@A1, Line[p_] :> DeleteCases[p, {x_Real, y_Real, z_Real} /; (z == 0 && y != 2) || (y == 0 && z != 0 && z != 1)], Infinity][[1, All, 2]] // DeleteDuplicates; mf = {#2 &, #3 &}; mesh = {Subdivide[-2, 2, 21], Subdivide[0, 1, 11]}; A3 = ListPlot3D[Flatten[Table[ Table[{x, y, -y/2 + 1}, {x, Subdivide[-Sqrt[y - y^2/4], Sqrt[y - y^2/4], Sqrt[y - y^2/4]/16 /. {dx_ /; dx == 0 :> 1, _ -> 10}]}], {y, ypts}], 1], PlotStyle -> {Blue}, PlotStyle -> Thickness[0.02], AxesStyle -> Thick, AxesOrigin -> {0, 0, 0}, AxesLabel -> {x, y, z}, MeshFunctions -> {#1 &, #2 &}, Mesh -> {Join[-#, #] &@Sqrt[1 - Last@mesh^2], First@mesh}]; A1 = ParametricPlot3D[{Sqrt[1 - z^2], y, z}, {y, 0, 2}, {z, 0, -y/2 + 1}, PlotStyle -> {Red}, PlotStyle -> Thickness[0.02], AxesStyle -> Thick, Boxed -> False, AxesOrigin -> {0, 0, 0}, AxesLabel -> {x, y, z}, MeshFunctions -> {#2 &, #3 &}, Mesh -> mesh]; Show[ A1, A1 /. (* reflect A1 and its VertexNormals *) GraphicsComplex[p_, g_, opts___] :> GraphicsComplex[p.DiagonalMatrix[{-1, 1, 1}], g, {opts} /. HoldPattern[VertexNormals -> v_] :> VertexNormals -> v.DiagonalMatrix[-{-1, 1, 1}]], A3]
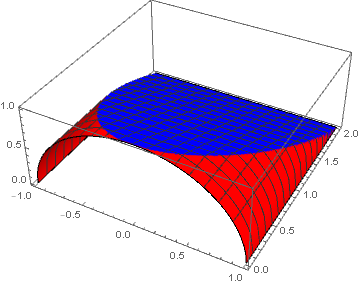
PlotPoints->100in A3-plot! $\endgroup$