This is my first time to post here, so please bear with me as I learn how to post and format properly ...
I've been using Charting`FindTicks to get a list of the tick marks, both major and minor, from various plots. My intention is to develop modules for further enhancing my plots, and I require the list of generated tick marks from both axes. In some particular cases, however, I've noticed that the plot generated by Mathematica does not match what I get using Charting`FindTicks.
Here is an example plot of the sine function. (Note that I am not explicitly setting PlotRange in this case, although even when I do, I still come up with the same discrepancy that I am describing in this post.)
PLT=Plot[Sin[x], {x, 0, 2 \[Pi]}] 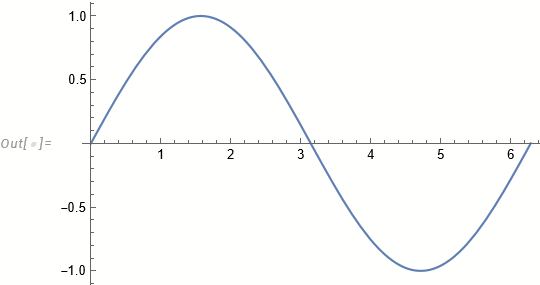
Regarding the horizontal axis, we see that the major ticks are {0,1,2,3,4,5,6}, and the minor tick marks are spaced at intervals of 0.2.
Now I extract the list of tick marks as follows:
Charting`FindTicks[{0, 1}, {0, 1}] @@ PlotRange[PLT][[1]] {{0.,0},{2.,2},{4.,4},{6.,6},{8.,8},{0.,,{0.005,0.},{AbsoluteThickness[0.1]}},{0.5,,{0.005,0.},{AbsoluteThickness[0.1]}},{1.,,{0.005,0.},{AbsoluteThickness[0.1]}},{1.5,,{0.005,0.},{AbsoluteThickness[0.1]}},{2.,,{0.005,0.},{AbsoluteThickness[0.1]}},{2.,,{0.005,0.},{AbsoluteThickness[0.1]}},{2.5,,{0.005,0.},{AbsoluteThickness[0.1]}},{3.,,{0.005,0.},{AbsoluteThickness[0.1]}},{3.5,,{0.005,0.},{AbsoluteThickness[0.1]}},{4.,,{0.005,0.},{AbsoluteThickness[0.1]}},{4.,,{0.005,0.},{AbsoluteThickness[0.1]}},{4.5,,{0.005,0.},{AbsoluteThickness[0.1]}},{5.,,{0.005,0.},{AbsoluteThickness[0.1]}},{5.5,,{0.005,0.},{AbsoluteThickness[0.1]}},{6.,,{0.005,0.},{AbsoluteThickness[0.1]}},{6.,,{0.005,0.},{AbsoluteThickness[0.1]}},{6.5,,{0.005,0.},{AbsoluteThickness[0.1]}},{7.,,{0.005,0.},{AbsoluteThickness[0.1]}},{7.5,,{0.005,0.},{AbsoluteThickness[0.1]}},{8.,,{0.005,0.},{AbsoluteThickness[0.1]}}}
Note that the first items of the list should show the labeled major ticks of the horizontal axes of the plot, however this only lists {0,2,4,6,8}. Further, the remaining minor ticks are spaced at intervals of 0.5, not 0.2 as displayed.
Why does this output from Charting`FindTicks not match the displayed plot?
In contrast, note that the displayed and extracted ticks of the vertical axis are in agreement. The displayed major ticks are {-1,-0.5,0,0.5,1} with minor tick intervals of 0.1. The extracted ticks are the same:
Charting`FindTicks[{0, 1}, {0, 1}] @@ PlotRange[PLT][[2]] {{-1.,-1.0},{-0.5,-0.5},{0.,0},{0.5,0.5},{1.,1.0},{-1.,,{0.005,0.},{AbsoluteThickness[0.1]}},{-0.9,,{0.005,0.},{AbsoluteThickness[0.1]}},{-0.8,,{0.005,0.},{AbsoluteThickness[0.1]}},{-0.7,,{0.005,0.},{AbsoluteThickness[0.1]}},{-0.6,,{0.005,0.},{AbsoluteThickness[0.1]}},{-0.5,,{0.005,0.},{AbsoluteThickness[0.1]}},{-0.5,,{0.005,0.},{AbsoluteThickness[0.1]}},{-0.4,,{0.005,0.},{AbsoluteThickness[0.1]}},{-0.3,,{0.005,0.},{AbsoluteThickness[0.1]}},{-0.2,,{0.005,0.},{AbsoluteThickness[0.1]}},{-0.1,,{0.005,0.},{AbsoluteThickness[0.1]}},{0.,,{0.005,0.},{AbsoluteThickness[0.1]}},{0.,,{0.005,0.},{AbsoluteThickness[0.1]}},{0.1,,{0.005,0.},{AbsoluteThickness[0.1]}},{0.2,,{0.005,0.},{AbsoluteThickness[0.1]}},{0.3,,{0.005,0.},{AbsoluteThickness[0.1]}},{0.4,,{0.005,0.},{AbsoluteThickness[0.1]}},{0.5,,{0.005,0.},{AbsoluteThickness[0.1]}},{0.5,,{0.005,0.},{AbsoluteThickness[0.1]}},{0.6,,{0.005,0.},{AbsoluteThickness[0.1]}},{0.7,,{0.005,0.},{AbsoluteThickness[0.1]}},{0.8,,{0.005,0.},{AbsoluteThickness[0.1]}},{0.9,,{0.005,0.},{AbsoluteThickness[0.1]}},{1.,,{0.005,0.},{AbsoluteThickness[0.1]}}}
I appreciate your help in understanding what is going on with the horizontal axis. How can I programmatically extract the actual ticks being displayed?