1
\$\begingroup\$

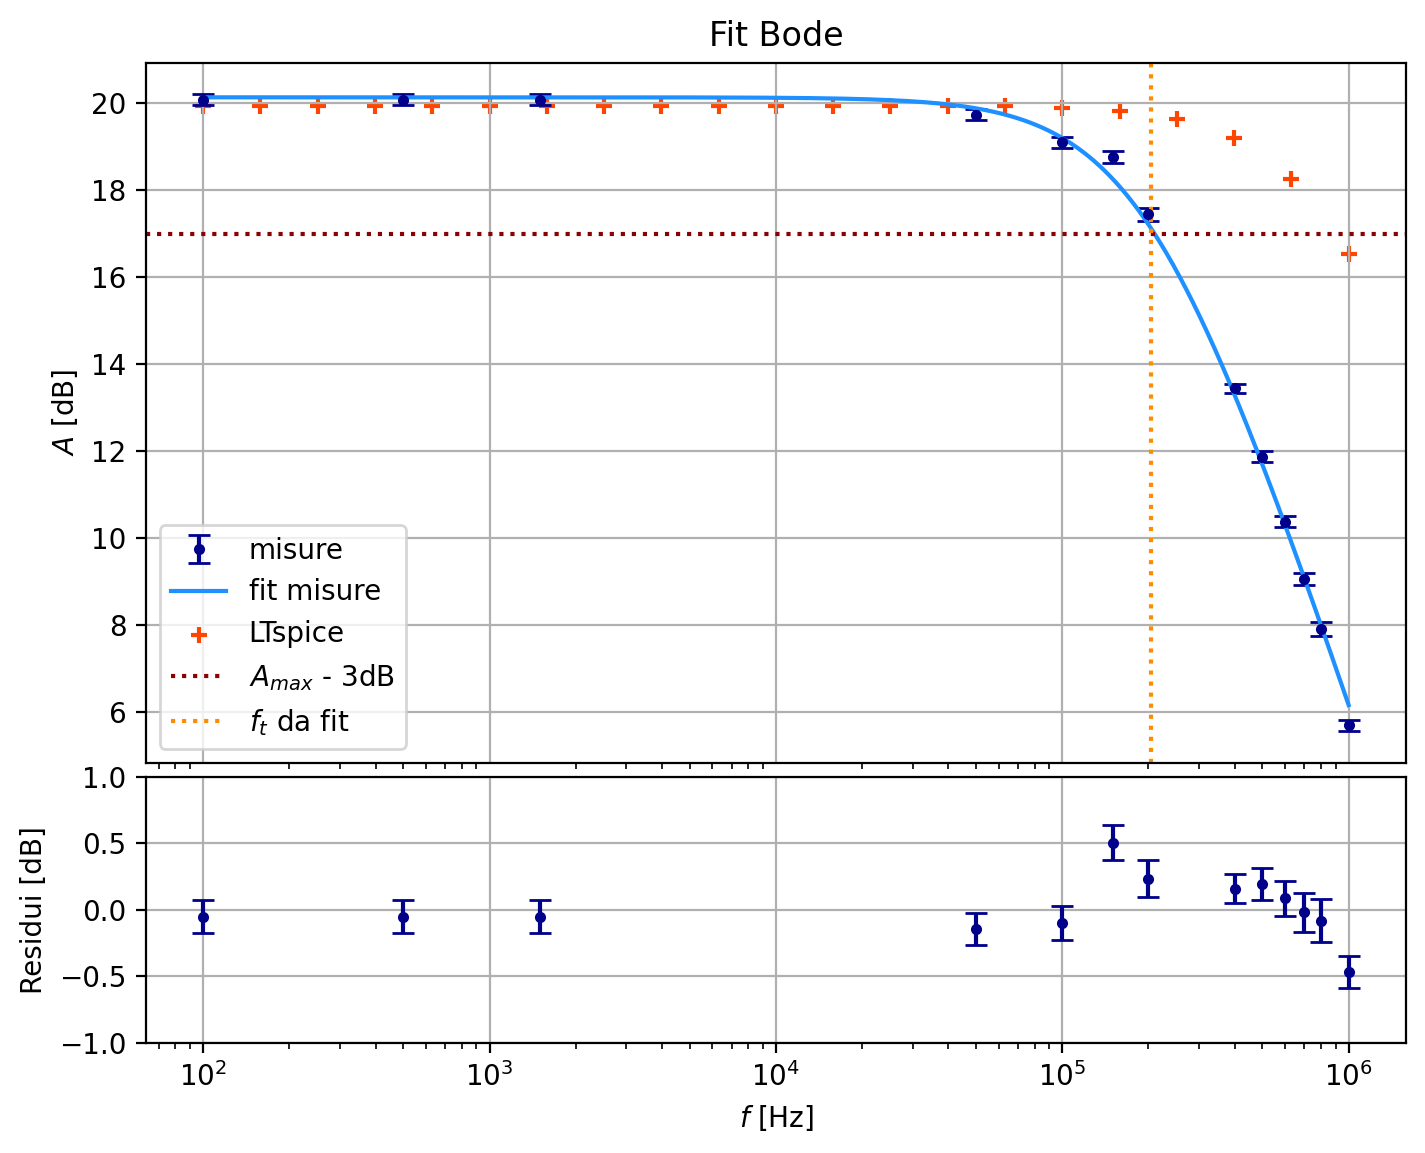
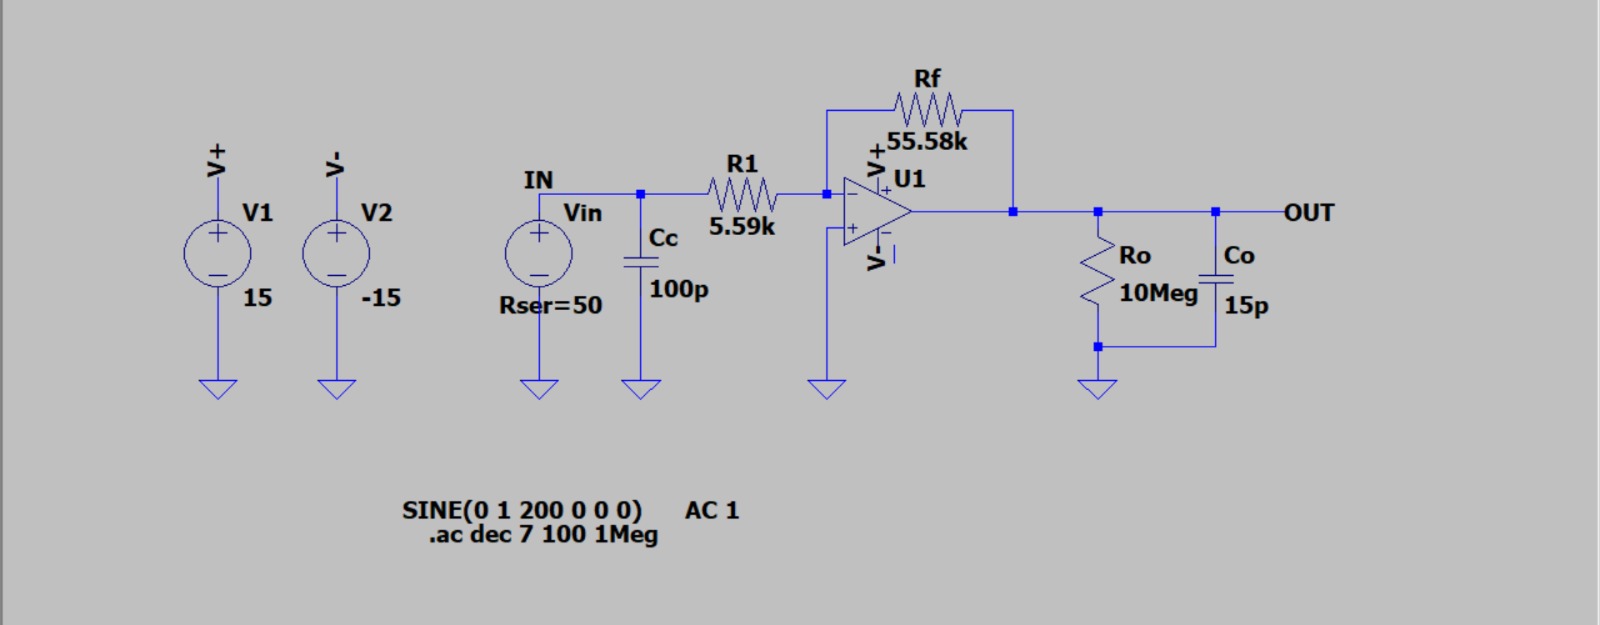
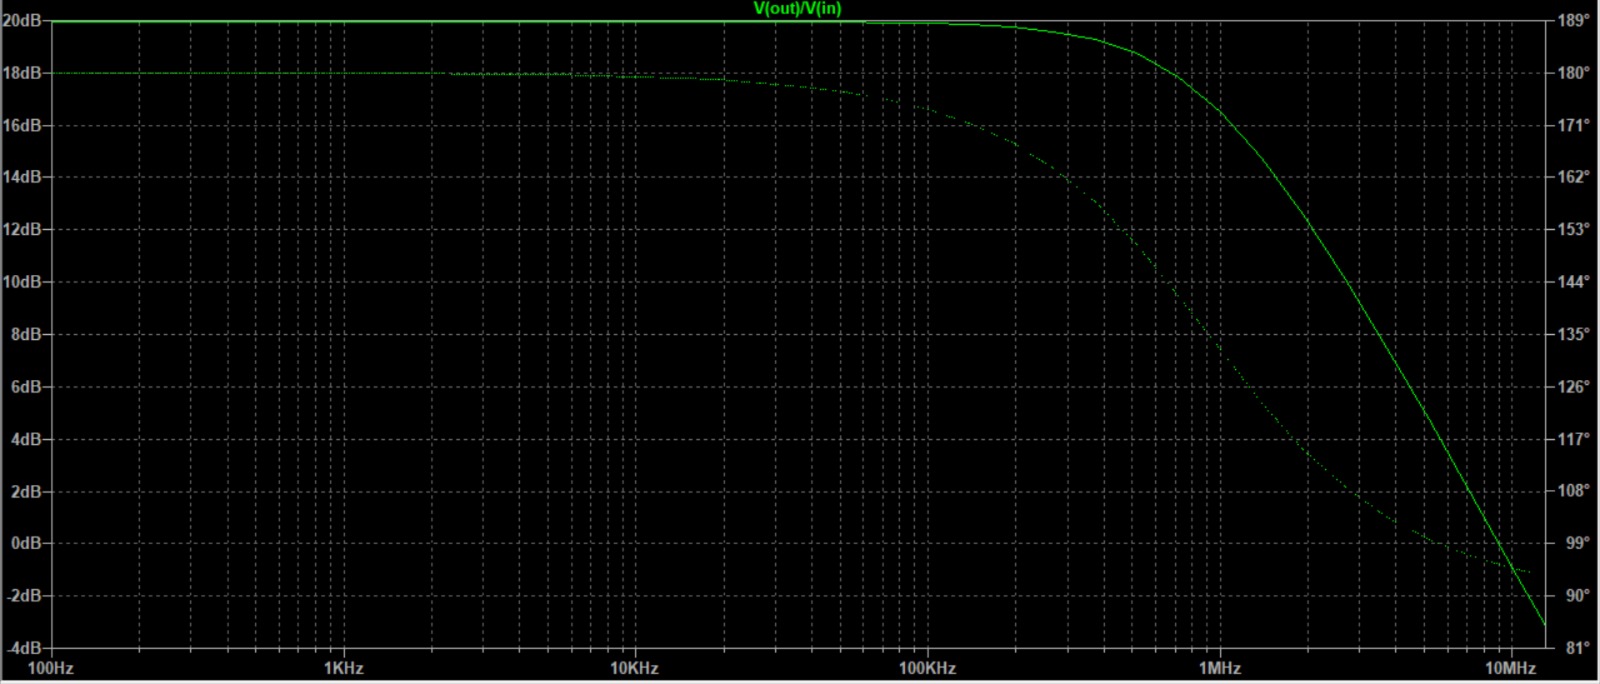
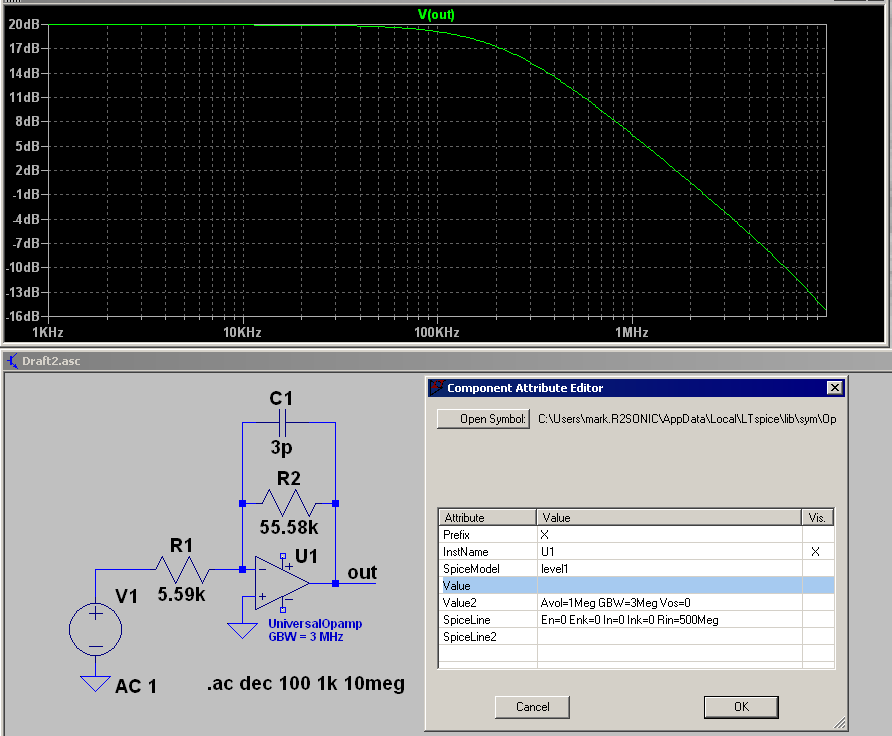
I have a simple inverting opamp amplifier and I want to study the frequency response of the circuit and finally calculate the frequency band (or cutoff frequency). Unfortunately the model created in LTspice gives very different output from the data I collected doing the circuit manually in laboratory.

What I get is a very different cutoff frequency, but the amplification is okay. I'm gonna link to you the pictures of our frequency response with our data, and then also the circuit we use in LTspice and the output. As you can see in the LTspice simulation cutoff frequency is something like 1MHz but in our data we estimated it to be 200kHz more or less.

Frequency response with LTspice plotted in orange/red (the blue dots are the data and the blue line is the fitted function to the data)

Circuit used in LTspice

Frequency response in LTspice

\$\endgroup\$
2
  • \$\begingroup\$ Also note that in the LTspice circuit I added some capacitance and resistance (Cc, R0, C0) which are the cable, oscilloscopes and probes effects on the circuit. But removing them doesn't really change the plot \$\endgroup\$ Commented Dec 4, 2023 at 18:32
  • \$\begingroup\$ What opamp are you using in practice? Did you set the gain-bandwidth product in the opamp model you’re using? \$\endgroup\$ Commented Dec 4, 2023 at 18:53

3 Answers 3

2
\$\begingroup\$

Looks like you are using a behavioural opamp model. If so, you need to adjust the gain-bandwidth (GBW) of the model to match the GBW of the TL082 which is typically 3 MHz. Depending on the breadboard system you are using, the contact capacitance can alter the operation of the actual circuit. In the simulation below, the UniversalOpamp model GBW is set to 3 MHz and 3 pF was added to the feedback capacitor which mimics the breadboard capacitance which gives a -3 dB frequency around 200 kHz.

enter image description here

It is better to use the SPICE model for the actual part. You can download the model from the manufacturer which is on Texas Instruments web site for the TL082. This is a PSpice model which is normally compatible with LTspice.

\$\endgroup\$
1
  • \$\begingroup\$ Thanks, as of now I prefer to just modify the GBW of the universal opamp because for some way with 3MHz of GBW the simulation still doesn't fit the data. I calculated from our data the GBW and it seems to be of 2MHz more or less. Using this value the simulation is way better \$\endgroup\$ Commented Dec 5, 2023 at 9:09
2
\$\begingroup\$

The model that you use can make a big difference in the frequency response. I don't see any number for the op-amp in the schematic, which suggests you may be using a generic op-amp model. You should be using the model for whatever real op-amp you are using in the lab.

The construction method also makes a difference, for instance if you are building the circuit on a breadboard there will be capacitance between the connector strips that will affect the response.

\$\endgroup\$
7
  • \$\begingroup\$ I think the model is TL082C. How can I include this option into LTspice? \$\endgroup\$ Commented Dec 4, 2023 at 19:16
  • \$\begingroup\$ @Gabriele So is the spice model TL082C or is that what you are using in the lab? If you need to add the TL082 model you can have a look at this link. \$\endgroup\$ Commented Dec 4, 2023 at 19:28
  • \$\begingroup\$ No it’s the one we are using in the lab. I’ll try with the link. Thank you! \$\endgroup\$ Commented Dec 4, 2023 at 19:33
  • \$\begingroup\$ @Gabriele You might check if your version of LTspice has it already, I think it has it on my home computer but not my work one (I think this one is behind on updates). They add new models all the time. \$\endgroup\$ Commented Dec 4, 2023 at 19:43
  • 1
    \$\begingroup\$ @Gabriele Download the TL082C SPICE model from TI's web site. If you're using LTspice's universal opamp model, you can adjust the GBW parameter (right-click on the opamp symbol) to better match the actual part. \$\endgroup\$ Commented Dec 4, 2023 at 20:23
0
\$\begingroup\$

Well, notice that your transfer function is given by:

$$\mathscr{H}\left(\text{s}\right):=\frac{\displaystyle\text{V}_\text{o}\left(\text{s}\right)}{\displaystyle\text{V}_\text{i}\left(\text{s}\right)}=-\frac{\displaystyle\text{R}_\text{f}}{\displaystyle\text{R}_1\left(1+\text{C}_\text{c}\text{R}_\text{ser}\text{s}\right)+\text{R}_\text{ser}}\tag1$$

So, for the amplitude plot (in dB) you get:

$$\left|\space\underline{\mathscr{H}}\left(\text{j}\omega\right)\right|_{\space\text{dB}}=20\log_{10}\left(\frac{\displaystyle\text{R}_\text{f}}{\displaystyle\sqrt{\left(\text{R}_1+\text{R}_\text{ser}\right)^2+\left(\text{C}_\text{c}\text{R}_1\text{R}_\text{ser}\omega\right)^2}}\right)\tag2$$

Using your values, we get:

$$\left|\space\underline{\mathscr{H}}\left(\text{j}\omega\right)\right|_{\space\text{dB}}=20\log_{10}\left(\frac{\displaystyle55580}{\displaystyle\sqrt{\left(5590+50\right)^2+\left(10^{-10}\cdot5590\cdot50\omega\right)^2}}\right)\tag3$$

\$\endgroup\$

Start asking to get answers

Find the answer to your question by asking.

Ask question

Explore related questions

See similar questions with these tags.