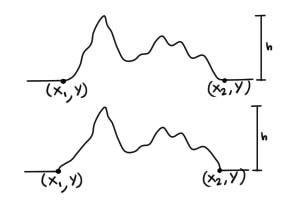
I am going crazy trying to create this. I am trying to create a pulsar graph that starts and ends on two points that have the same y smoothly along the x axis. The pulsar should have random valleys and peaks. The height of the graph should also be variable.
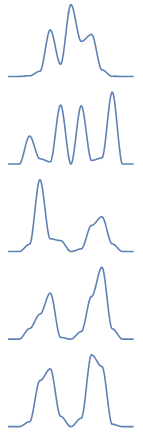
Here the first graph is what I want, while the second one is the best that I think I can produce.
I have tried lots of different things from generating some random points and trying to interpolate them(the result is not smooth along the x axis) to adding random functions using Exp[](but failing on making it fall between two points).
This is to create something similar to
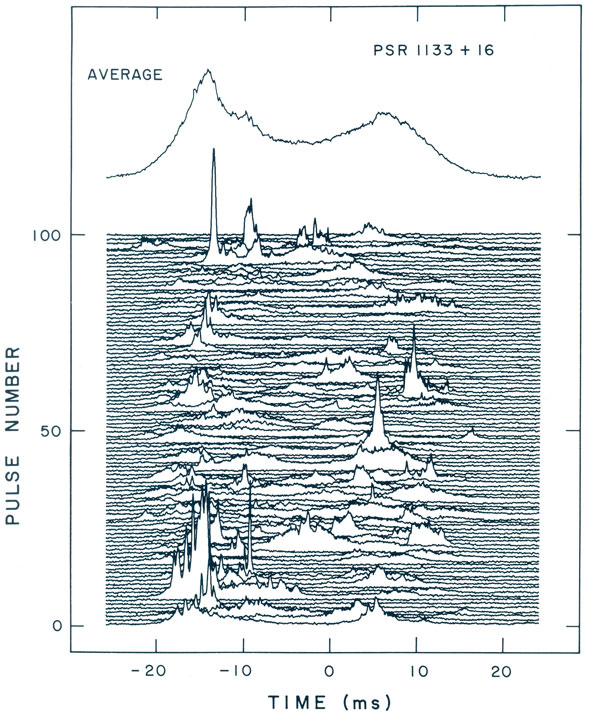
(source)
or

but still have more freedom on where to put the waves. I hope I managed to explain myself correctly.
P.D. I managed to find this similar answer in the past, but I cant make the graph between two random points and hence creating this question.
Edit: After lots of trial an error I found a way to do this.
I created 3 functions.
Jaggify[list_, height_] := Union[Flatten[ Table[{list[[x]], {(list[[x, 1]] + list[[x + 1, 1]])/ 2., (list[[x, 2]] + list[[x + 1, 2]])/2. + height RandomReal[]^5}, list[[x + 1]]}, {x, 1, Length[list] - 1}], 1]] This function receives a list of points. Then it iterates over pair of points and adds a new one in between. The height of the new point is in the middle of the two adjacent points plus a random value.
RandomPulsarPoints[start_, end_, y_, peaks_, height_] := Module[{list, seedlist}, list = Table[{start + x, y}, {x, 0, end - start, (end - start)/ peaks}]; seedlist = Table[ {list[[linum, 1]], list[[linum, 2]] + If[linum == 1 || linum == 2 || linum == Length[list] - 1 || linum == Length[list] , 0 , RandomChoice[{1/linum^3, 1 - 1/linum^3} -> {height^3 RandomReal[], height (RandomReal[])^3}]]}, {linum, 1, Length[list]}]; Join[{First[seedlist]}, Jaggify[Jaggify[Most[Rest[seedlist]], height], height/2], {Last[seedlist]}] ] This function generates a list of random points between start and end. The first two points and the last two have the same y value to force the graph to start and end smoothly. You can define how tall and how many peaks are there going to be in that interval.
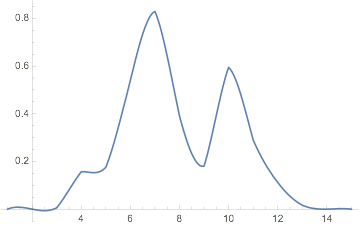
pulsar[start_, end_, y_, height_, peaks_] := Module[{length = end - start}, If[length == 0 || peaks == 0, BSplineCurve[{{start, y}, {end, y}}], BSplineCurve[RandomPulsarPoints[start, end, y, peaks, height]]]] This final function just uses the previous functions to create a BSplineCurve.
Graphics[pulsar[0, 10, 0, 3, 10]] 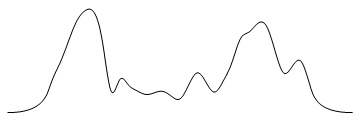
I hope this is useful to someone else. :)
I think this question can be closed now.
BrownianBridgeProcess[ ]$\endgroup$