So I dug up a function I had written to create a custom histogram, and have modified it to do the task here.
sortedHistogram[data_, colorlist_, labellist_, plotopts : OptionsPattern[]] := Module[{bins, bincounts, width, rectangles}, (* Check that you have given a color and label for each data set *) If[Not@SameQ[Length[data], Length@colorlist, Length@labellist], Print["List dimensions not equal"]; Abort[]; ]; (*Next we get the bins that would result from doing a histogram on \ the entire data set *) bins = HistogramList[Flatten@data][[1]]; (* Then we get the bincounts for the individual data sets *) bincounts = Last@HistogramList[#, {bins}] & /@ data; width = First@Differences@bins; (* Create an array of rectangles *) rectangles = Function[{color, heights}, {EdgeForm[Black], color, Rectangle[{#1 - 0.5 width, 0}, {#1 + 0.5 width, #2}]} & @@@ Transpose[{Mean /@ (Partition[bins, 2, 1]), heights}]] @@@ Transpose[{colorlist, bincounts}]; (* Then sort them, putting the smallest in front. This involves a transpose, sort, transpose sequence *) rectangles = Transpose[ Sort[#, #1[[3, 2, 2]] > #2[[3, 2, 2]] &] & /@ Transpose[rectangles]]; (* Now we show the data, and I've included the legend by default *) Legended[ Show[Graphics /@ rectangles, plotopts, Frame -> True, AspectRatio -> 0.7], SwatchLegend[colorlist, labellist] ] ];
We'll try it on some test data,
data = RandomVariate[NormalDistribution[#1, #2], 300] & @@@ {{2, 2}, {6, 2}, {4, 3}, {0, 4}};
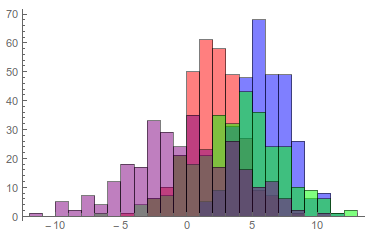
This is the default histogram,
Histogram[data, ChartStyle -> {Red, Blue, Green, Purple}]
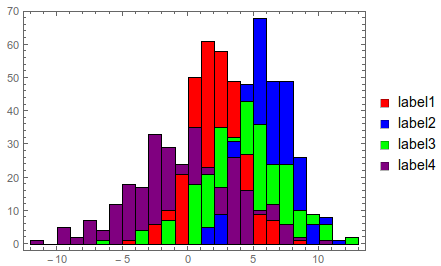
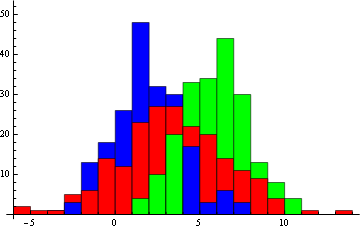
And here is the sorted histogram,
sortedHistogram[data, {Red, Blue, Green, Purple}, {"label1", "label2", "label3", "label4"}]
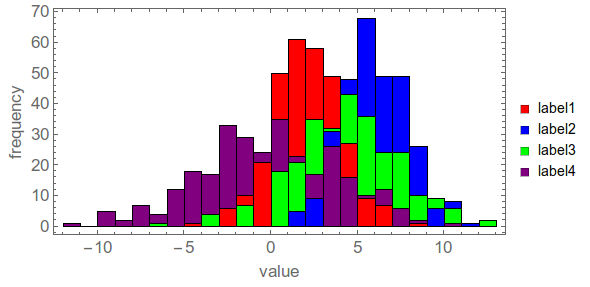
You can give any graphics options to customize the plot,
sortedHistogram[data, {Red, Blue, Green, Purple}, {"label1", "label2", "label3", "label4"}, AspectRatio -> .5, ImageSize -> 500, FrameLabel -> {"value", "frequency"}, BaseStyle -> 16]
However, the BaseStyle won't apply to the legend labels. To do that you need to give a Style object for the labels. For example instead of {"label1", "label2", "label3", "label4"}, put Style[#, 18, FontFamily -> "Times"] & /@ {"label1", "label2", "label3", "label4"}
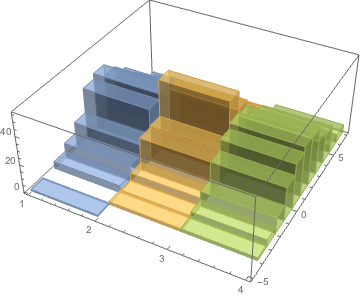
Histogram3D[MapIndexed[{First@#2, #1} &, data, {2}], ChartStyle -> {Blue, Green, Red}]$\endgroup$EdgeFormis used. Ideally I would have something like that where the bars are filled and ordered front to back from small to large $\endgroup$SmoothHistogram(see answer from @AndyRoss at mathematica.stackexchange.com/a/2316/19758) and/orSmoothKernelDistribution(if you want to do more than just display the distribution). $\endgroup$