Mathematica will not, in general, do arbitrary order interpolation on unstructured grids:
<< NDSolve`FEM` f[x_, y_] := (1 - x^2 + y^2); mesh = ToElementMesh[Disk[]]; coords = mesh["Coordinates"]; vals = f @@ # & /@ coords; if = Interpolation[MapThread[{#1, #2} &, {coords, vals}], InterpolationOrder -> 2] results in a message saying Interpolation::udeg: Interpolation on unstructured grids is currently only supported for InterpolationOrder->1 or InterpolationOrder->All. Order will be reduced to 1.
On the other hand if I use ElementMeshInterpolation:
emif2 = ElementMeshInterpolation[{mesh}, vals, InterpolationOrder -> 2] It seems to have no problem. It also seems to only actually give the first order interpolation no matter what I specify. If I plot the difference between Interpolation and ElementMeshInterpolation run at first and second order I get identical plots.
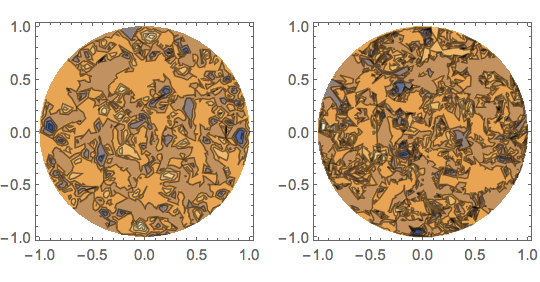
if1 = Interpolation[MapThread[{#1, #2} &, {coords, vals}], InterpolationOrder -> 1] emif1 = ElementMeshInterpolation[{mesh}, vals, InterpolationOrder -> 1] emif2 = ElementMeshInterpolation[{mesh}, vals, InterpolationOrder -> 2] GraphicsGrid[{{ContourPlot[emif1[x, y] - if1[x, y], {x, y} \[Element] Disk[]], ContourPlot[emif2[x, y] - if1[x, y], {x, y} \[Element] Disk[]]}}] 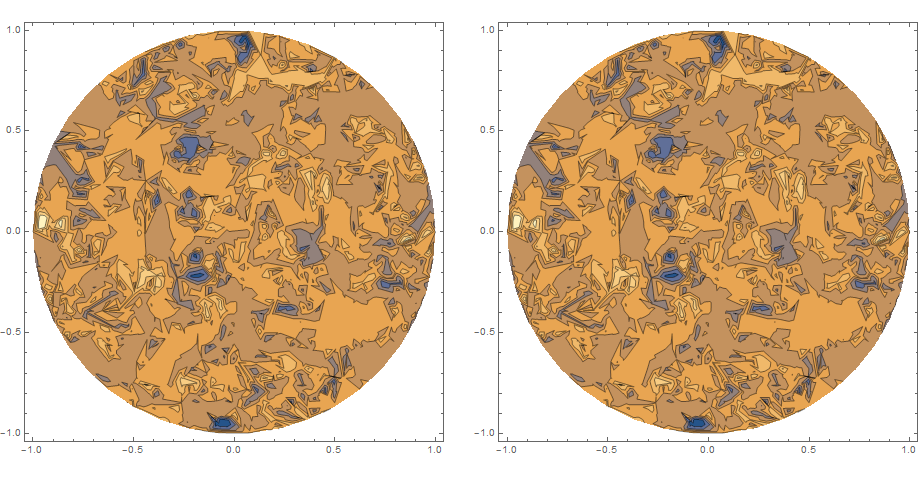
Is ElementMeshInterpolation silently falling back to 1st order? Is there any way to get higher order interpolations on an unstructured grid?
1or2, and it depends on the order of the underlying mesh. OTOH, your example seems to raise a more particular question. $\endgroup$