3
$\begingroup$

Huge thanks to those who have helped me find my footing especially to @bRost03 who did the programming below.

I hope you guys don't mind if I clarify one thing about the programming - I think I have sorted most of it out and it is a very short query!

Below is the code from my Mathematica terminal:

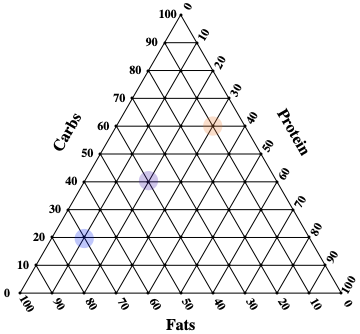
data = {{{20., 25., 55.,}, {35., 25., 40.,}, {10., 15., 75.,}, {5., 50., 45.,}, {25., 65., 10.,}, {55., 25., 20.,}}} toGrid[p_] := 1/2 {2 p[[2]] + p[[3]], Sqrt[3] p[[3]]}; dataPts = {10 toGrid[Most@#], Last@#} & /@ data; pts3D = Select[Tuples[Range[0, 10], {3}], #[[1]] + #[[2]] + #[[3]] == 10 &]; pts = toGrid /@ pts3D; ptsG = Table[toGrid /@ Select[pts3D, #[[i]] == 0 &], {i, 3}]; lines = {Thread[{ptsG[[1]], ptsG[[2]]}], Thread[{ptsG[[2]], ptsG[[3]]}], Thread[{ptsG[[1]], Reverse[ptsG[[3]]]}]}; st[sz_] := Style[#, Black, Bold, FontFamily -> "Times", sz] &; rot = 60 Degree; ticks = st[12] /@ Table[10 i, {i, 0, 10}]; labels = {Rotate[Text[st[16]["Carbs"], {1.5, 5}], rot], Text[st[16]["Fats"], {5, -1}], Rotate[Text[st[16]["Protein"], {8.5, 5}], -rot]}; mkTicks[ind_, ang_, off_] := Table[ Rotate[Text[If[ind == 2, Reverse[ticks], ticks][[i]], ptsG[[ind, i]] + off], ang], {i, Length[ticks]}] 

As you can see, my sample data is shown, with the set of three numbers being my percentage of each nutrient (in the order Protein, Fat, Carbohydrate) 1)How do I let Mathematica know which number is which?

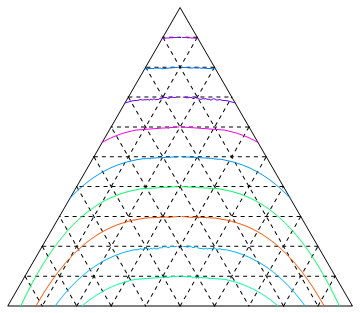
The only other thing was about the colour... If you look at the second picture - how can I tell Mathematica to assign a colour to different sleeping hours (a fourth value not included in the picture) with the following divisions:

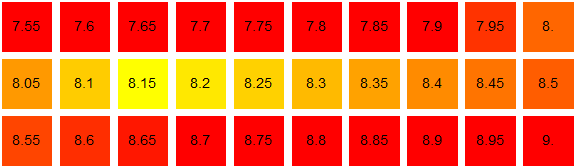
7.9 = red, 8.15 being blue and 8.7 being red, with the in-between values a proportional blend of these three?

I think I want something like this:

Graphics[{Point /@ pts, labels, Line /@ lines, mkTicks[1, rot, {1/4, 1/4}], mkTicks[2, 0, {-2/5, 0}], mkTicks[3, -rot, {1/5,-1/3}], Opacity[0.25], {FaceForm@Blend[{Red, Blue,Green}, #[[-1]]], Disk[#[[1]], 0.2]} & /@ dataPts}] 

But the code above is for the following divisions: red is for 0, blue is for 1/2 and green is for 1

Many many thanks for ALL help! I am eternally grateful

$\endgroup$
2
  • $\begingroup$ Editing - many thanks @HighPerformanceMark $\endgroup$ Commented Jun 2, 2020 at 11:44
  • $\begingroup$ can you add the missing fourth column values in data? $\endgroup$ Commented Jun 7, 2020 at 9:30

2 Answers 2

2
$\begingroup$

Your concept works nice:

Graphics[{Point /@ pts, labels, Line /@ lines, mkTicks[1, rot, {1/4, 1/4}], mkTicks[2, 0, {-2/5, 0}], mkTicks[3, -rot, {1/5, -1/3}], Opacity[0.25]}] 

2d graphics mix plot

The rest is a big misconeption.

a) This is 2D-Graphics. b) Disk is a 2D-Graphics-built-in: Disk[{x,y},r] c) x and y are the only coordinates in contrast to the three coordinates in dataPts. d) FaceForm is not needed to color a Disk. e) Blend suffices for coloring. f) The set of data in dataPts appear inconsistent for purposes. g) The is no clue which of the coordinate are targeted for coloring.

A functioning example without map:

Graphics[{Point /@ pts, labels, Line /@ lines, mkTicks[1, rot, {1/4, 1/4}], mkTicks[2, 0, {-2/5, 0}], mkTicks[3, -rot, {1/5, -1/3}], Opacity[0.25], {Blend[{{7.9, Blue}, {8.15, Yellow}, {8.7, Red}}, 7], Disk[{2, 1.7}, 0.3], Blend[{{3.9, Blue}, {7.15, Yellow}, {8.7, Red}}, 8], Disk[{6, 5.2}, 0.3], Blend[{{7.9, Blue}, {8.15, Yellow}, {4.7, Red}}, 7], Disk[{4, 3.5}, 0.3]}}] 

2d graphics mix plot

a) The 3D coordinates have to be mapped appropriately into the mixing triangle. b) The coloring has to set accordingly.

Have a look at stackexchange.com with the search feature and select your best fit for the mixing graphics from the existing examples in the question.

Have a look at:

how-to-plot-ternary-density-plots how-can-i-draw-ternary-plot-by-these-data how-to-conveniently-plot-3-category-dirichlet-data-in-equilateral-triangle-inste

constructing-a-ternary-histogram

how-to-plot-curves-in-ternary-plot-triangular-plot

 tercp[cp_Graphics] := Quiet@Cases[ Normal@First@Cases[cp, _GraphicsComplex, Infinity] , Line[x_] :> Line[{ 1 - #[[1]] + #[[2]], Sqrt[3] (1 - #[[1]] - #[[2]])}/2 & /@ Select[x, Total[#] <= 1 &] ], Infinity] Graphics[{Line[{{0, 0}, {1, 0}, {1/2, Sqrt[3]/2}, {0, 0}}], {Dashed, Table[ tercp [ ContourPlot[(1 - b - a) == ci , {a, 0, 1}, {b, 0, 1}] ],{ci, .1, .9, .1}], Table[tercp [ ContourPlot[a == ci , {a, 0, 1}, {b, 0, 1}] ], {ci, .1, .9, .1}], Table[ tercp [ ContourPlot[b == ci , {a, 0, 1}, {b, 0, 1}] ] , {ci, .1, .9, .1}]}, Table[ {Hue[RandomReal[]], tercp [ ContourPlot[Abs[b - a] == (sig - 2 (1 - b - a) + 1)^.35, {a, 0, 1}, {b, 0, 1}] ] }, {sig, -1, 1, .2}]}] 

2d graphics plot ternary mixing

$\endgroup$
0
$\begingroup$

Use the form Blend[{{x1, color1}, {x2, color2}, {x3, color3},...}, x] to get colori when x == xi:

blend = Blend[{{7.9, Red}, {8.15, Yellow}, {8.7, Red}}, #] &; GraphicsGrid[Partition[ Table[Graphics[{blend[x], Rectangle[], Black, Text[Style[x, 14], {1, 1}/2]}], {x, 7.55, 9, .05}], 10]] 

enter image description here

$\endgroup$
1
  • $\begingroup$ Thanks - but I did want it in a ternary plot - I have done that above - could I combine the two? $\endgroup$ Commented Jun 2, 2020 at 16:08

Start asking to get answers

Find the answer to your question by asking.

Ask question

Explore related questions

See similar questions with these tags.