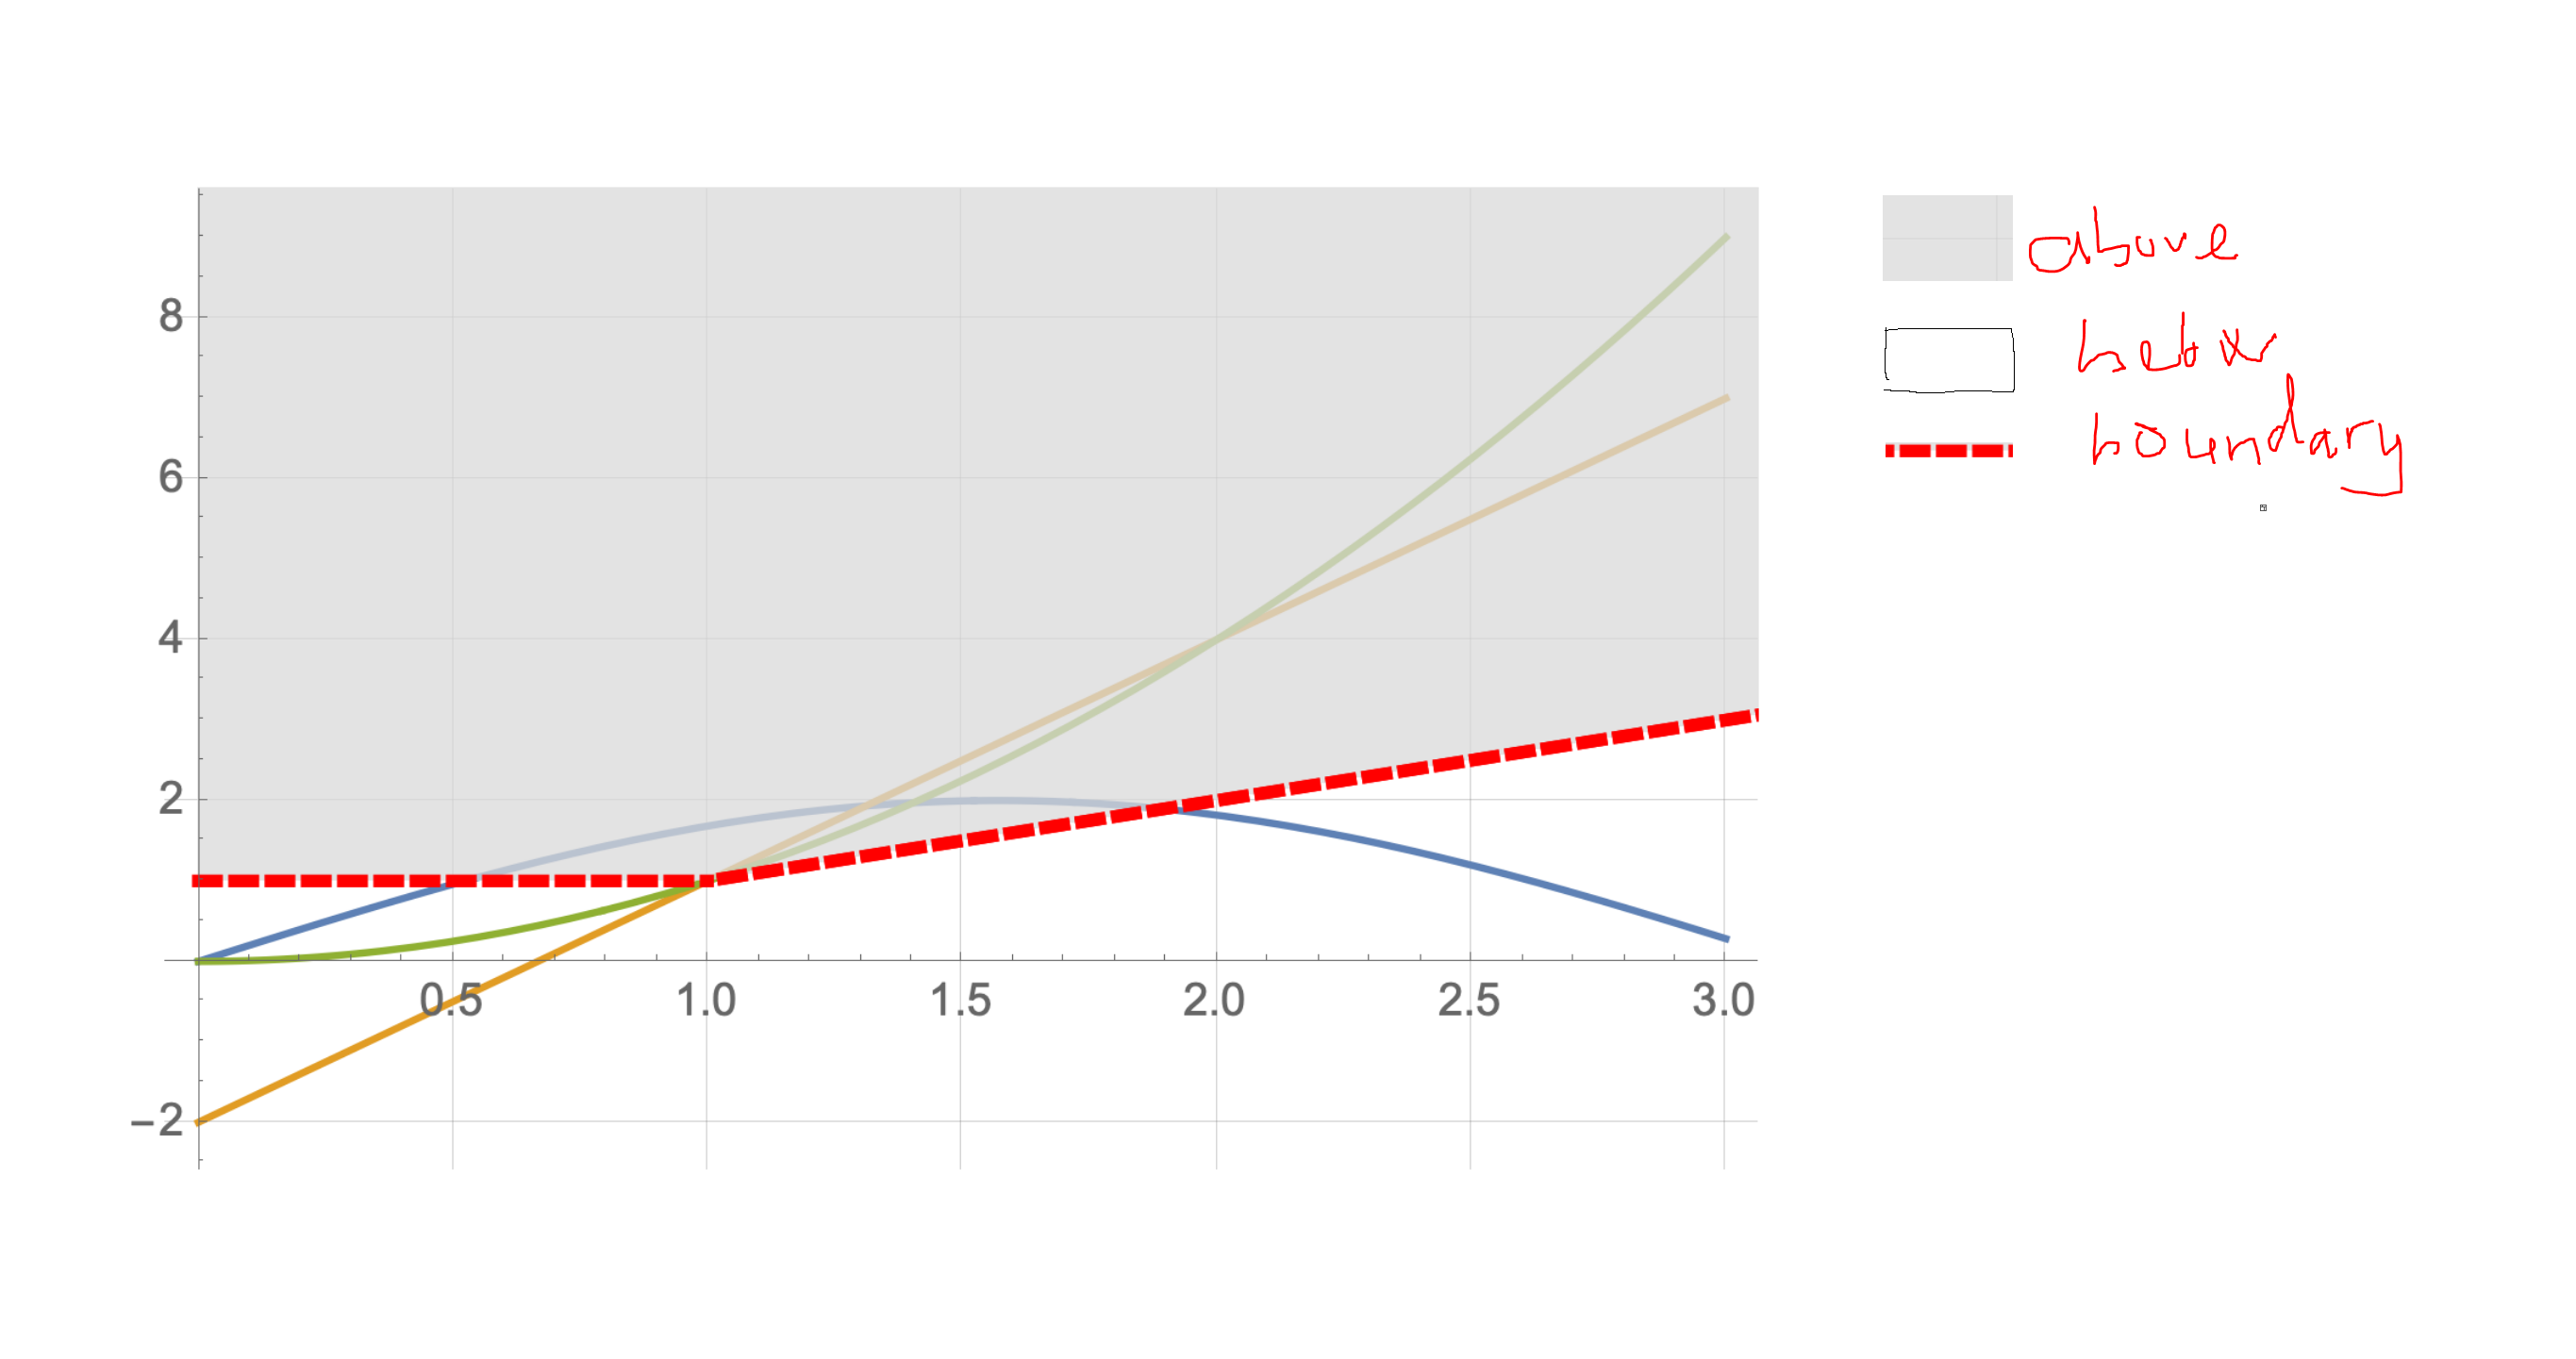
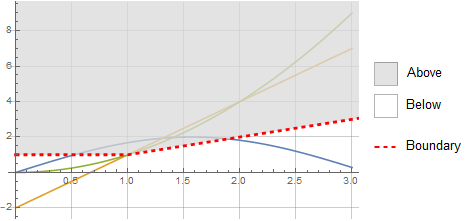
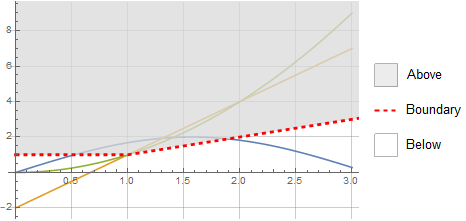
Legended[Show[ Plot[{2 Sin[x], 3 x - 2, x^2}, {x, 0, 3}, GridLines -> Automatic], ListLinePlot[{{0, 1}, {1, 1}, {10, 10}}, PlotStyle -> Directive[Red, Dashed, Thickness[0.008]], Filling -> Top, FillingStyle -> Opacity[0.75, LightGray]]], Placed[Column@{SwatchLegend[{Opacity[.5, LightGray], White}, {"Above", "Below"}, LegendMarkerSize -> 25], LineLegend[{Directive[Thick, Dashed, Red]}, {"Boundary"}, LegendMarkerSize -> 25]}, Right]]
Alternatively, use LineLegend with the (undocumented) option "LegendItem" to inject desired glyphs as legend icons:
linelegend = LineLegend[{Opacity[.5, LightGray], Directive[Red, Thick, Dashed], White}, {"Above", "Boundary", "Below"}, "LegendItem" -> {"Square", Automatic, "Square"}, LegendMarkerSize -> 25]
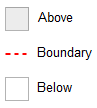
and use linelegend as the setting for PlotLegends in any of the plots in Show:
Show[Plot[{2 Sin[x], 3 x - 2, x^2}, {x, 0, 3}, GridLines -> Automatic, PlotLegends -> linelegend], ListLinePlot[{{0, 1}, {1, 1}, {10, 10}}, PlotStyle -> Directive[Red, Dashed, Thickness[0.008]], Filling -> Top, FillingStyle -> Opacity[0.75, LightGray]]]
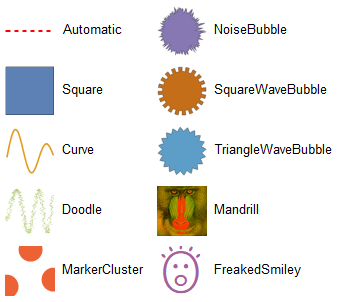
The second approach is quite convenient for using arbitrary graphics objects/images as legend icons, including several built-in objects (like "Square", "Curve", "Doodle" and "MarkerCluster") and built-in ChartElementData objects (like, for instance, "TriangleWaveBubble", "NoiseBubble", "SquareWaveBubble", etc.):
styles = Prepend[Directive[Red, Thick, Dashed]]@(ColorData[97] /@ Range[9]); labels = {"Automatic", "Square", "Curve", "Doodle", "MarkerCluster", "NoiseBubble", "SquareWaveBubble", "TriangleWaveBubble", "Mandrill", "FreakedSmiley"}; legenditems = {Automatic, "Square", "Curve", "Doodle", "MarkerCluster", ChartElementData["NoiseBubble"], ChartElementData["SquareWaveBubble"], ChartElementData["TriangleWaveBubble"], ImageMultiply[ExampleData[{"TestImage", "Mandrill"}], ColorData[97]@8], Graphics[{ColorData[97]@9, Text@Style["\[FreakedSmiley]", 62]}]}; LineLegend[styles, labels, "LegendItem" -> legenditems, LegendMarkerSize -> 50, LegendLayout -> {"Column", 2}]