One of the fun tricks known to Mathematica users is that the default colors for Mathematica plots (as of v12) can be accessed by the ColorData[97] color scheme. So ColorData[97][1] is a light blue, ColorData[97][2] is an orange-yellow, etc. I have found this immensely useful when creating separate plots and then combining them into a single graphic.
ListPlot uses this same color scheme but also has a set of different shapes it uses for each data series, as seen below:
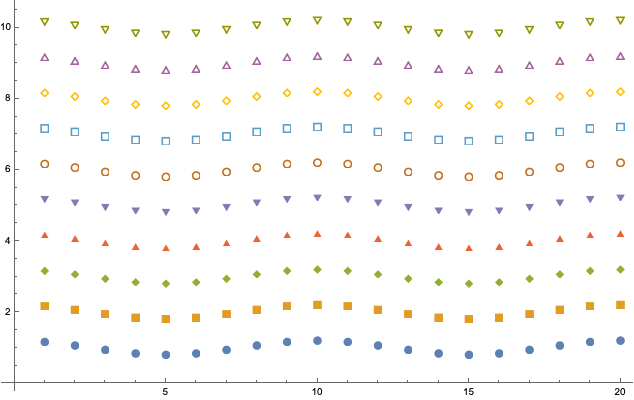
Is there a function similar to ColorData[97] that can be called to yield a filled circle given an argument of 1, a filled square given an argument of 2, a filled diamond given an argument of 3, and so forth?
System`Private`$PlotMarkersalready? $\endgroup$Graphicsversion:Charting`CommonDump`GraphicsPlotMarkers[]. $\endgroup$