1
$\begingroup$

I have an x-y data list. The data is here. It looks like below: enter image description here

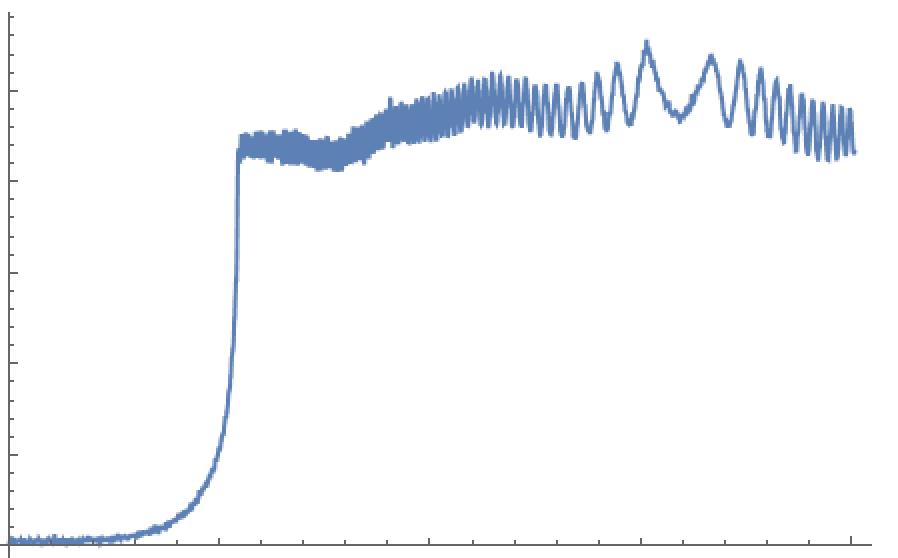
I want to mark the knee location. I mean I need to find the point of greatest slope change and get the x coordinate of this point. Theoretically, this position is around x=29.2519.

I tried SavitzkyGolayMatrix method and get the below result (x=29.4461). This result is a little deviation from the theoretical result x=29.2519. enter image description here

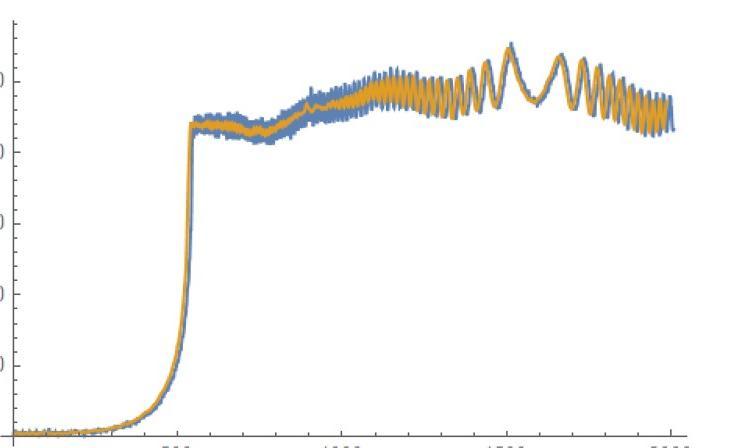
I read some literature. Find them with a method: a least squares fit method, find the knee by intersecting two straight lines. And they show the below similar pictures: enter image description here

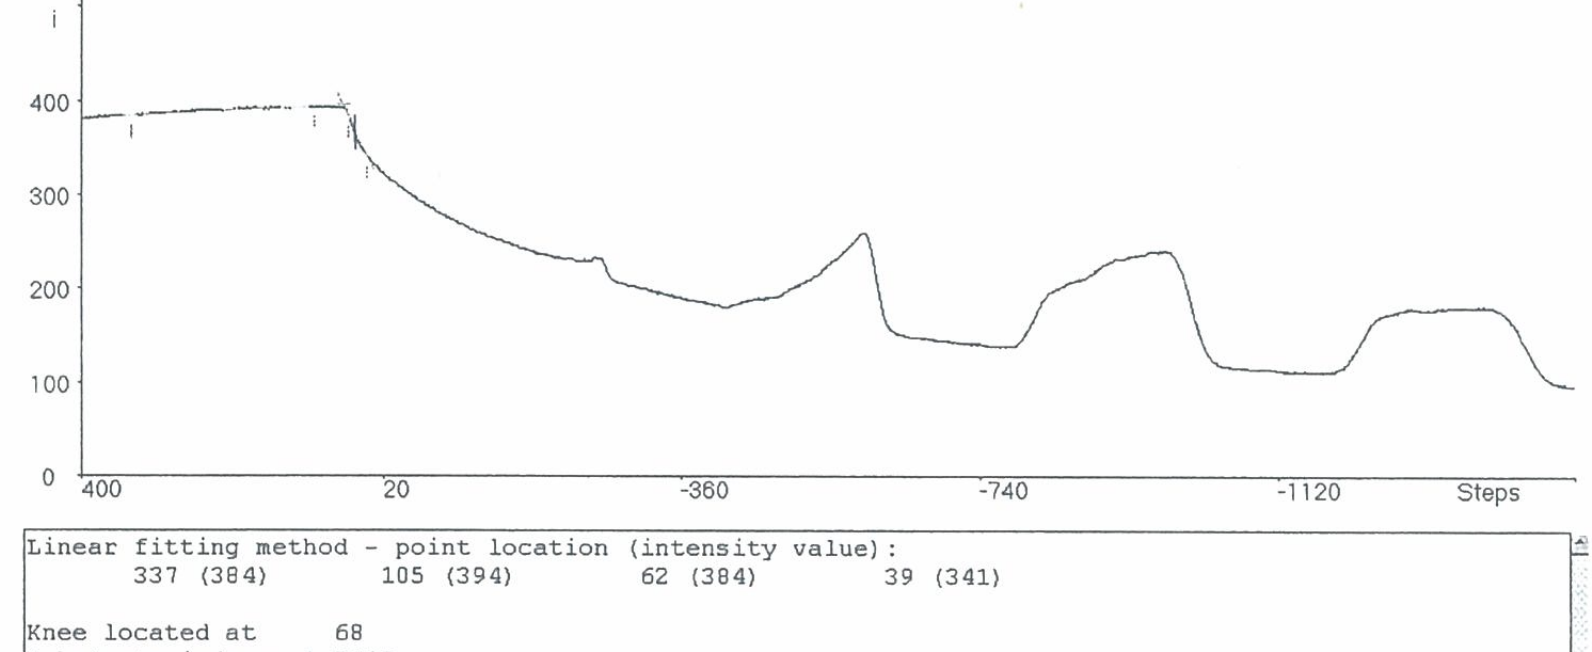
Can someone tell me how to implement this method? Thank you!

$\endgroup$
4
  • 1
    $\begingroup$ Ummm... what's the "SG" method? $\endgroup$ Commented Aug 29, 2023 at 5:00
  • $\begingroup$ A result of x=29.4461 seems o.k. considering the noise. $\endgroup$ Commented Aug 29, 2023 at 10:05
  • $\begingroup$ I'm confused. The plots show such a big range that the presumed knee at around x=29 isn't visible. If you expect it to be there, why not restrict the data range up to, e.g., x=50? $\endgroup$ Commented Aug 29, 2023 at 10:54
  • $\begingroup$ I faced a similar problem when computing the knee of viscoelastic curves. I managed to implement a robust method in the WL. The basic steps were: (1) Rescale the curve so that $x$ and $y$ are in $[0,1]$. (2) Rotate the coordinate system counterclockwise by 45 deg and calculate the rescaled coordinates of the points. (3) Calculate the 1st derivative using the SavitzkyGolayMatrix. (4) The zero point of the 1st derivative determines the knee. In my opinion, the position of the knee is a matter of consensus; it is important that the method produces consistent and robust results. $\endgroup$ Commented May 2 at 16:56

0

Start asking to get answers

Find the answer to your question by asking.

Ask question

Explore related questions

See similar questions with these tags.