7
$\begingroup$

I was experimenting with the code from this question when I ran into another problem with regions.

Ω = RegionDifference[Rectangle[{0, 0}, {10, 10}], Rectangle[{4, 4}, {8, 8}]]; RegionPlot[Ω] 

plot

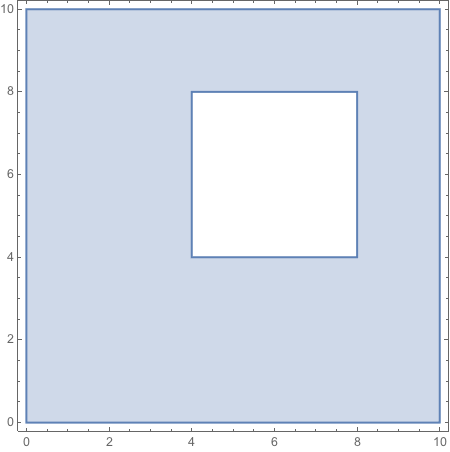
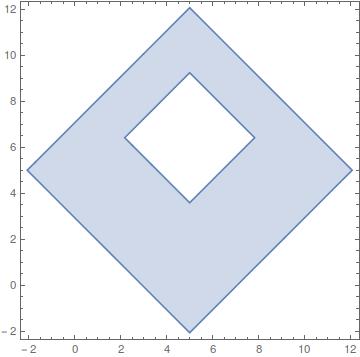
Ω1 = TransformedRegion[Ω, RotationTransform[45 °, {5, 5}]]; RegionQ[Ω1] 
True 
RegionPlot[Ω1] 

RegionPlot::invplotreg: TransformedRegion[RegionDifference[Rectangle[{0, 0}, {10, 10}], Rectangle[{4, 4}, {8, 8}]], TransformationFunction[...]] is not a valid region to plot. >>

What is the difference between a "valid region to plot" and a region that satisfies RegionQ? Or, perhaps, to put it better, am I seeing a bug in RegionPlot or just an incomplete implementation?

I note that

RegionPlot[TransformedRegion[Rectangle[], RotationTransform[45 °, {.5, .5}]], PlotRange -> All] 

works as expected, so it would seem RegionPlot can handle rotations for some class of inputs.

$\endgroup$
7
  • $\begingroup$ I can reproduce this. Might try tracing it some time later (for testing my tracer :) $\endgroup$ Commented Jul 19, 2014 at 12:27
  • 3
    $\begingroup$ For me even the first basic example in the TransformedRegion documentation doesn't work properly. And the second example hangs the kernel... $\endgroup$ Commented Jul 19, 2014 at 13:24
  • $\begingroup$ @SimonWoods For the first example, looks like it can use a PlotRange -> All. (+1) $\endgroup$ Commented Jul 19, 2014 at 16:47
  • 1
    $\begingroup$ @SimonWoods, if you could send this and your OS version to the support that would be useful to track it down. Thanks. I have filed fact that an expr with Head TransformedRegion does not work as a suggestion for improvement. $\endgroup$ Commented Jul 21, 2014 at 8:51
  • 1
    $\begingroup$ @user21. re: "an expr with Head TransformedRegion does not work." I don't think that is the issue since TransformedRegion[Rectangle[], RotationTransform[45 °, {.5, .5}]] has head TransformedRegion, but can be plotted by RegionPlot. $\endgroup$ Commented Jul 21, 2014 at 9:07

1 Answer 1

6
$\begingroup$

Here is a workaround:

r1 = RegionDifference[Rectangle[{0, 0}, {10, 10}], Rectangle[{4, 4}, {8, 8}]]; r2 = TransformedRegion[r1, RotationTransform[45 \[Degree], {5, 5}]]; mr = DiscretizeRegion[r2] 

enter image description here

And then:

RegionPlot[mr] 

enter image description here

$\endgroup$

Start asking to get answers

Find the answer to your question by asking.

Ask question

Explore related questions

See similar questions with these tags.