Here is what I get using my answer to I'd like to display field lines for a point charge in 3 dimensions. You only have to copy the definitions from the first code block in that answer, and then enter this:
seedList = With[{vertices = .1 N[PolyhedronData["Icosahedron"][[1, 1]]]}, Join[Map[{#, 2} &, vertices], Map[{# + {1, 1, 1}, -2} &, vertices]]]; Show[fieldLinePlot[{y + x, y z + x, z - x - y}, {x, y, z}, seedList, PlotStyle -> {Orange, Specularity[White, 16], Tube[.01]}, PlotRange -> All, Boxed -> False, Axes -> None], Background -> Black]
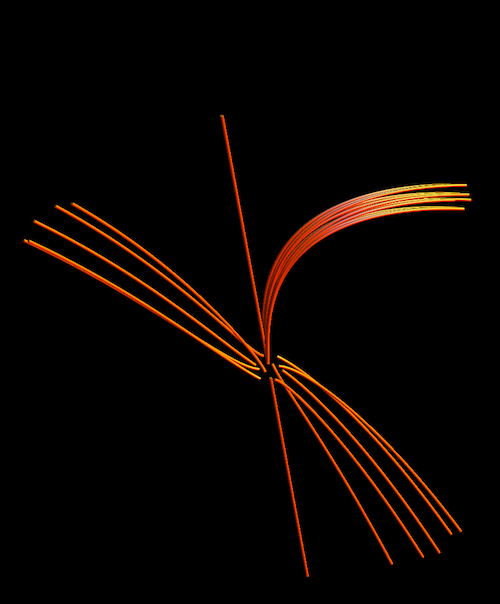
The seed points in seedList can be adjusted to highlight different features, if desired.