8

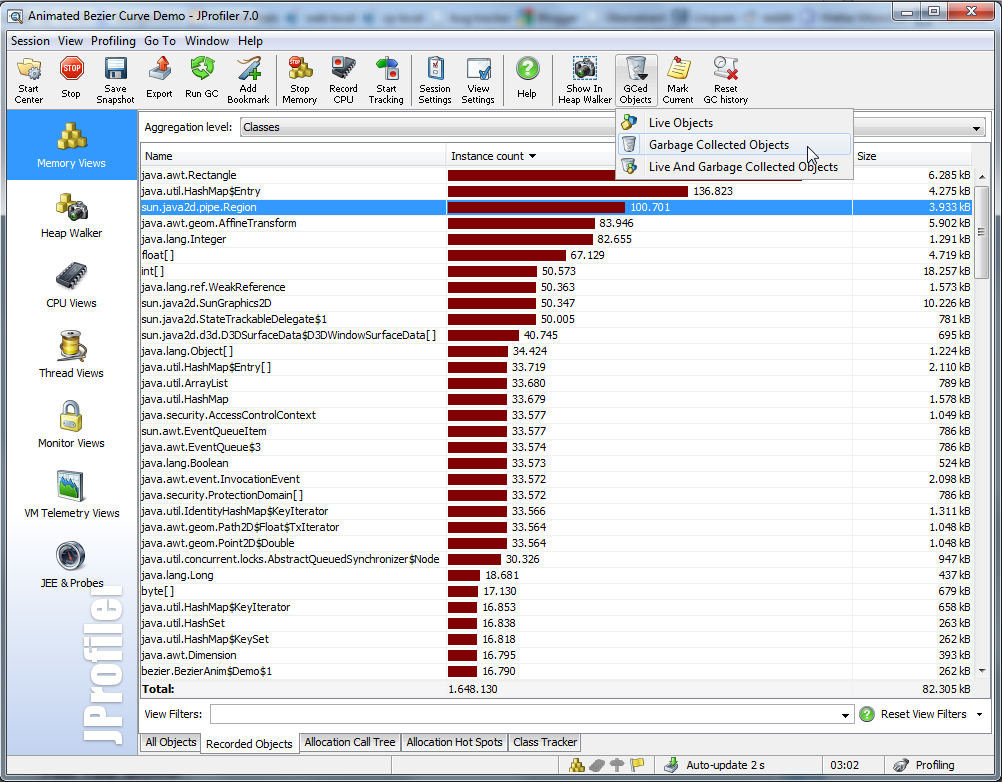
Please, is there any way how to get history of objects (their variable or at least class names) that have been garbage collected in Java?

Just adding these params (to Oracle JVM)

-verbose:gc -XX:+PrintGCDetails -XX:+PrintGCTimeStamps 

doesn't provide anything else memory in bytes. It's very limited help to me. Thanks for all responses.

Note: Workaround with add finilize() method is not unfortunatelly an option for me (I don't have an access to it).

5 Answers 5

6

You can use the finalize method from Object. This method is called when the object is about to be GCed. From here, you can log the information you need.

Sign up to request clarification or add additional context in comments.

Comments

4

Disclaimer: My company develops the tool that I recommend in this answer.

In JProfiler you can go to the "Recorded objects" view in the memory section and switch the liveness mode to garbage collected objects (View->Change Liveness Mode->Garbage Collected Objects). You will then see a statistics of objects that have been GCed.

enter image description here

5 Comments

Thanks. JProfiler looks awesome but 450€ is too very expensive
Is there any way to list down the classes programmatically? I was going through the java.lang.Management package but it can return count only.
You mean in JProfiler or in a JDK MBean?
How do I record memory from JVM start? - The UI forces me to click on a button - but my program runs only for 5 seconds
@Hurda In the dialog that is shown when you start a profiling session, you can configure an initial recording profile.
0

Are you searching for a memory leak?

If you implement finalize() method (available in every Object) it will get called just before the object is being garbage collected - and you can run any code inside it.

If you are looking for a systematic solution (or you don't have access to classes you want to monitor), I am not aware of any JVM option that allows that. However you can log classes being loaded and unloaded (GCed), but this is not what you are asking.

Comments

0

Weak references or phantom references seem to be useful to log when the object actually gets removed. In this article the technology is explained.

Comments

-2

There is a nice built-in tool in JDK for observing jvm in runtime. It is jvisualvm. There is a a good reference with screenshots: http://visualvm.java.net/description.html

Here is one of them : enter image description here

Hope that helps.

3 Comments

jprofiler is a very powerful and common used tool but it is free only for opensource and the standard license for single instance costs real money - $500. It might be a problem for some projects.
I know and using VisualVM but it doesn't support to see garbage collected objects.
That is a useful tool, but it doesn't answer this particular need.

Start asking to get answers

Find the answer to your question by asking.

Ask question

Explore related questions

See similar questions with these tags.