Download as ODP, PPTX


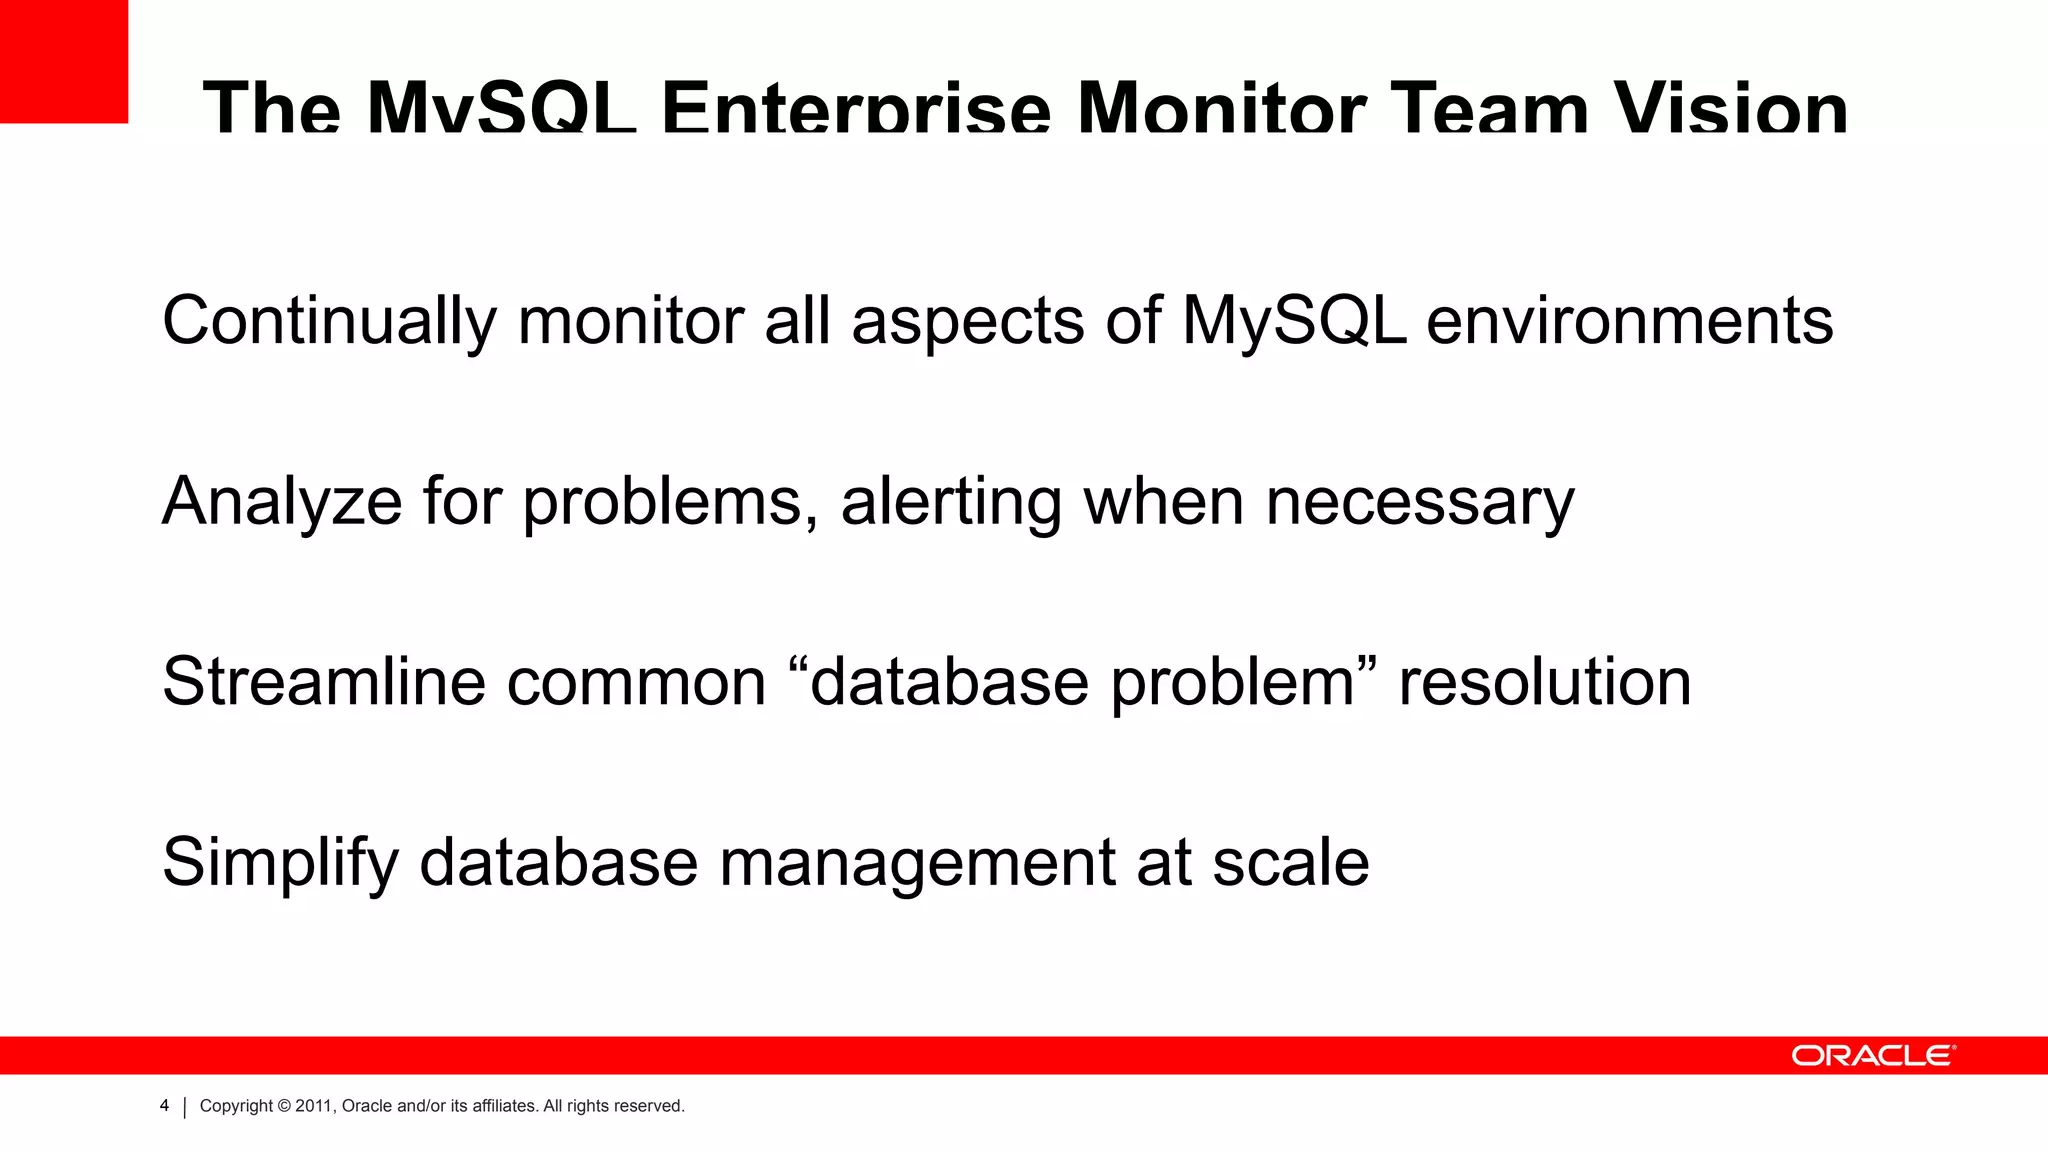
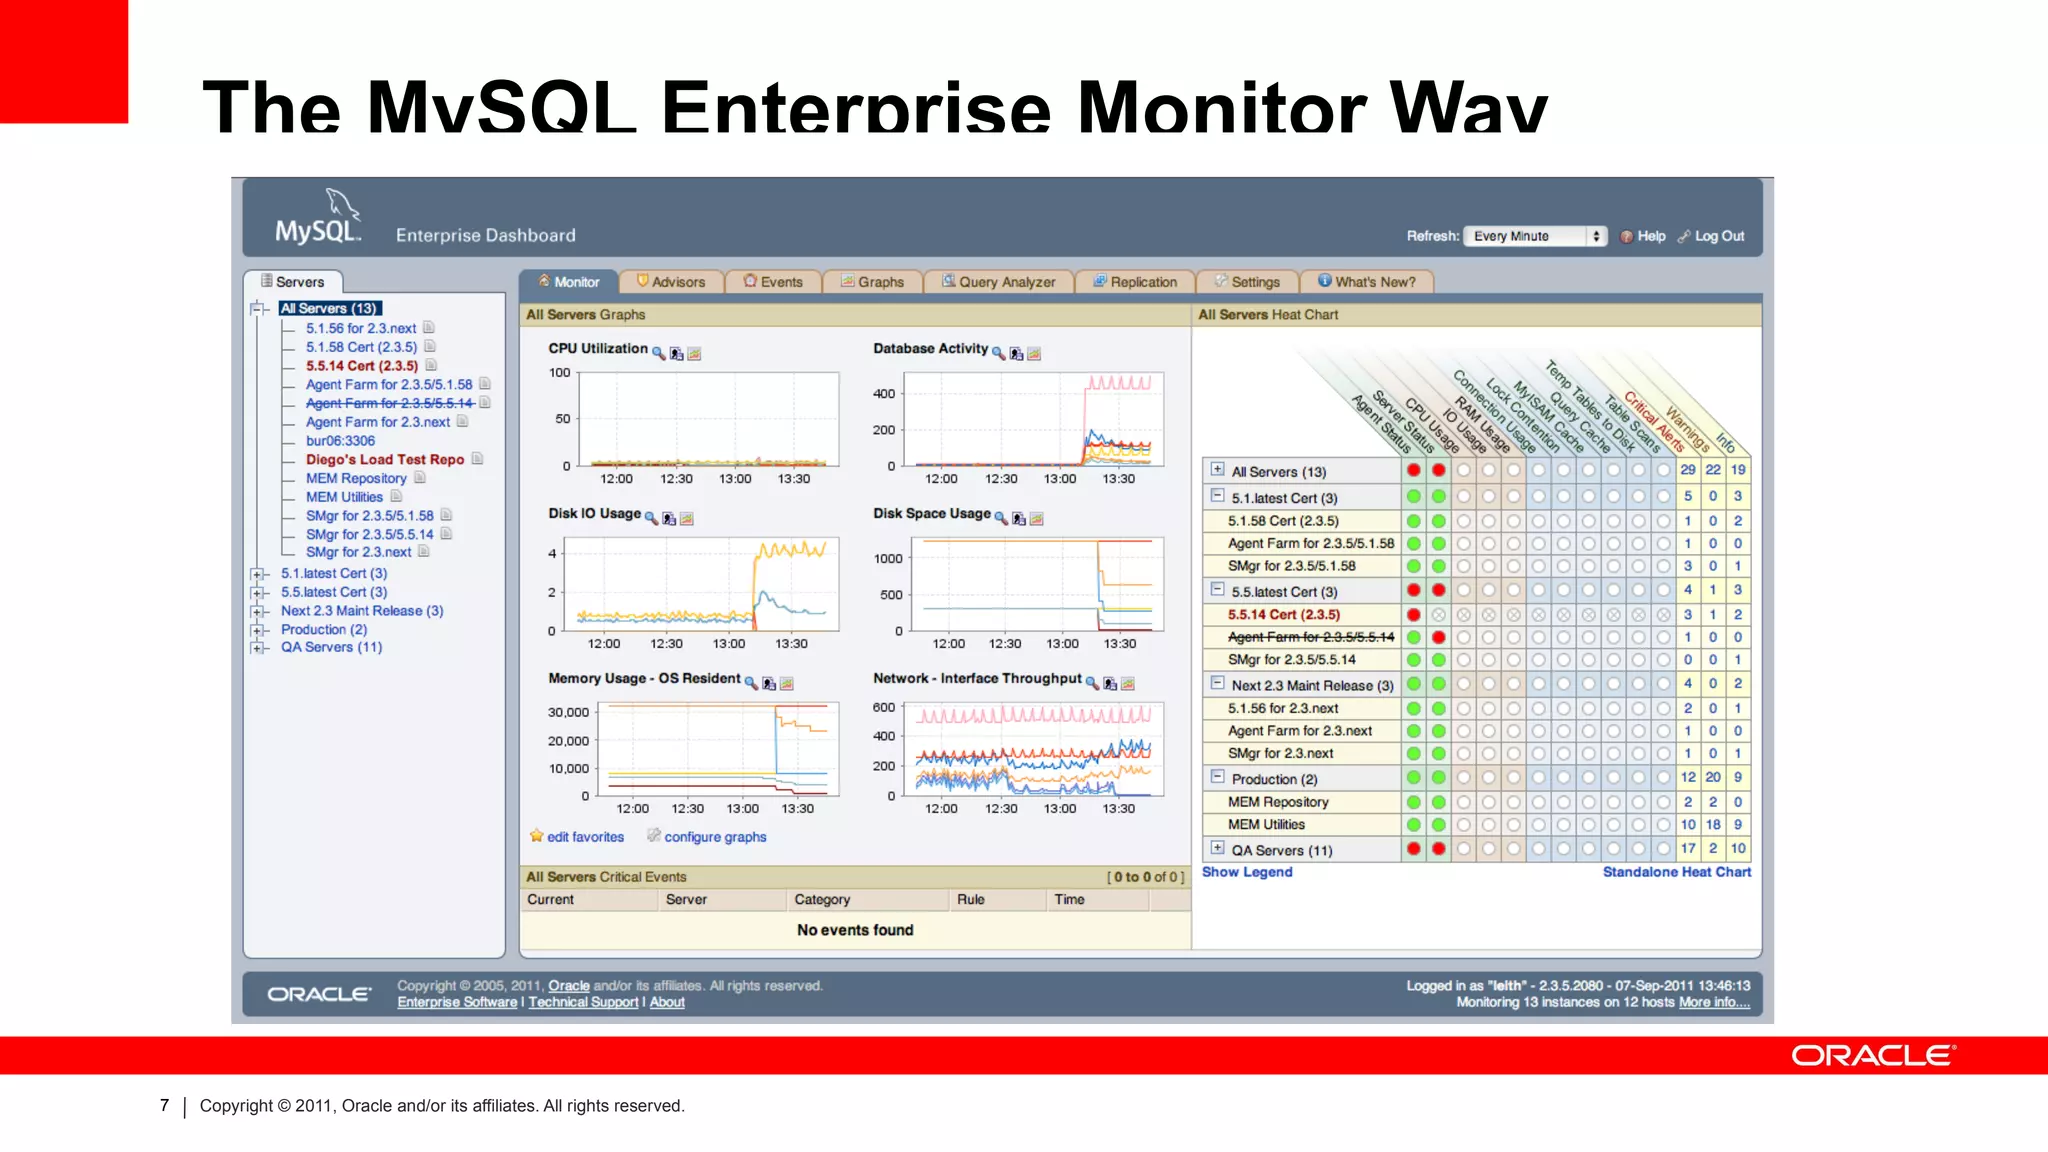
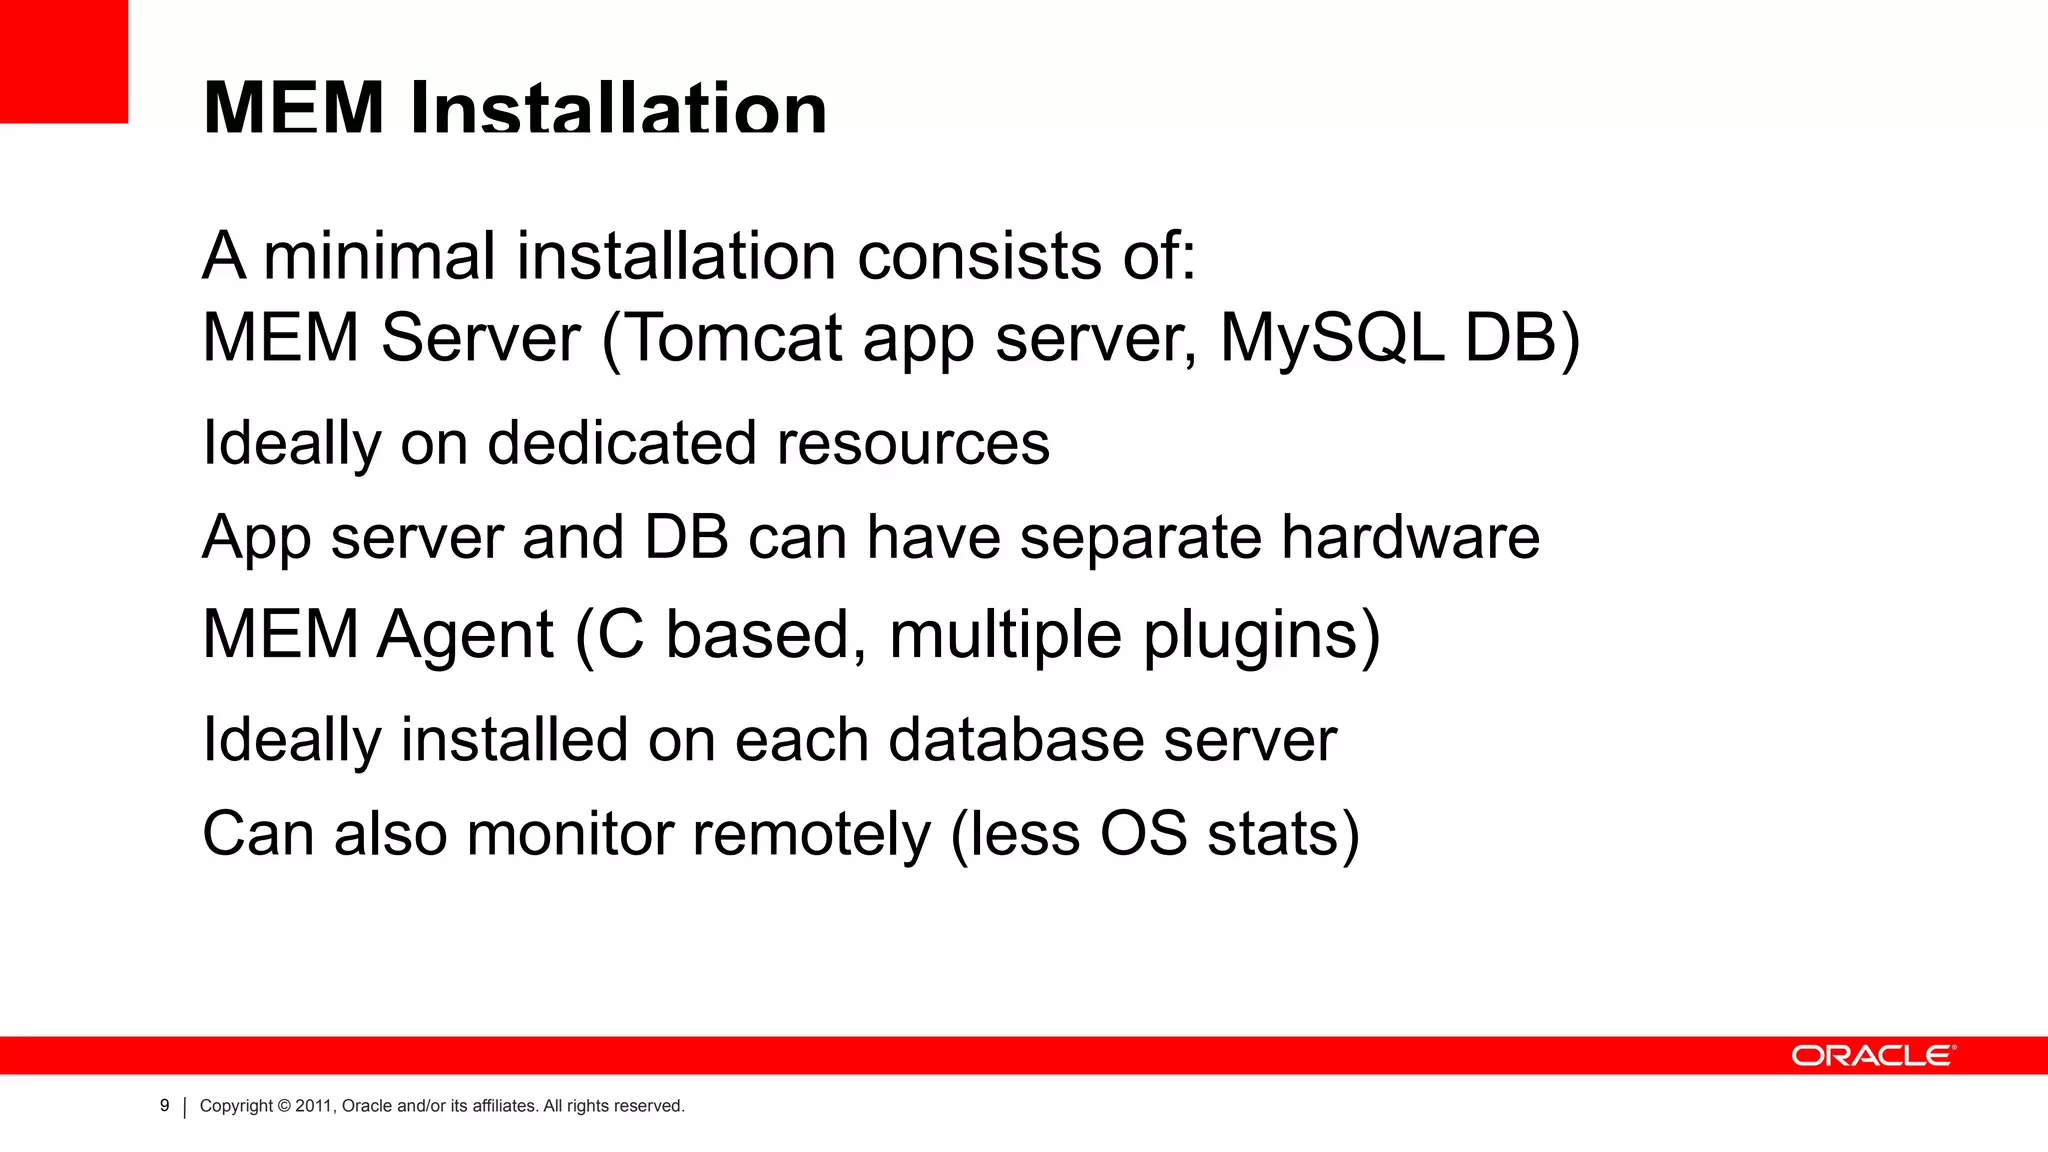
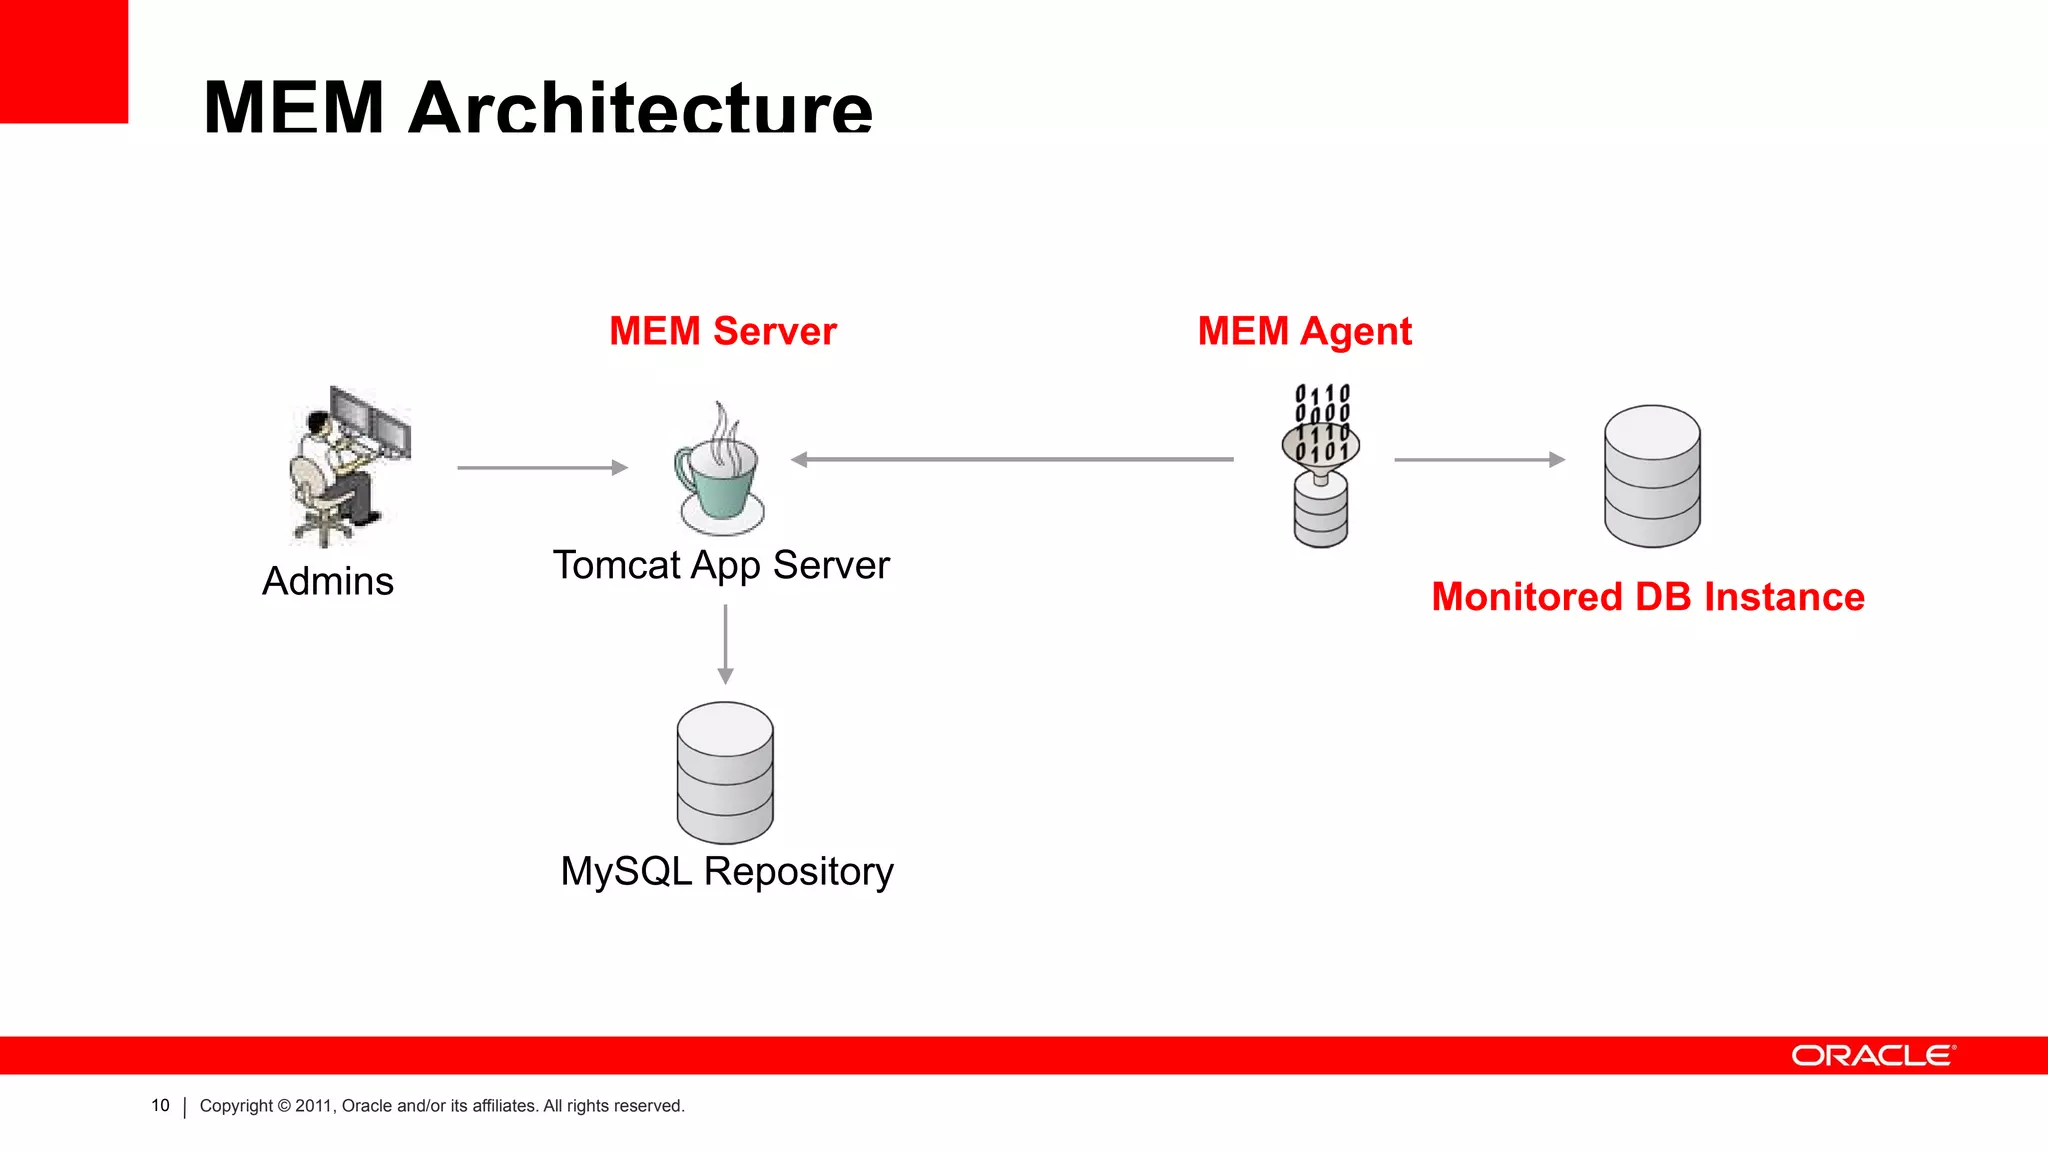
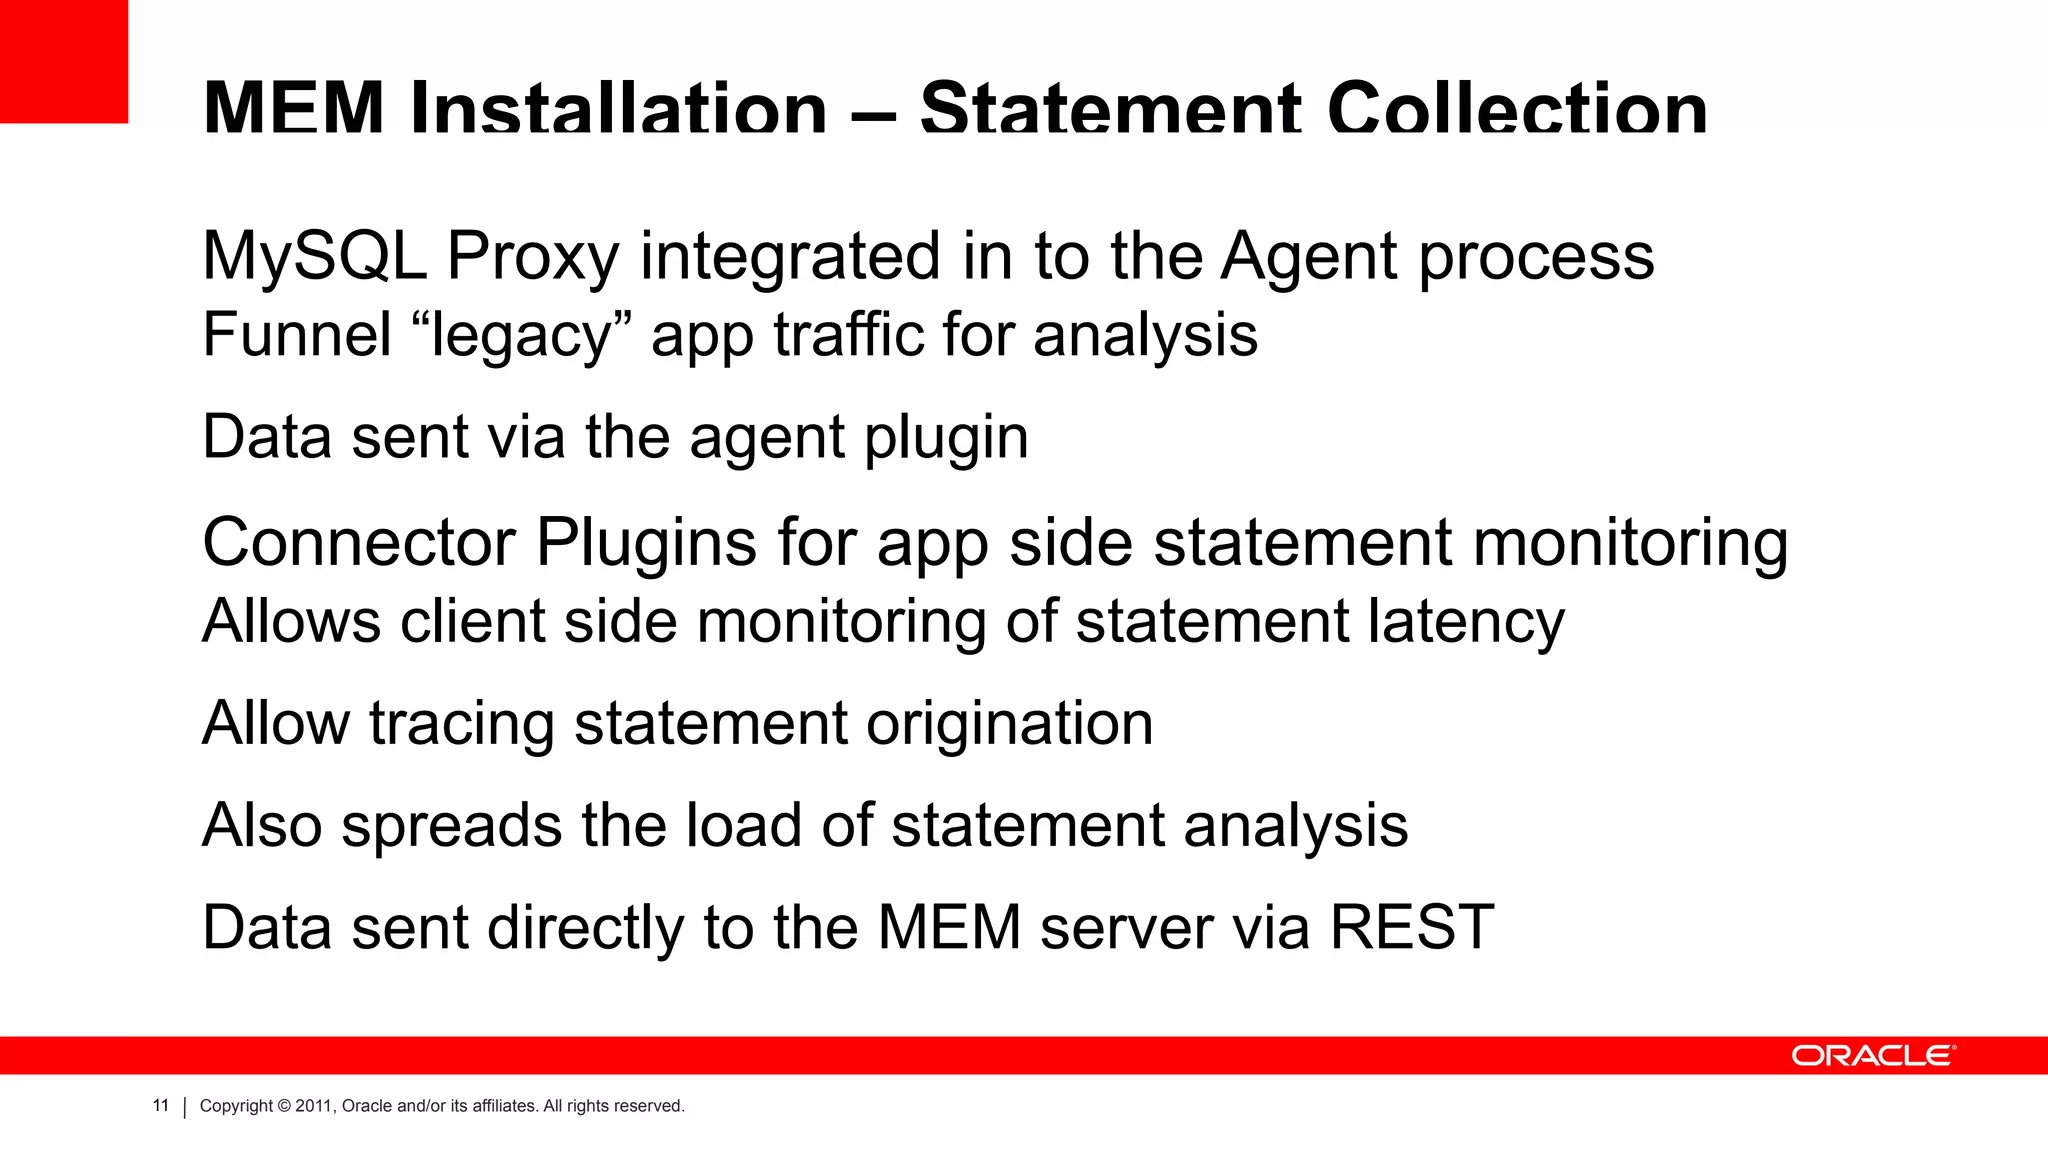
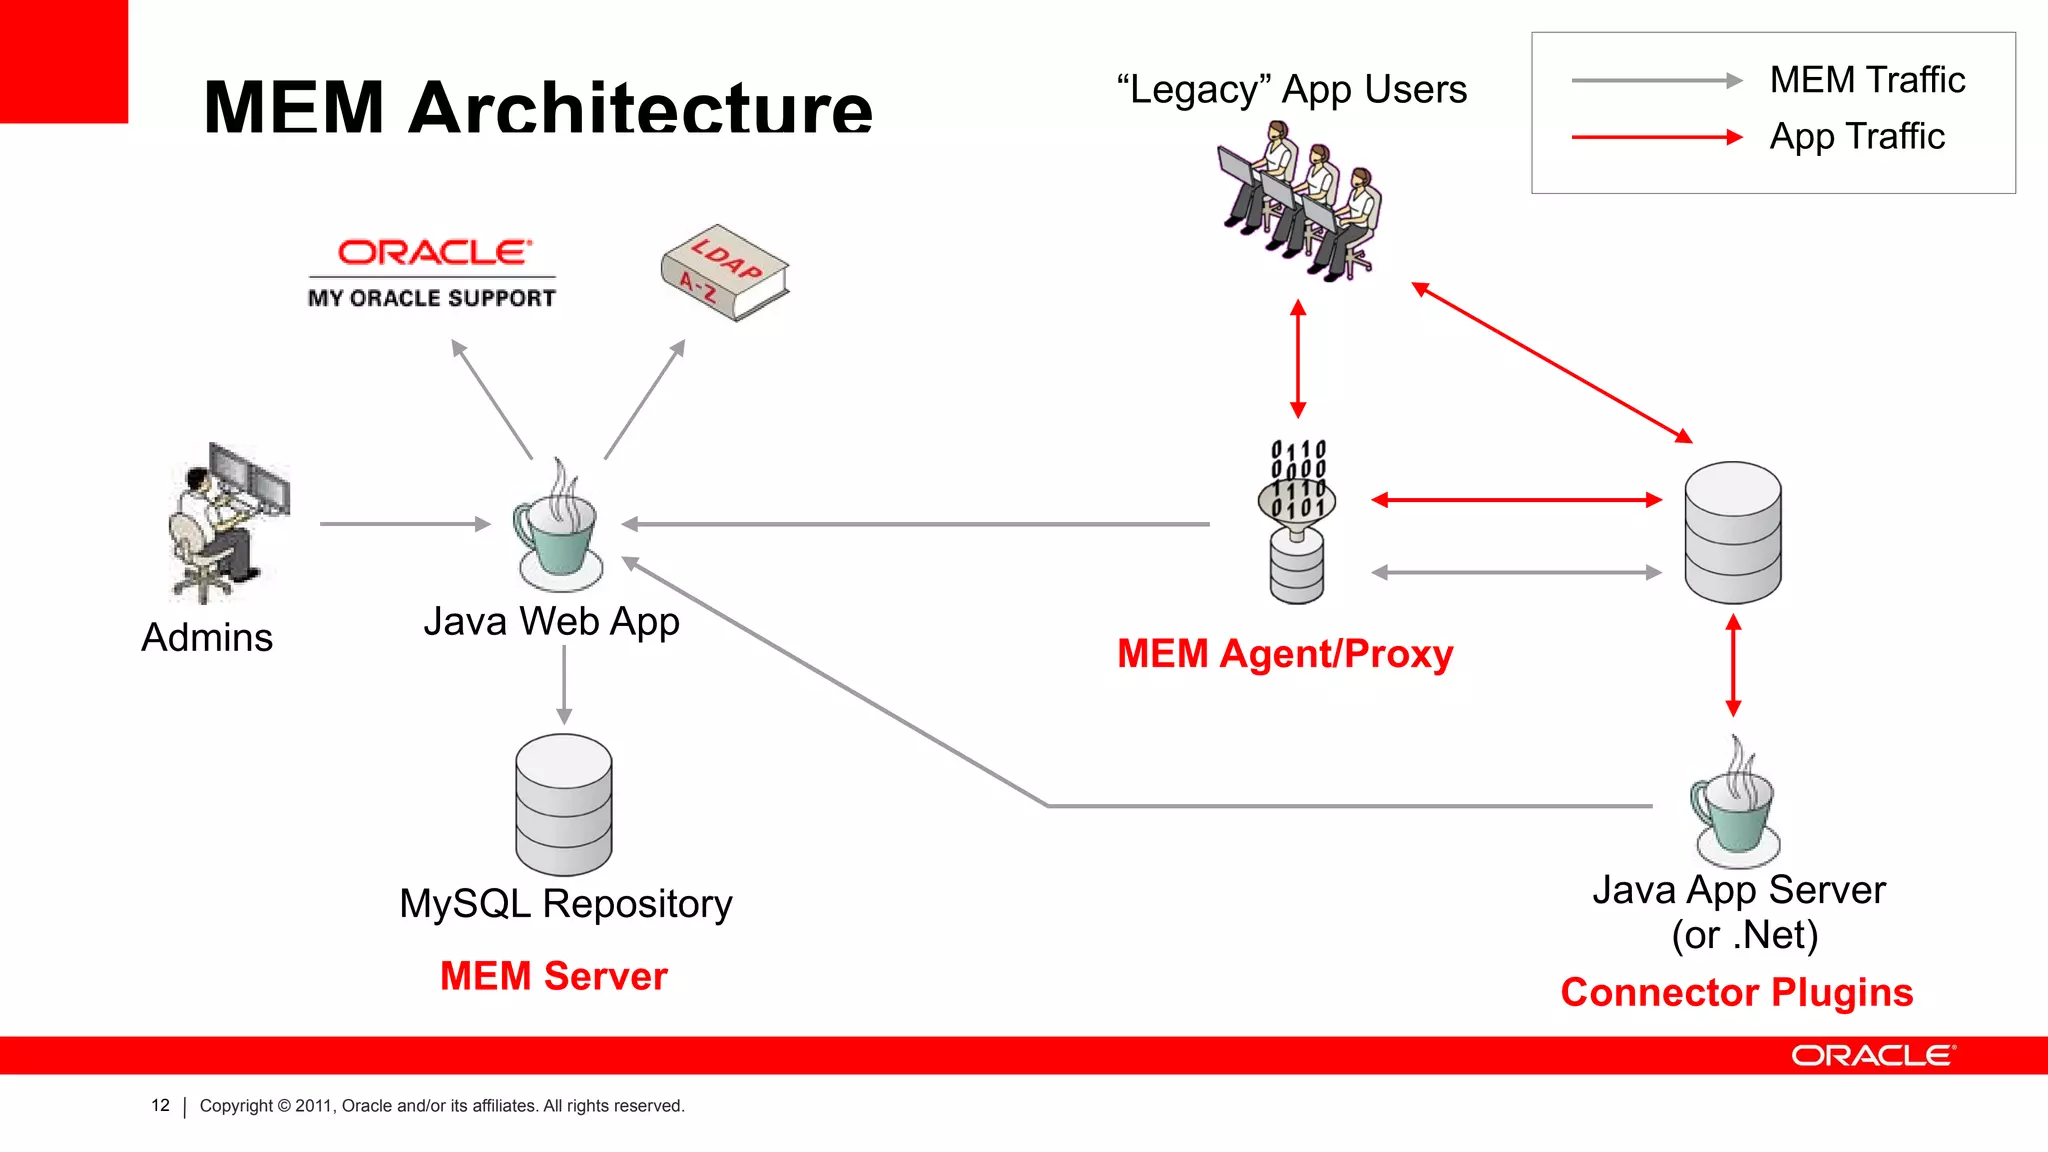
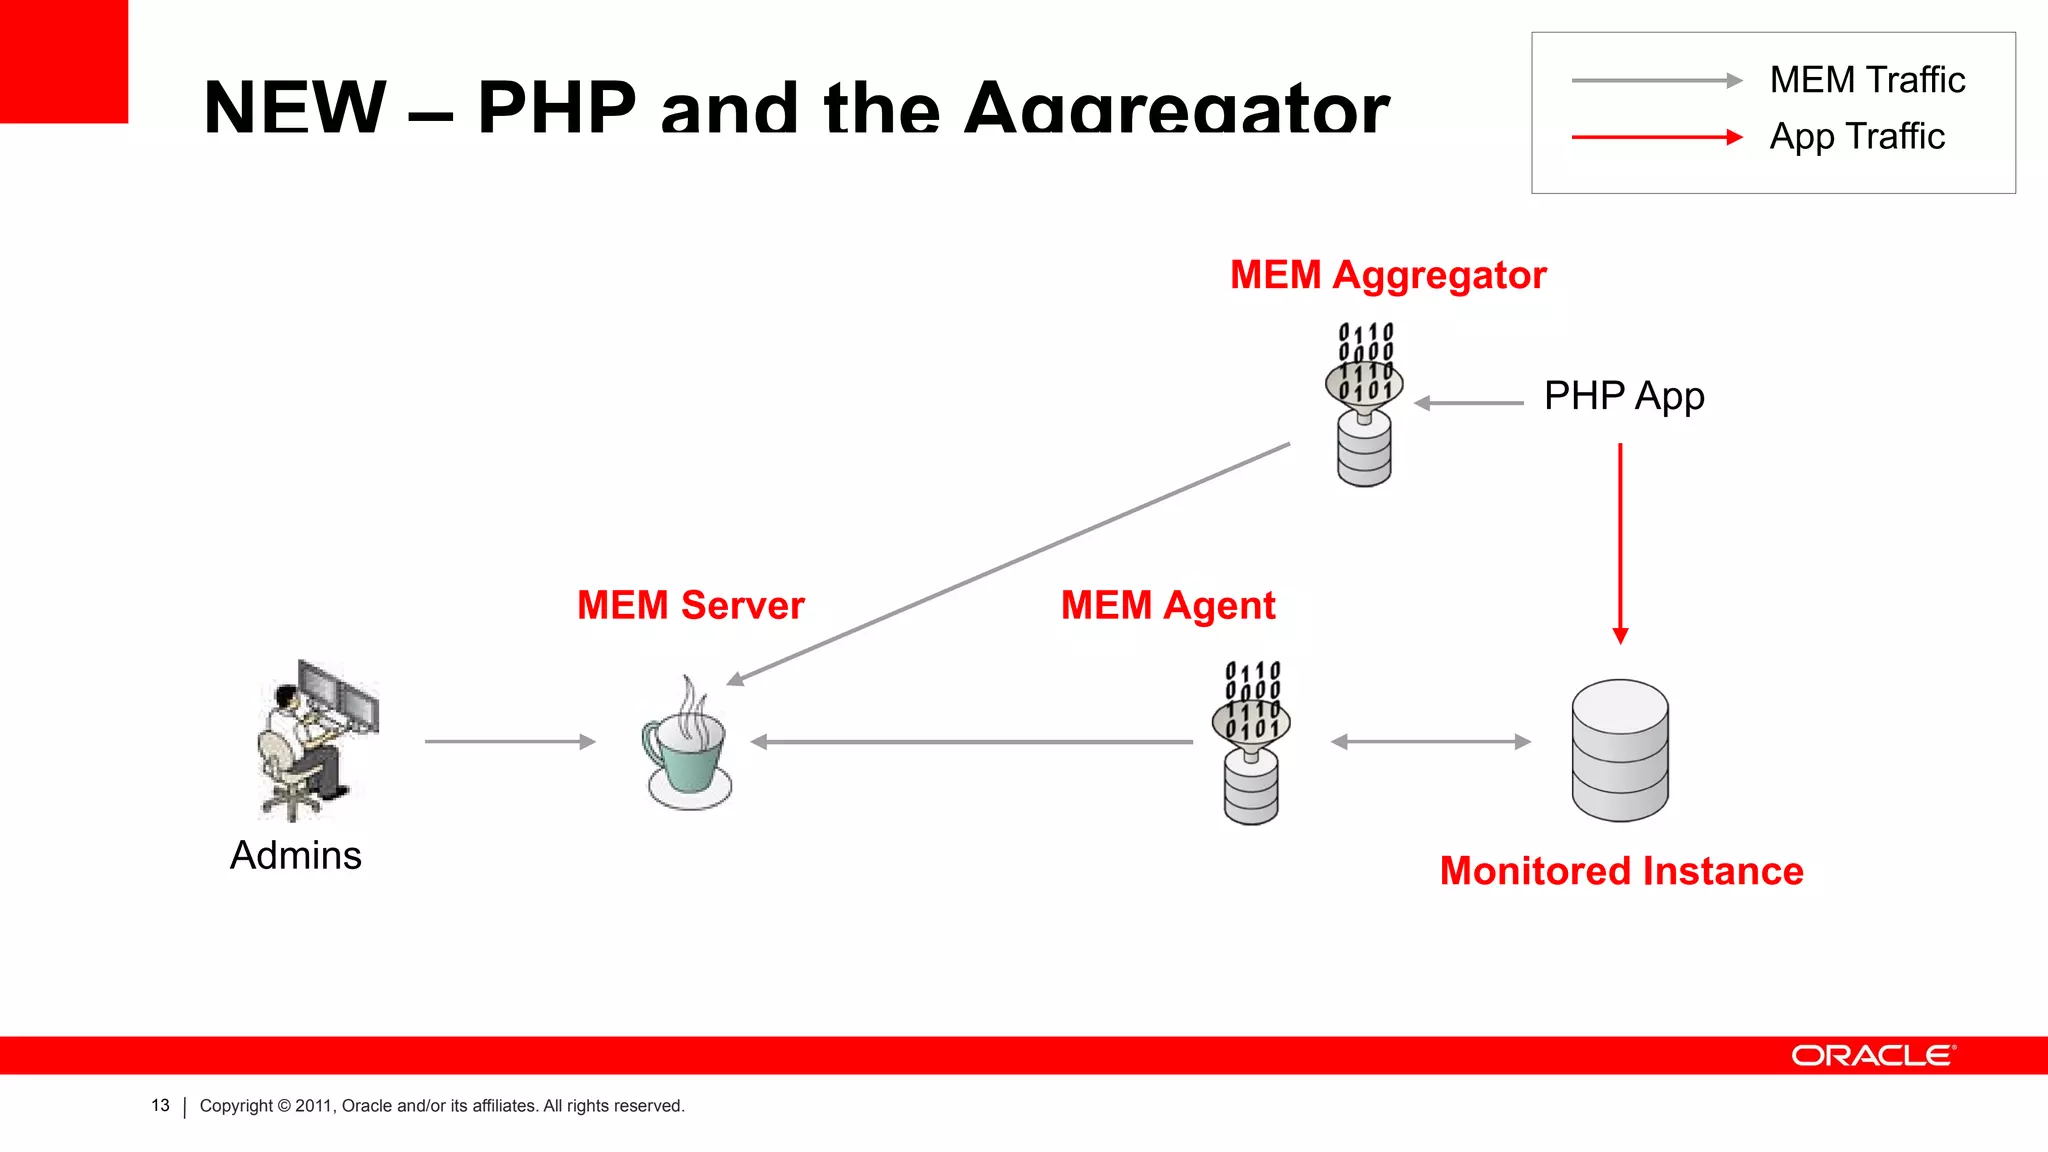
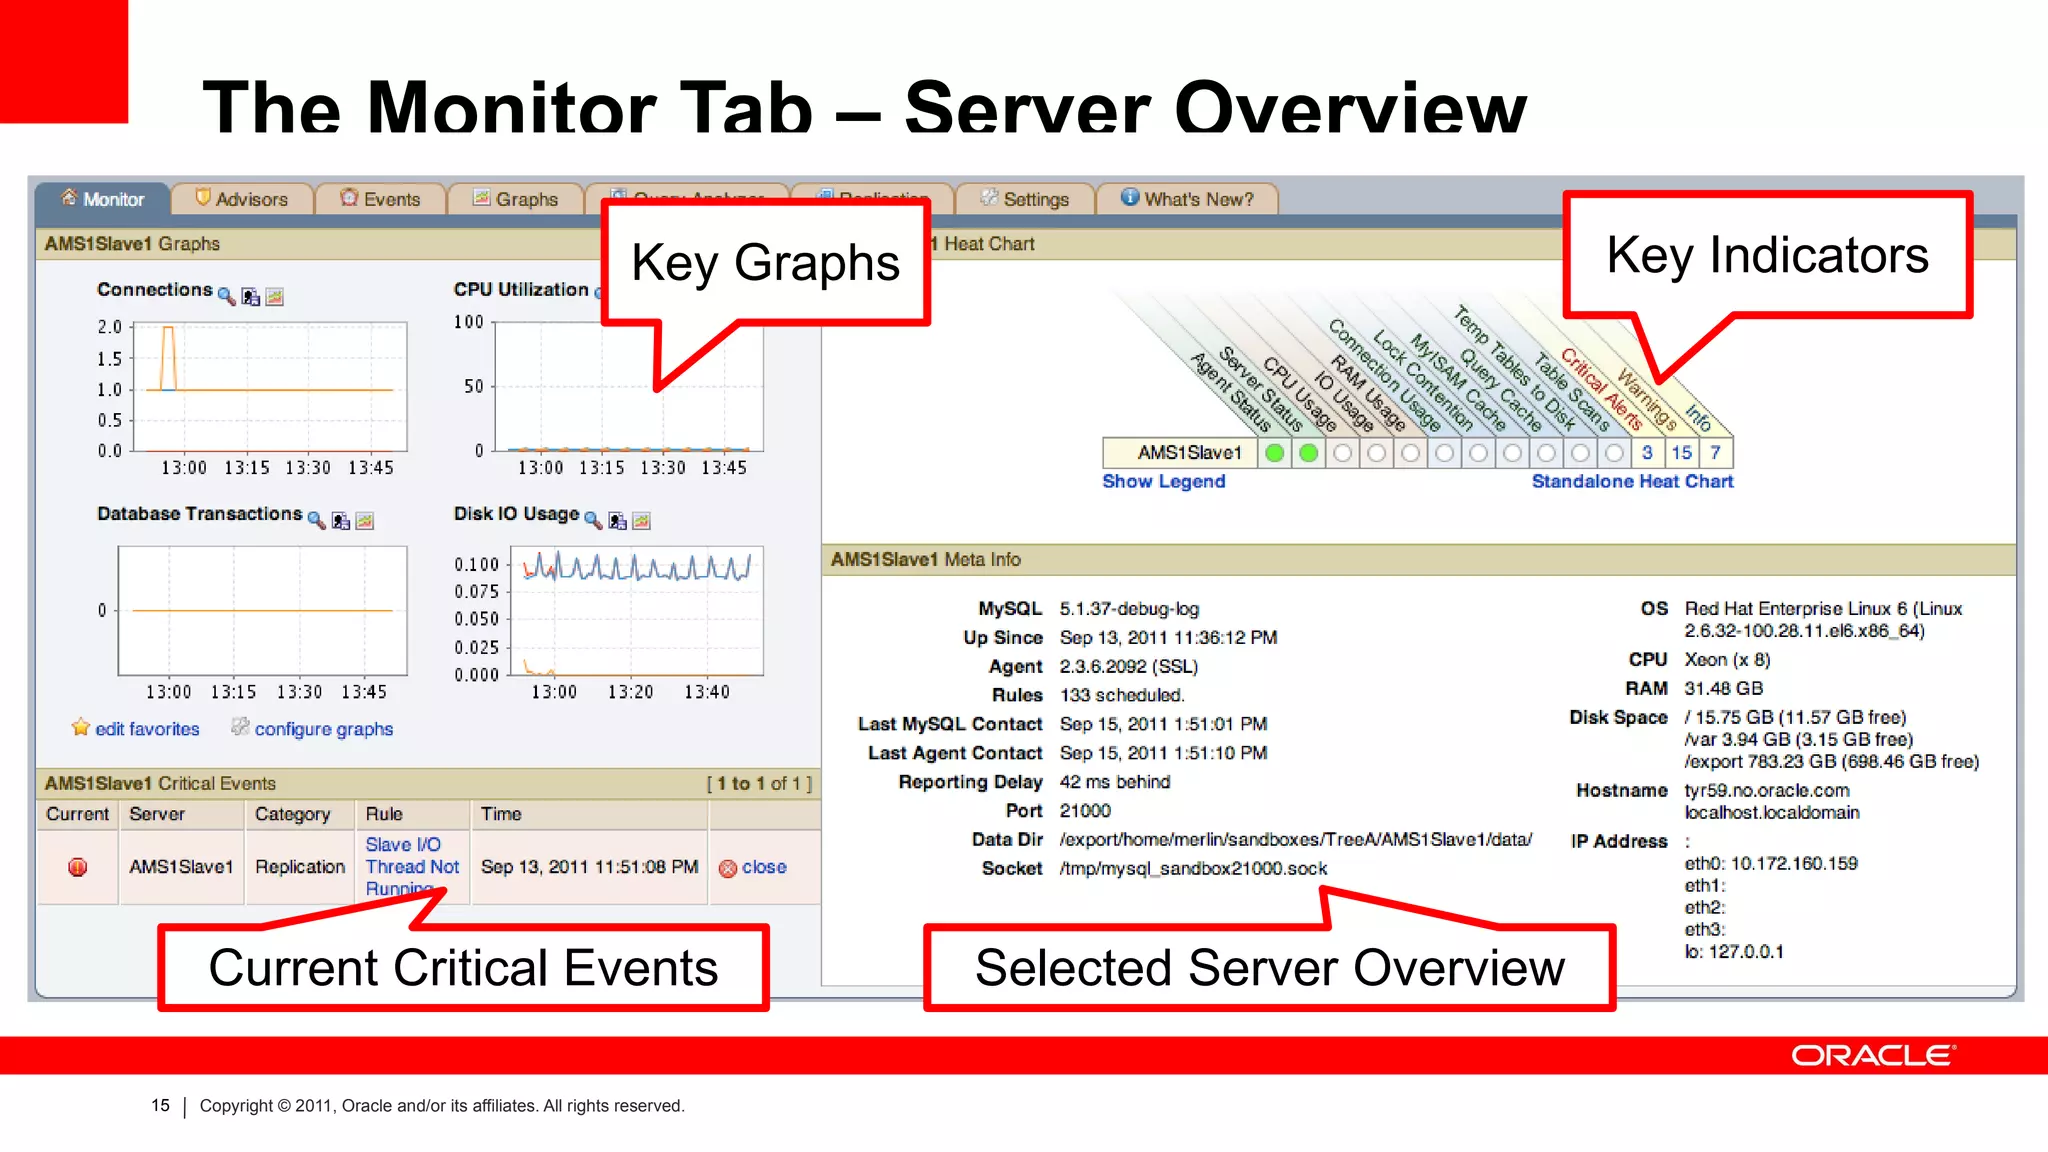
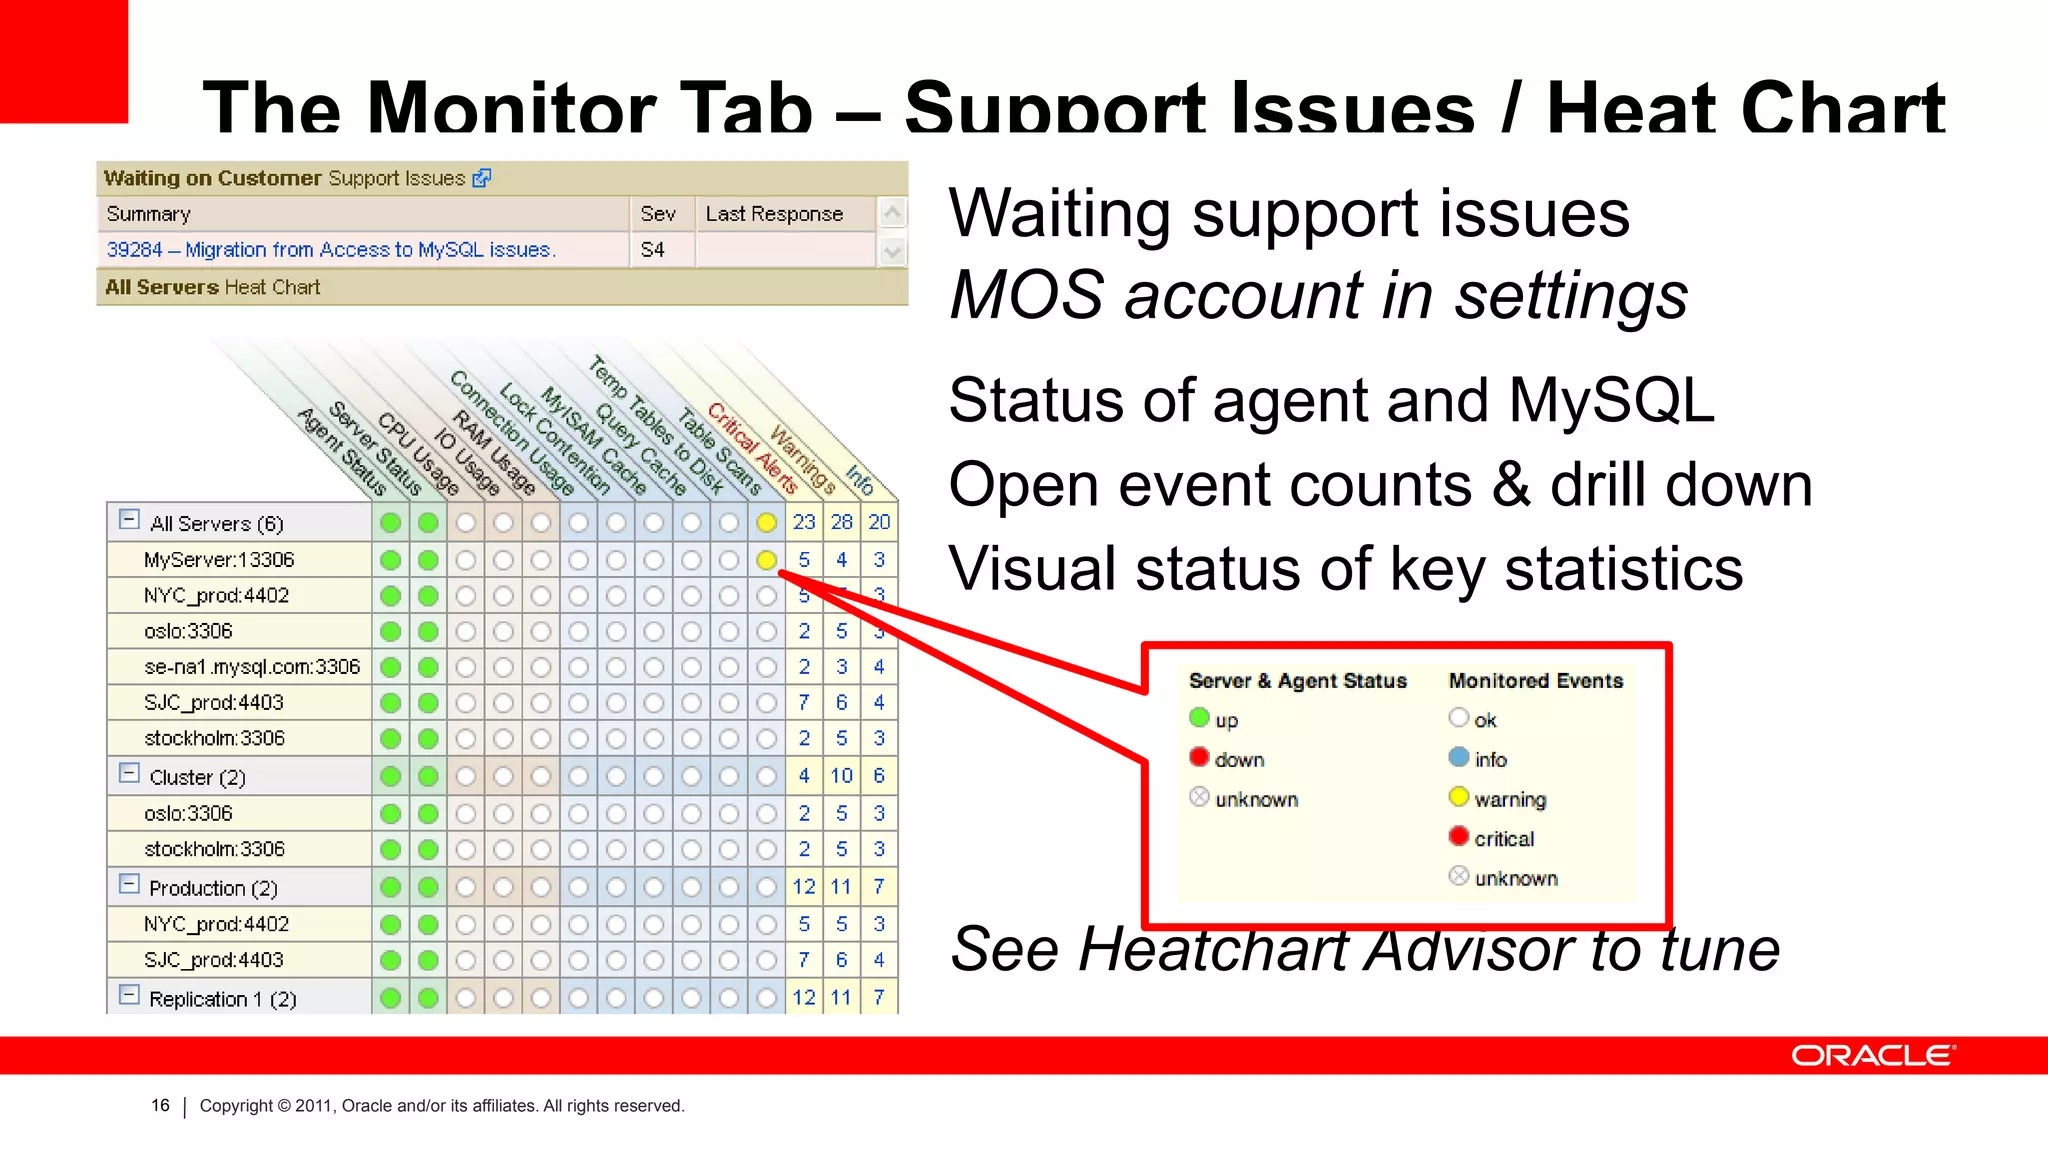
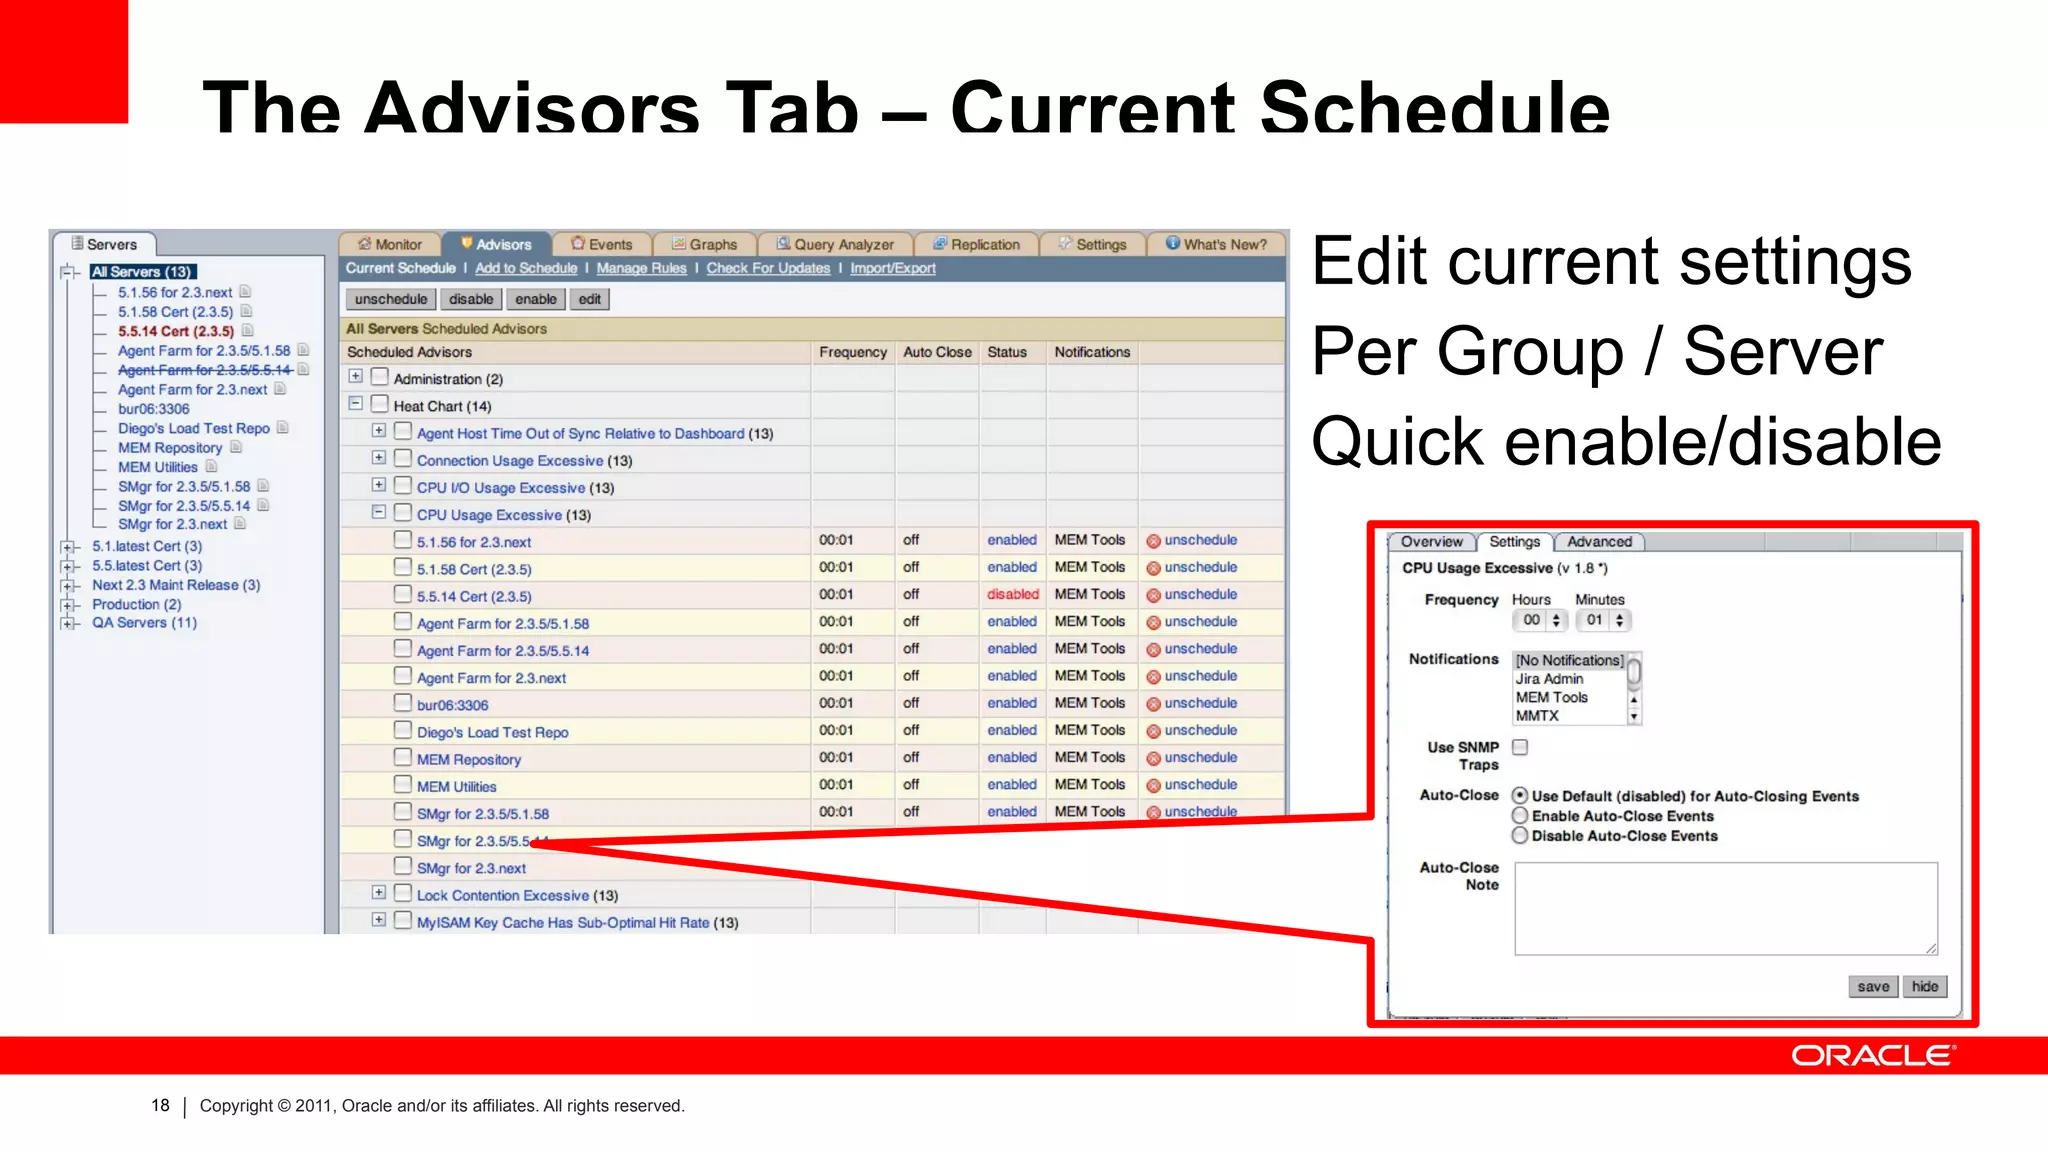
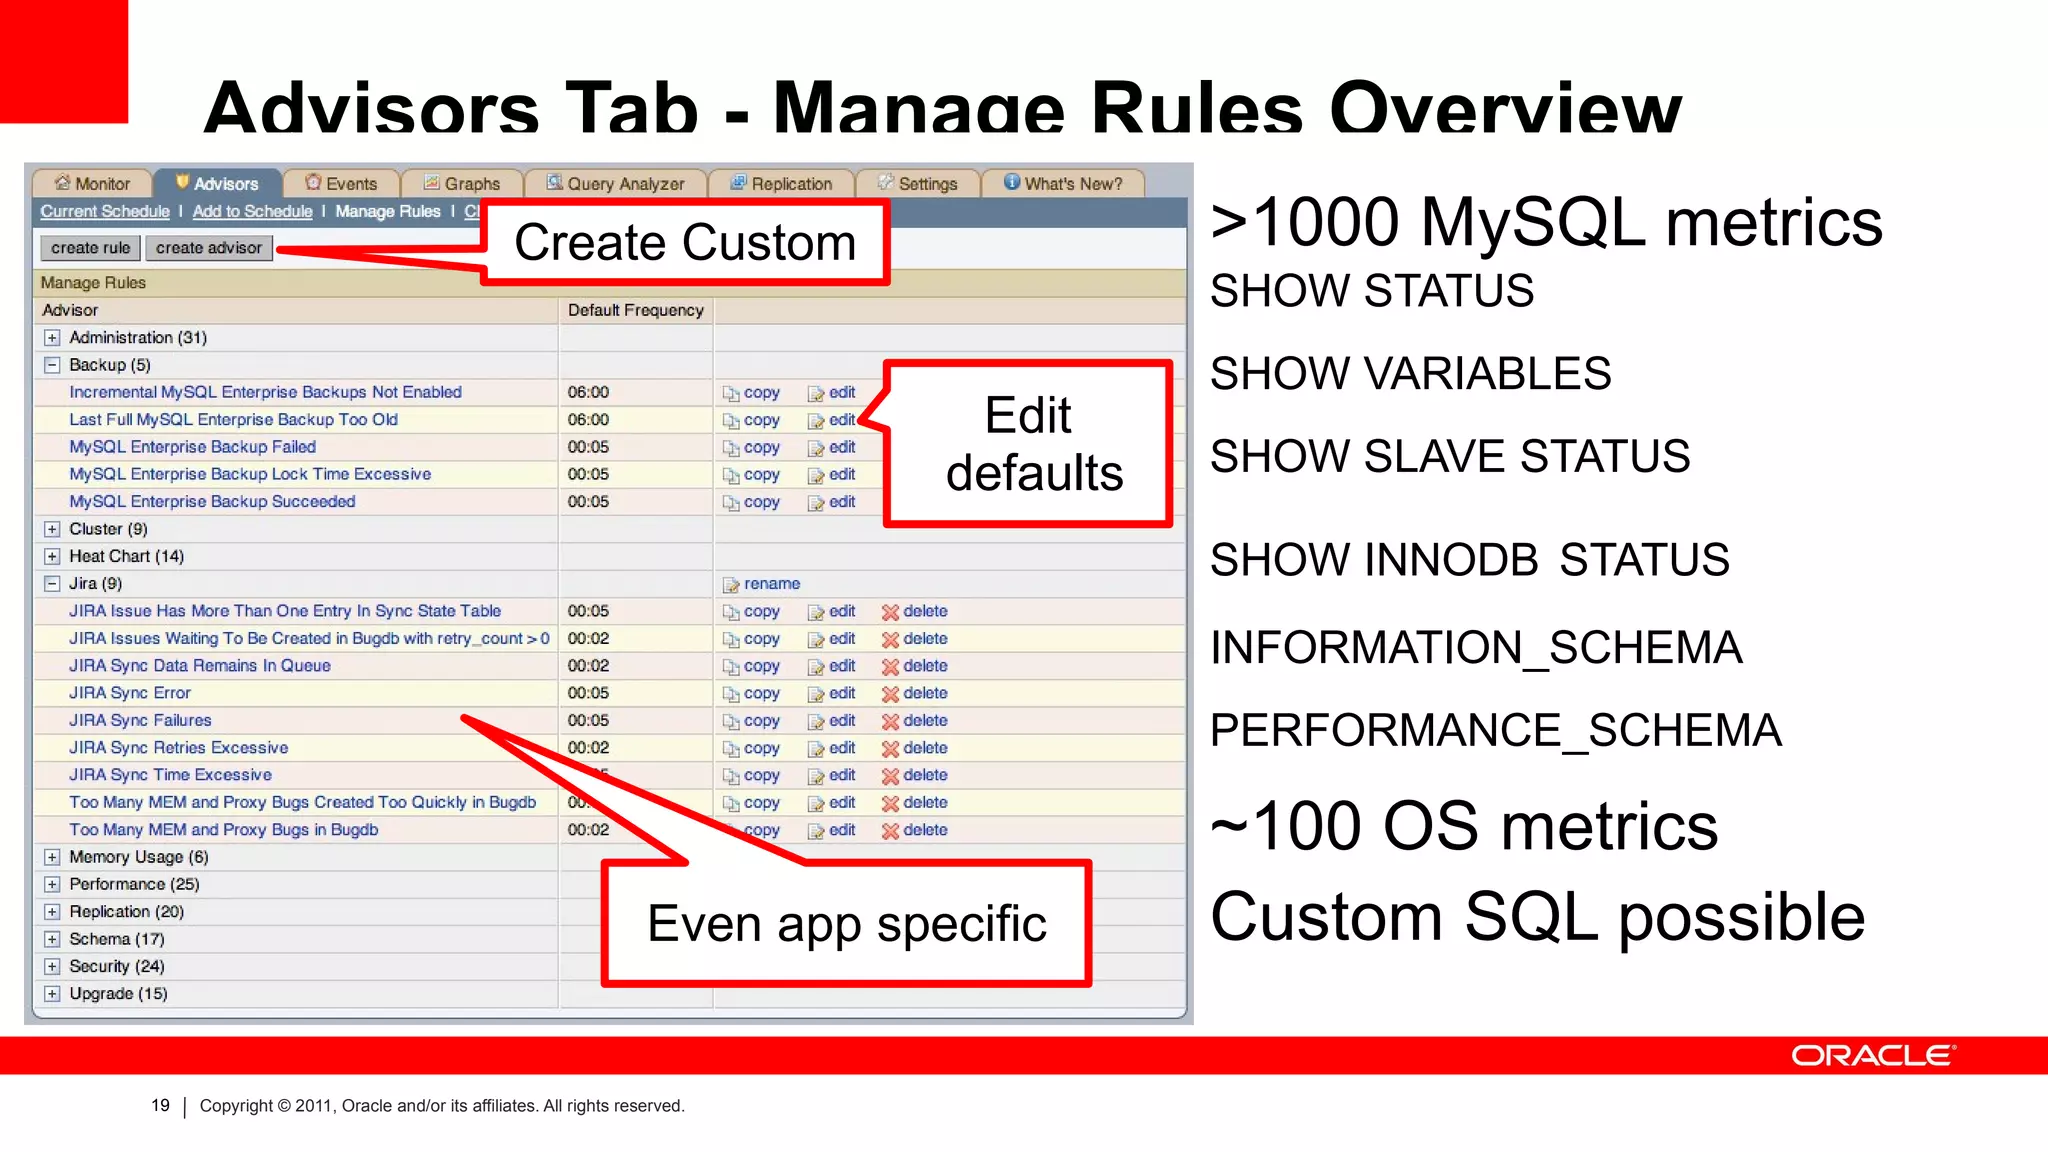
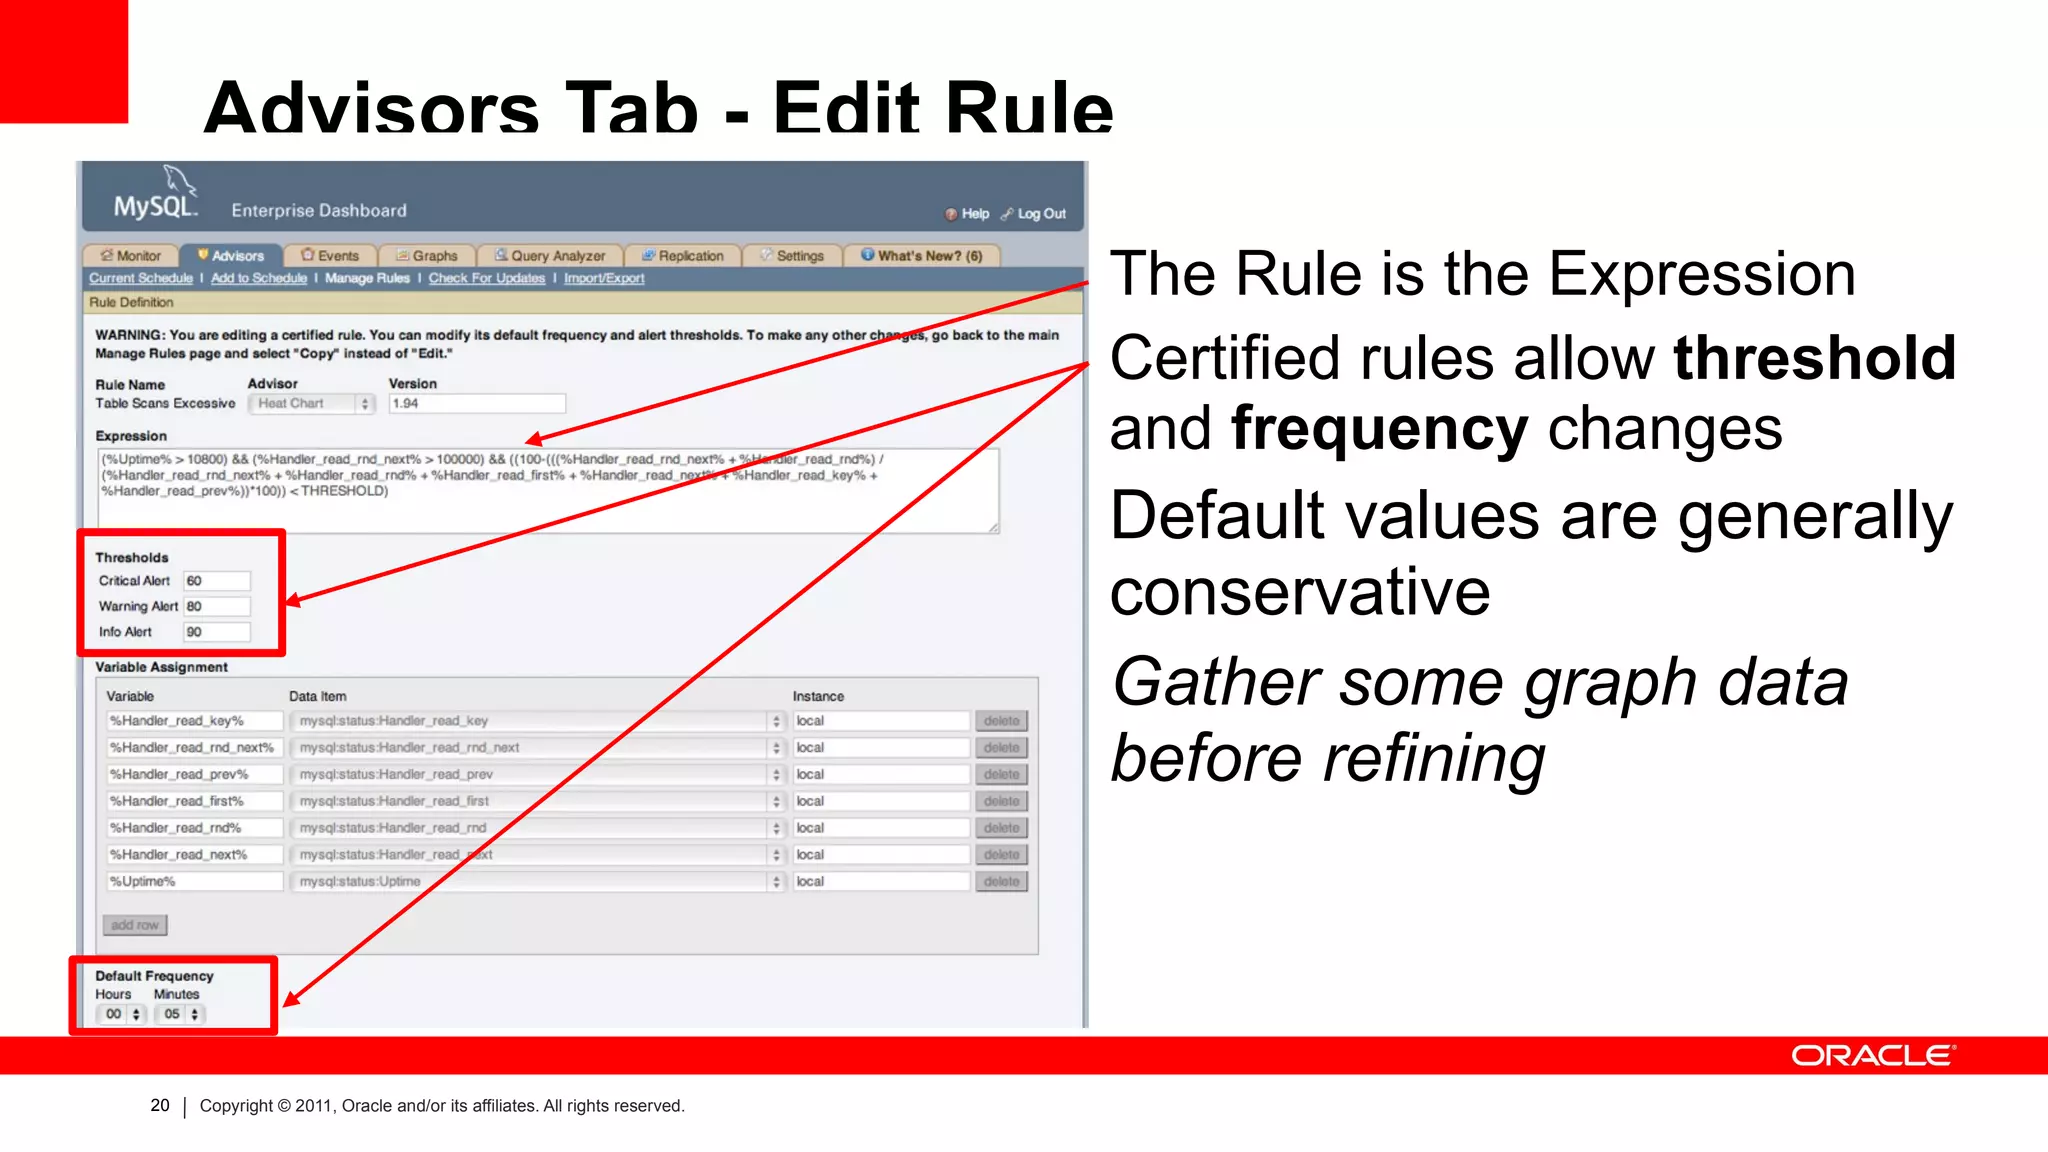
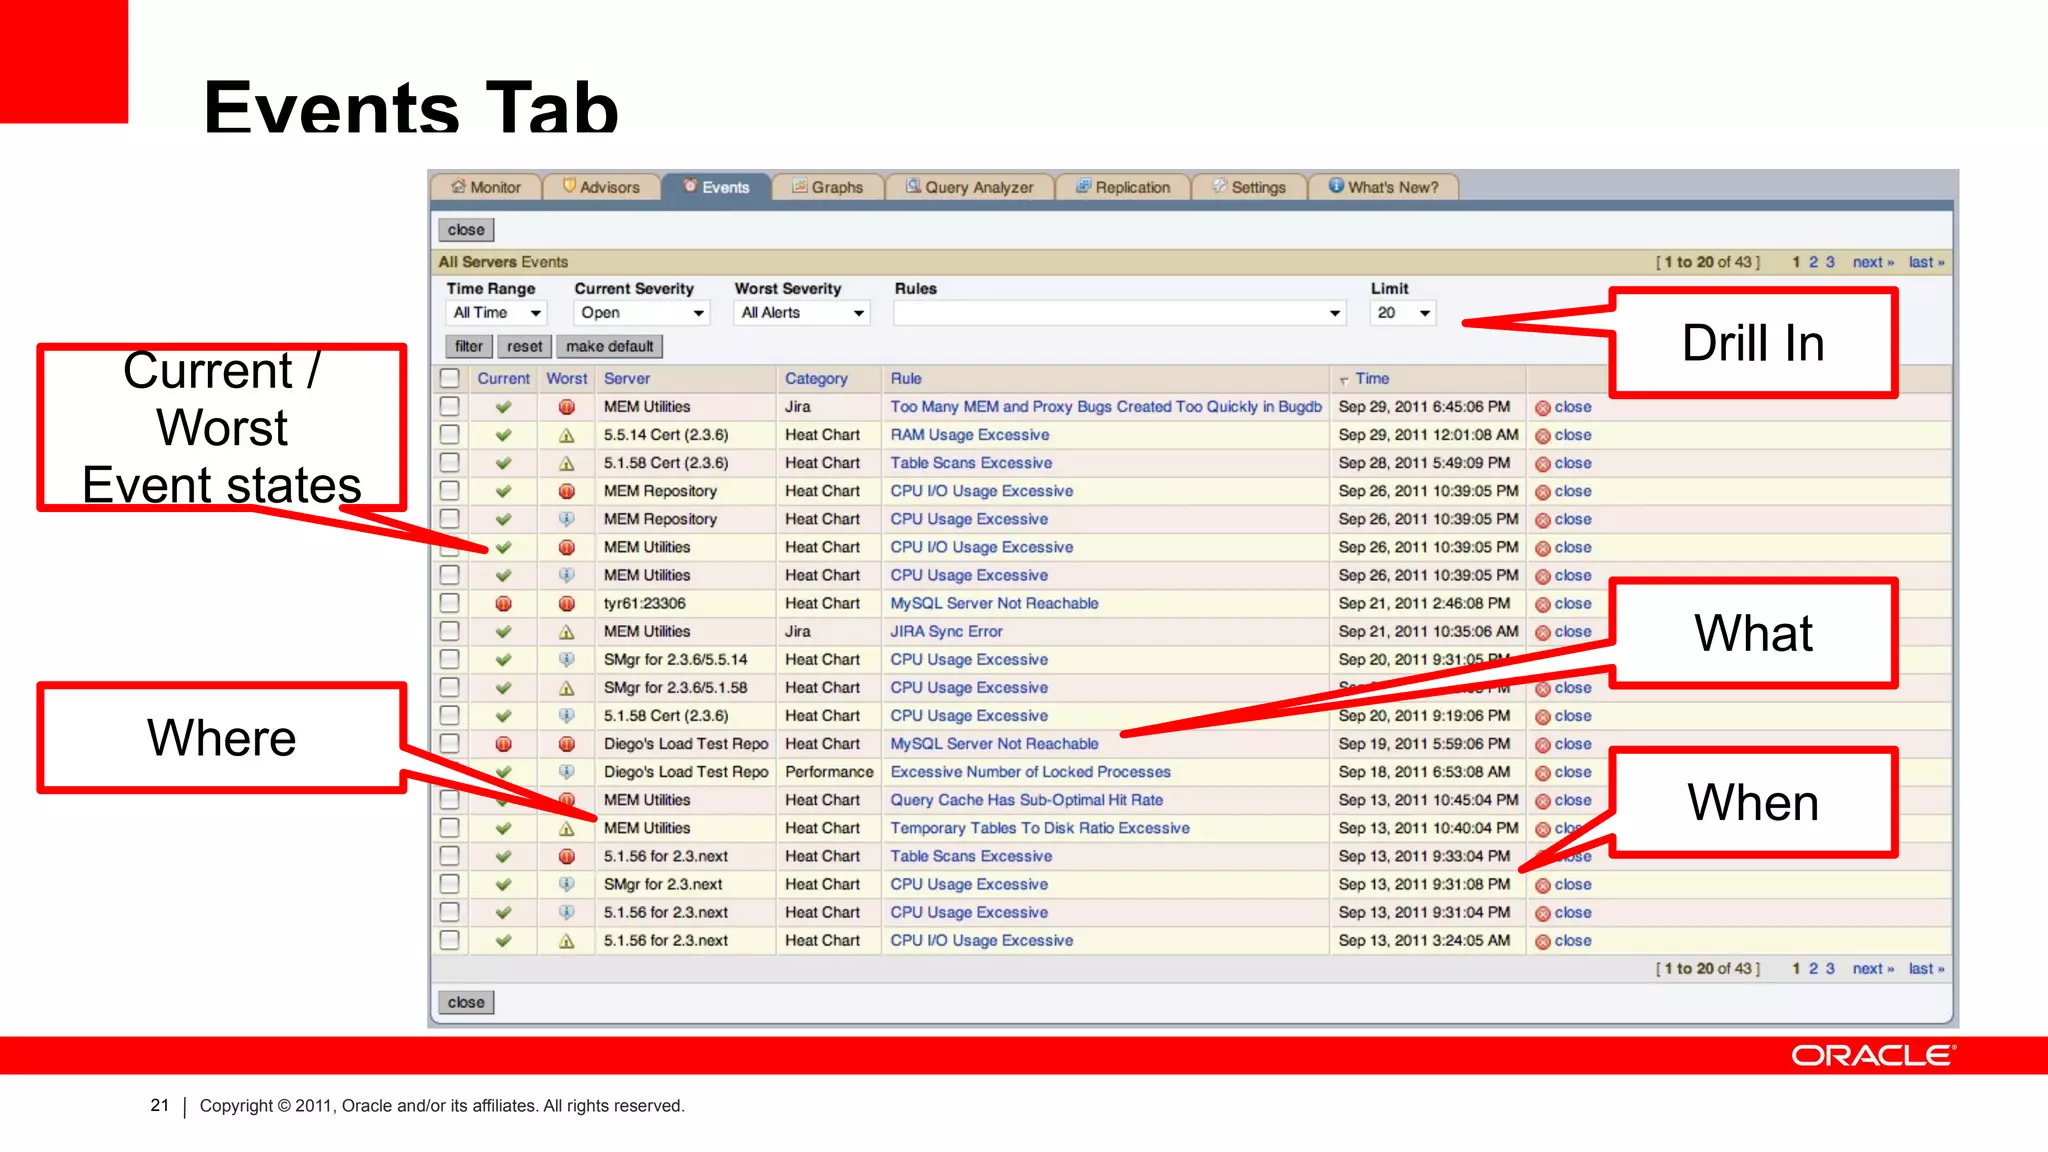
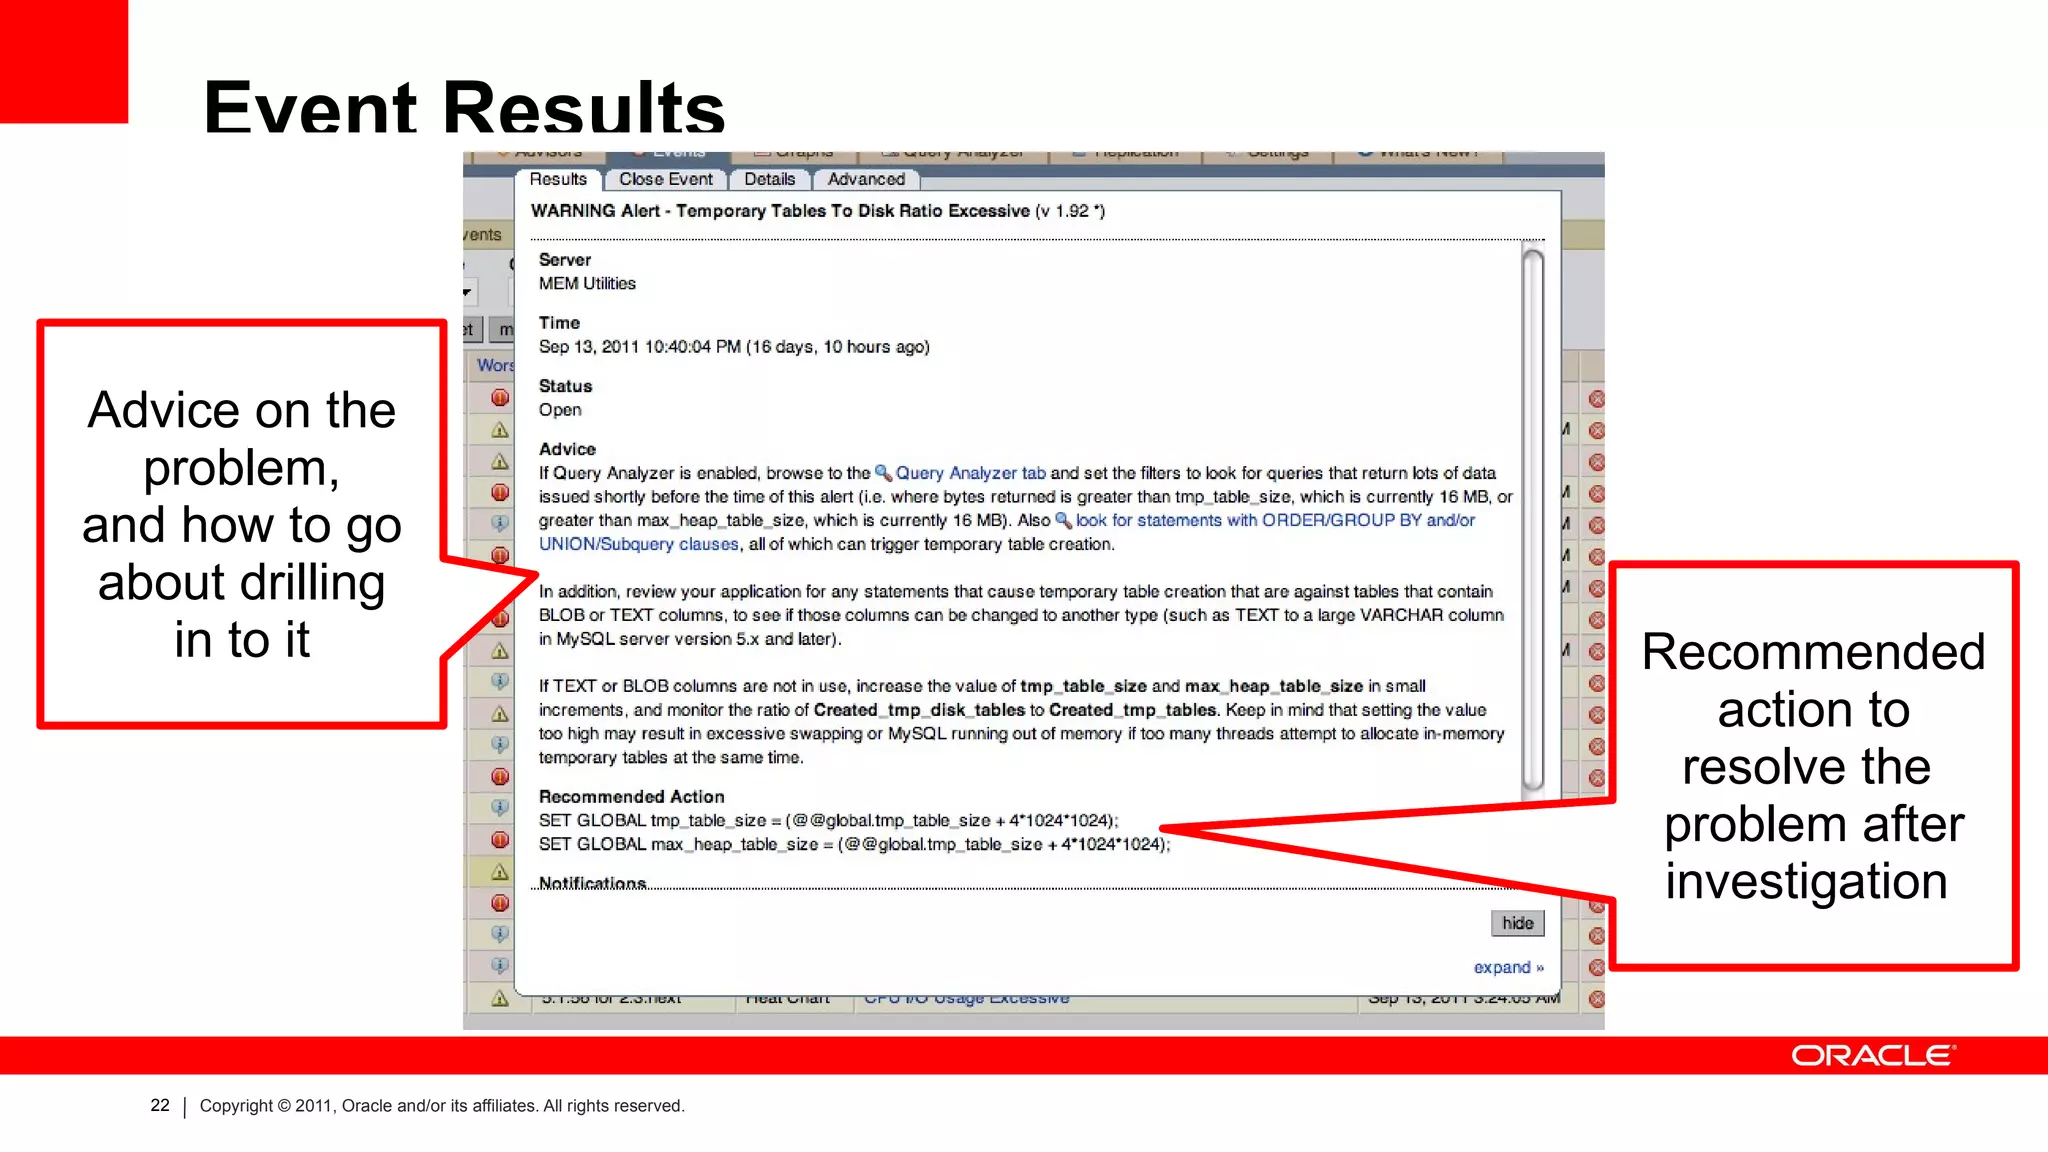
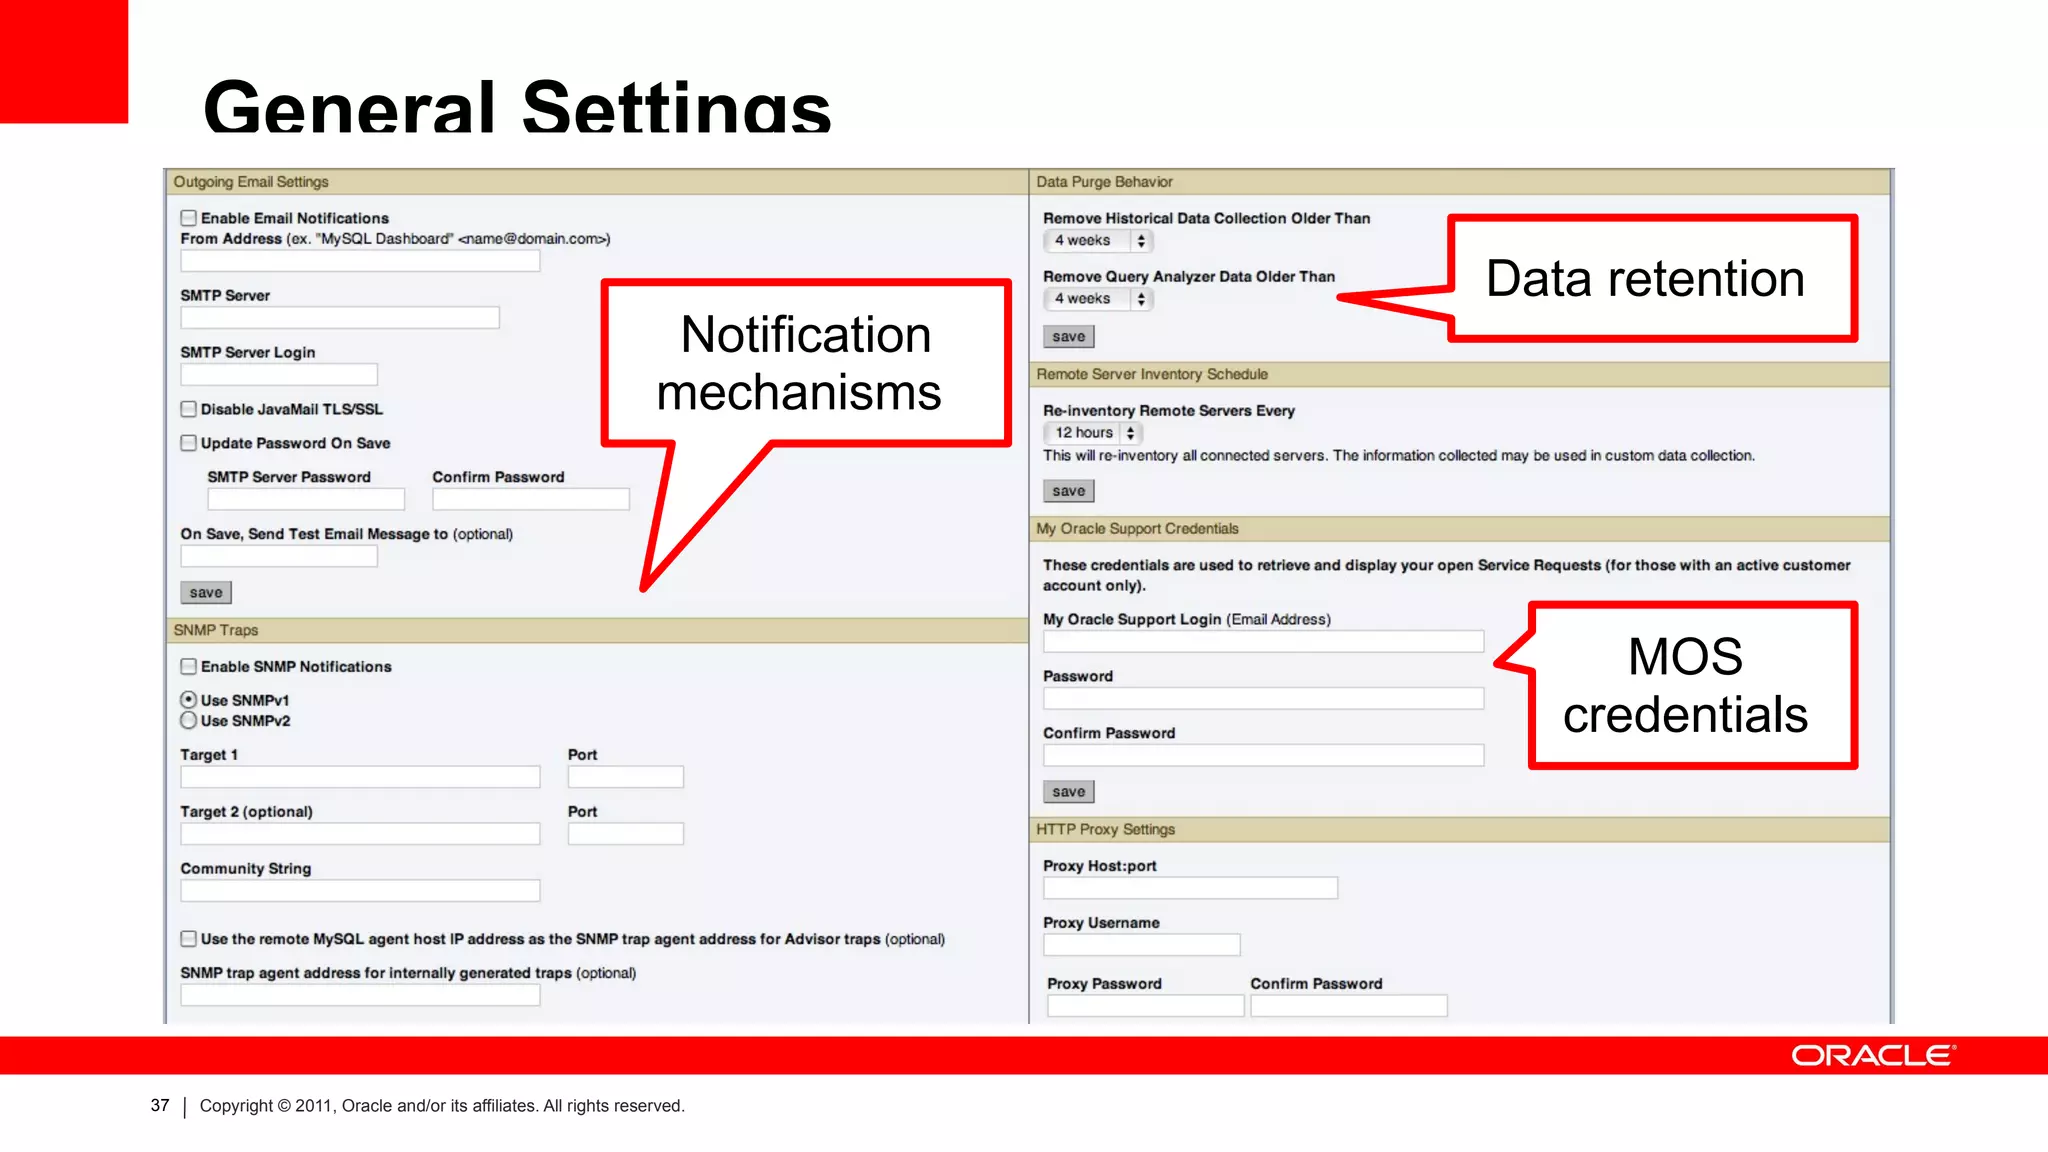
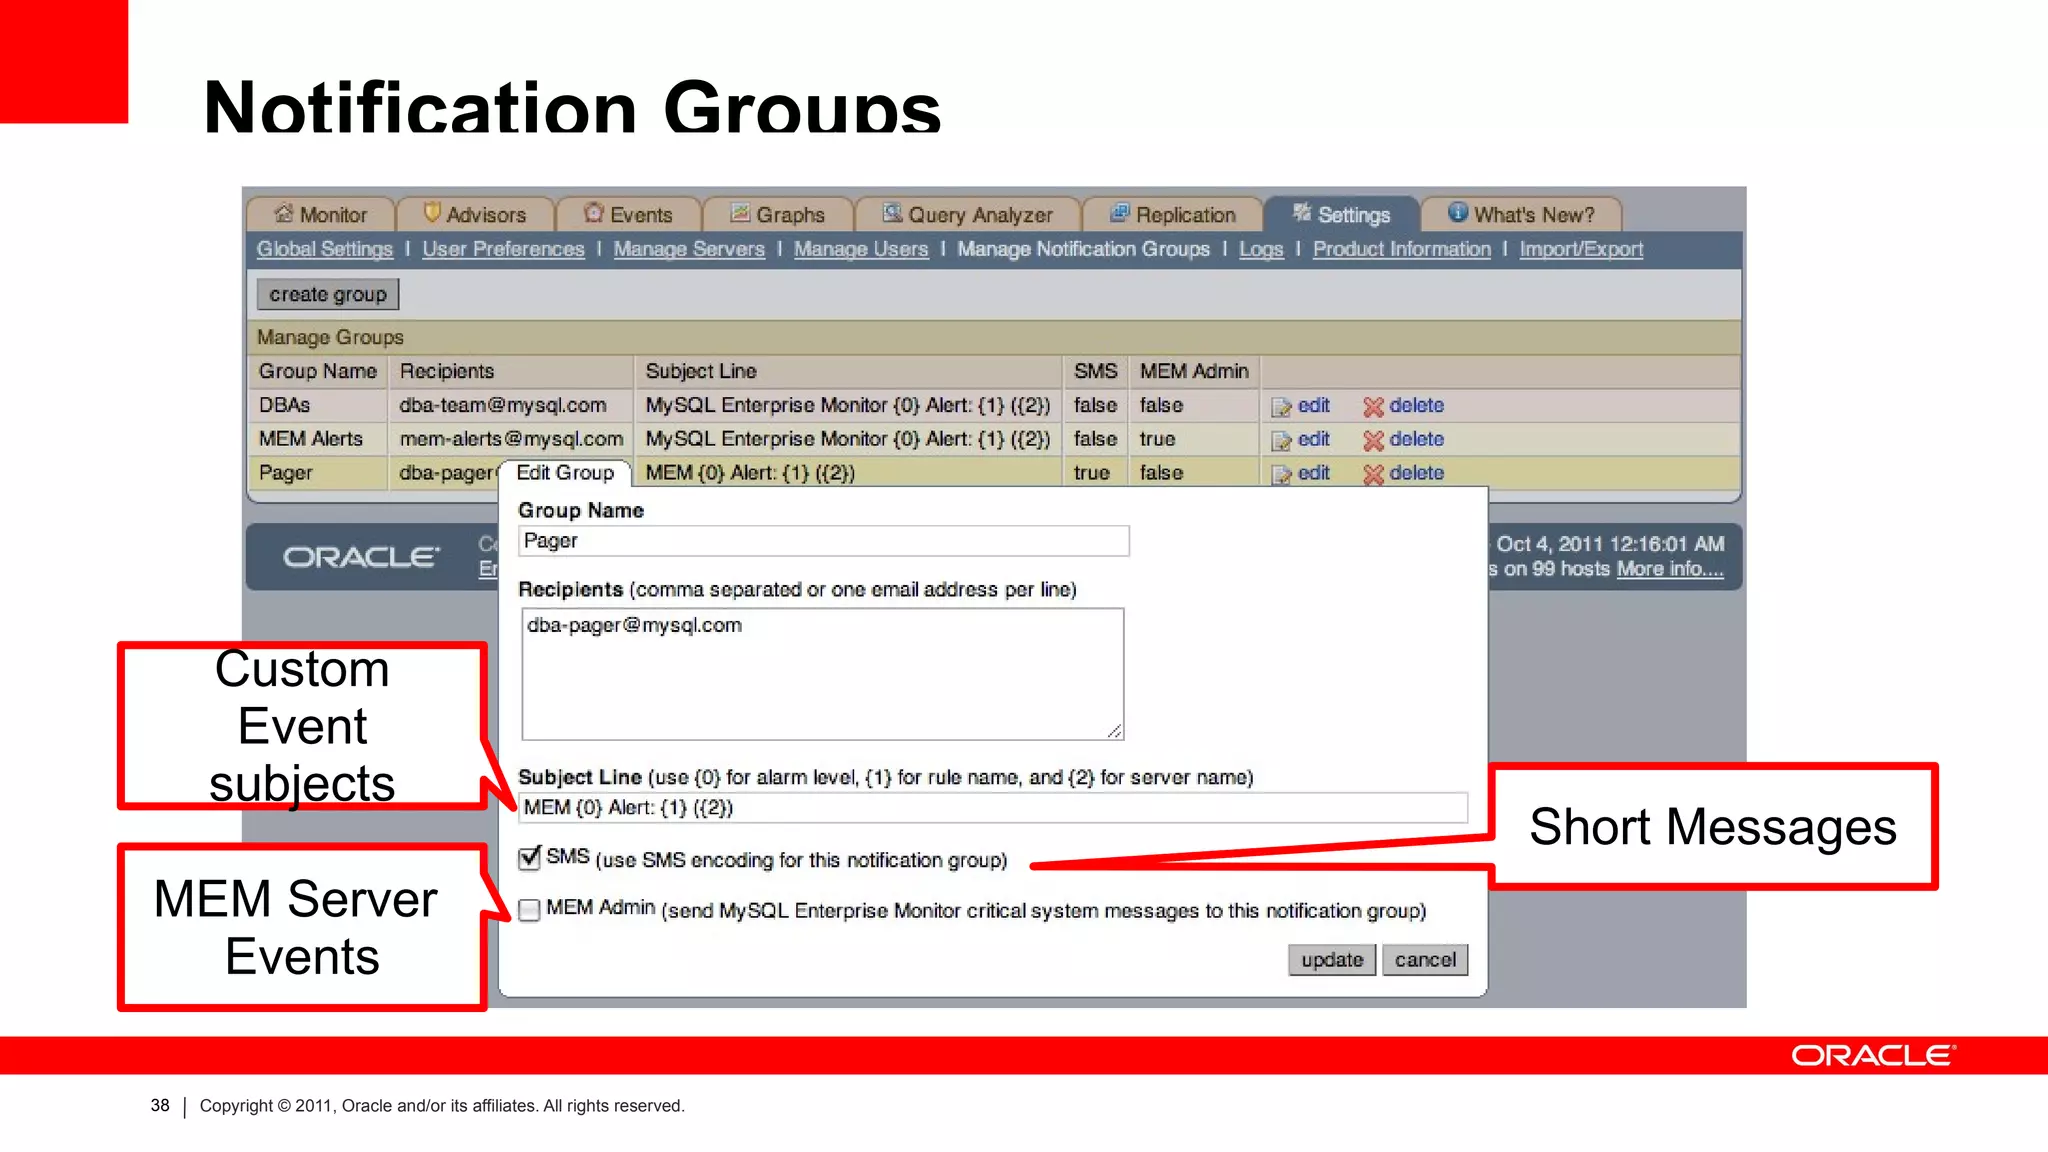
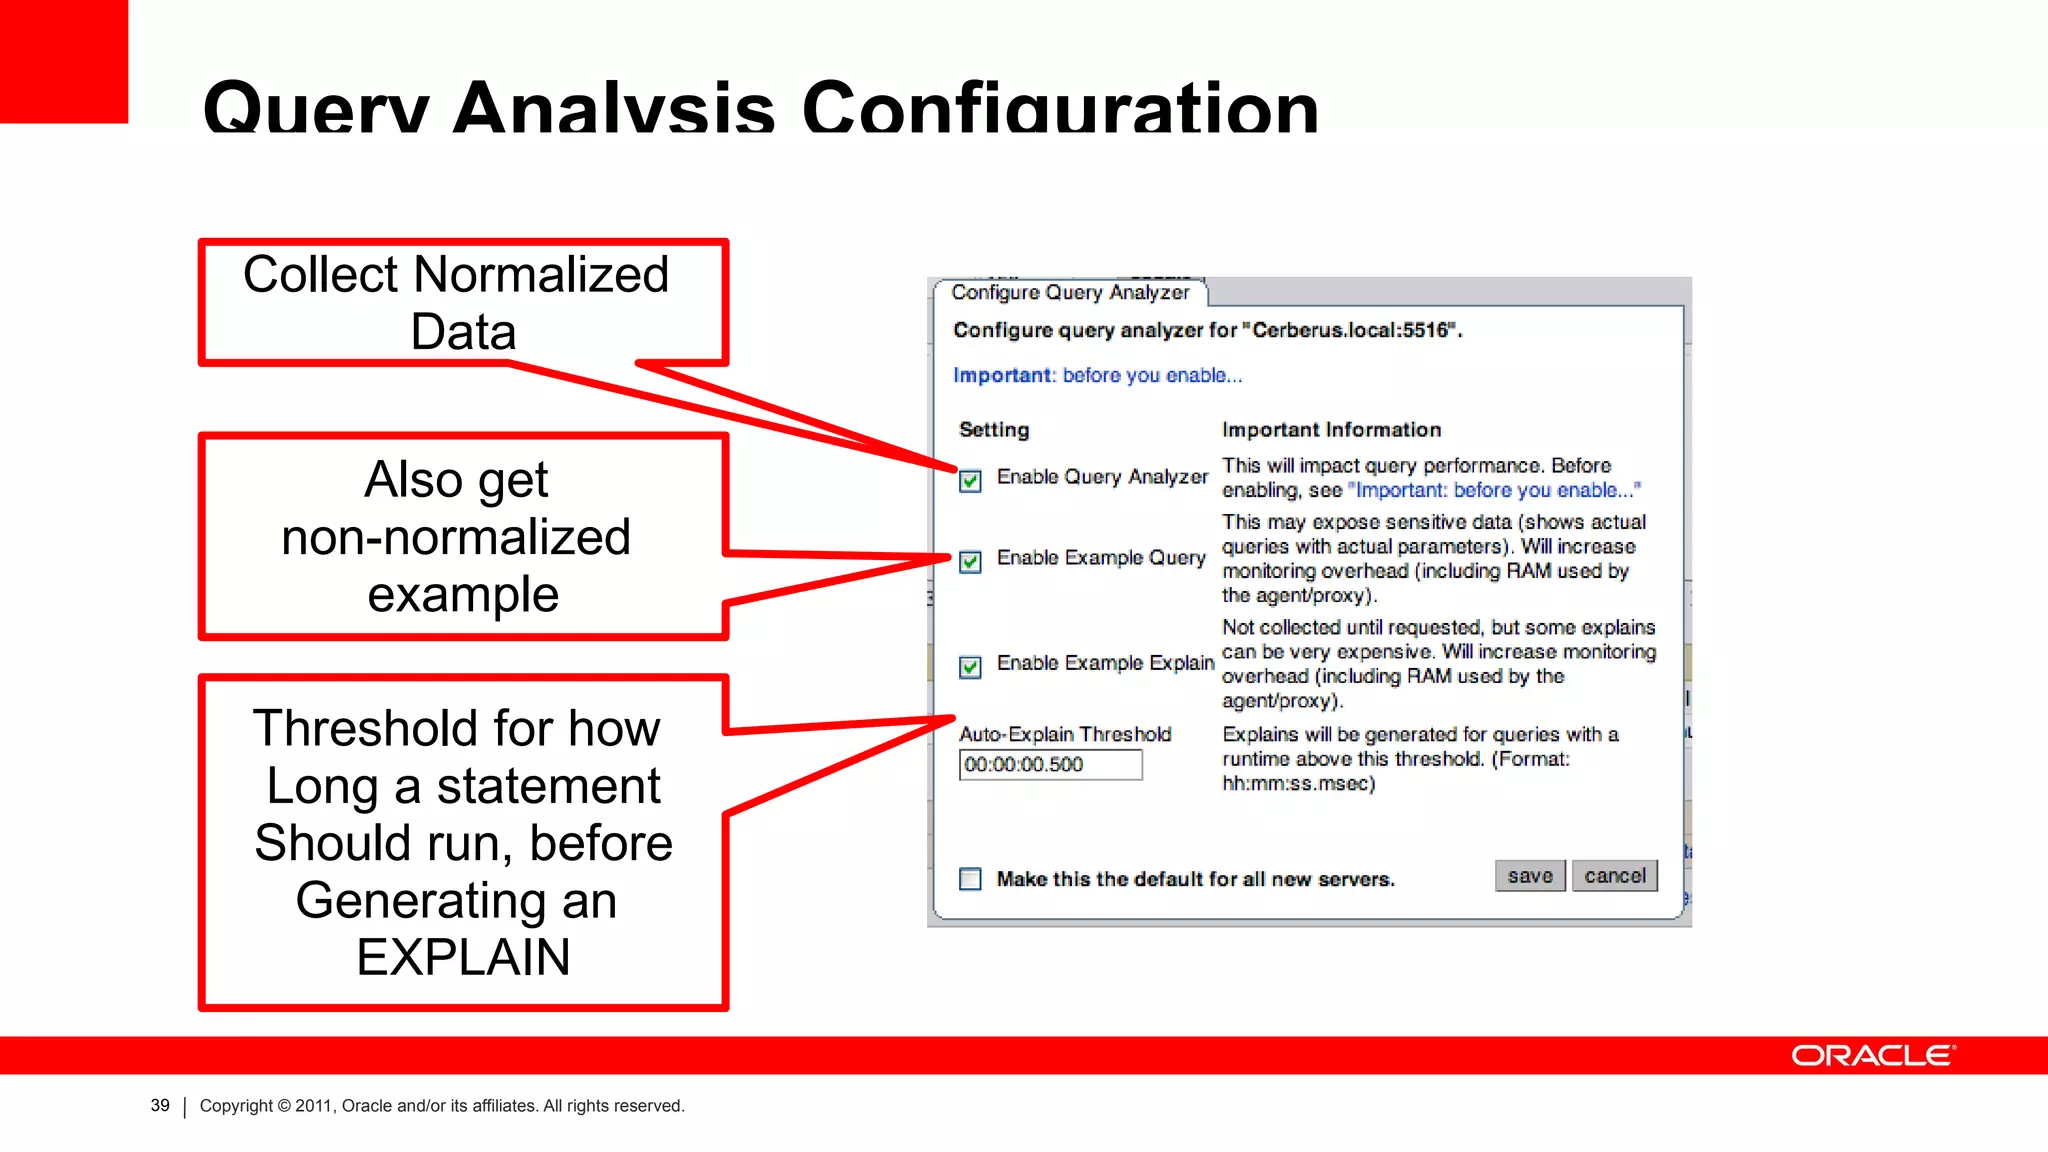
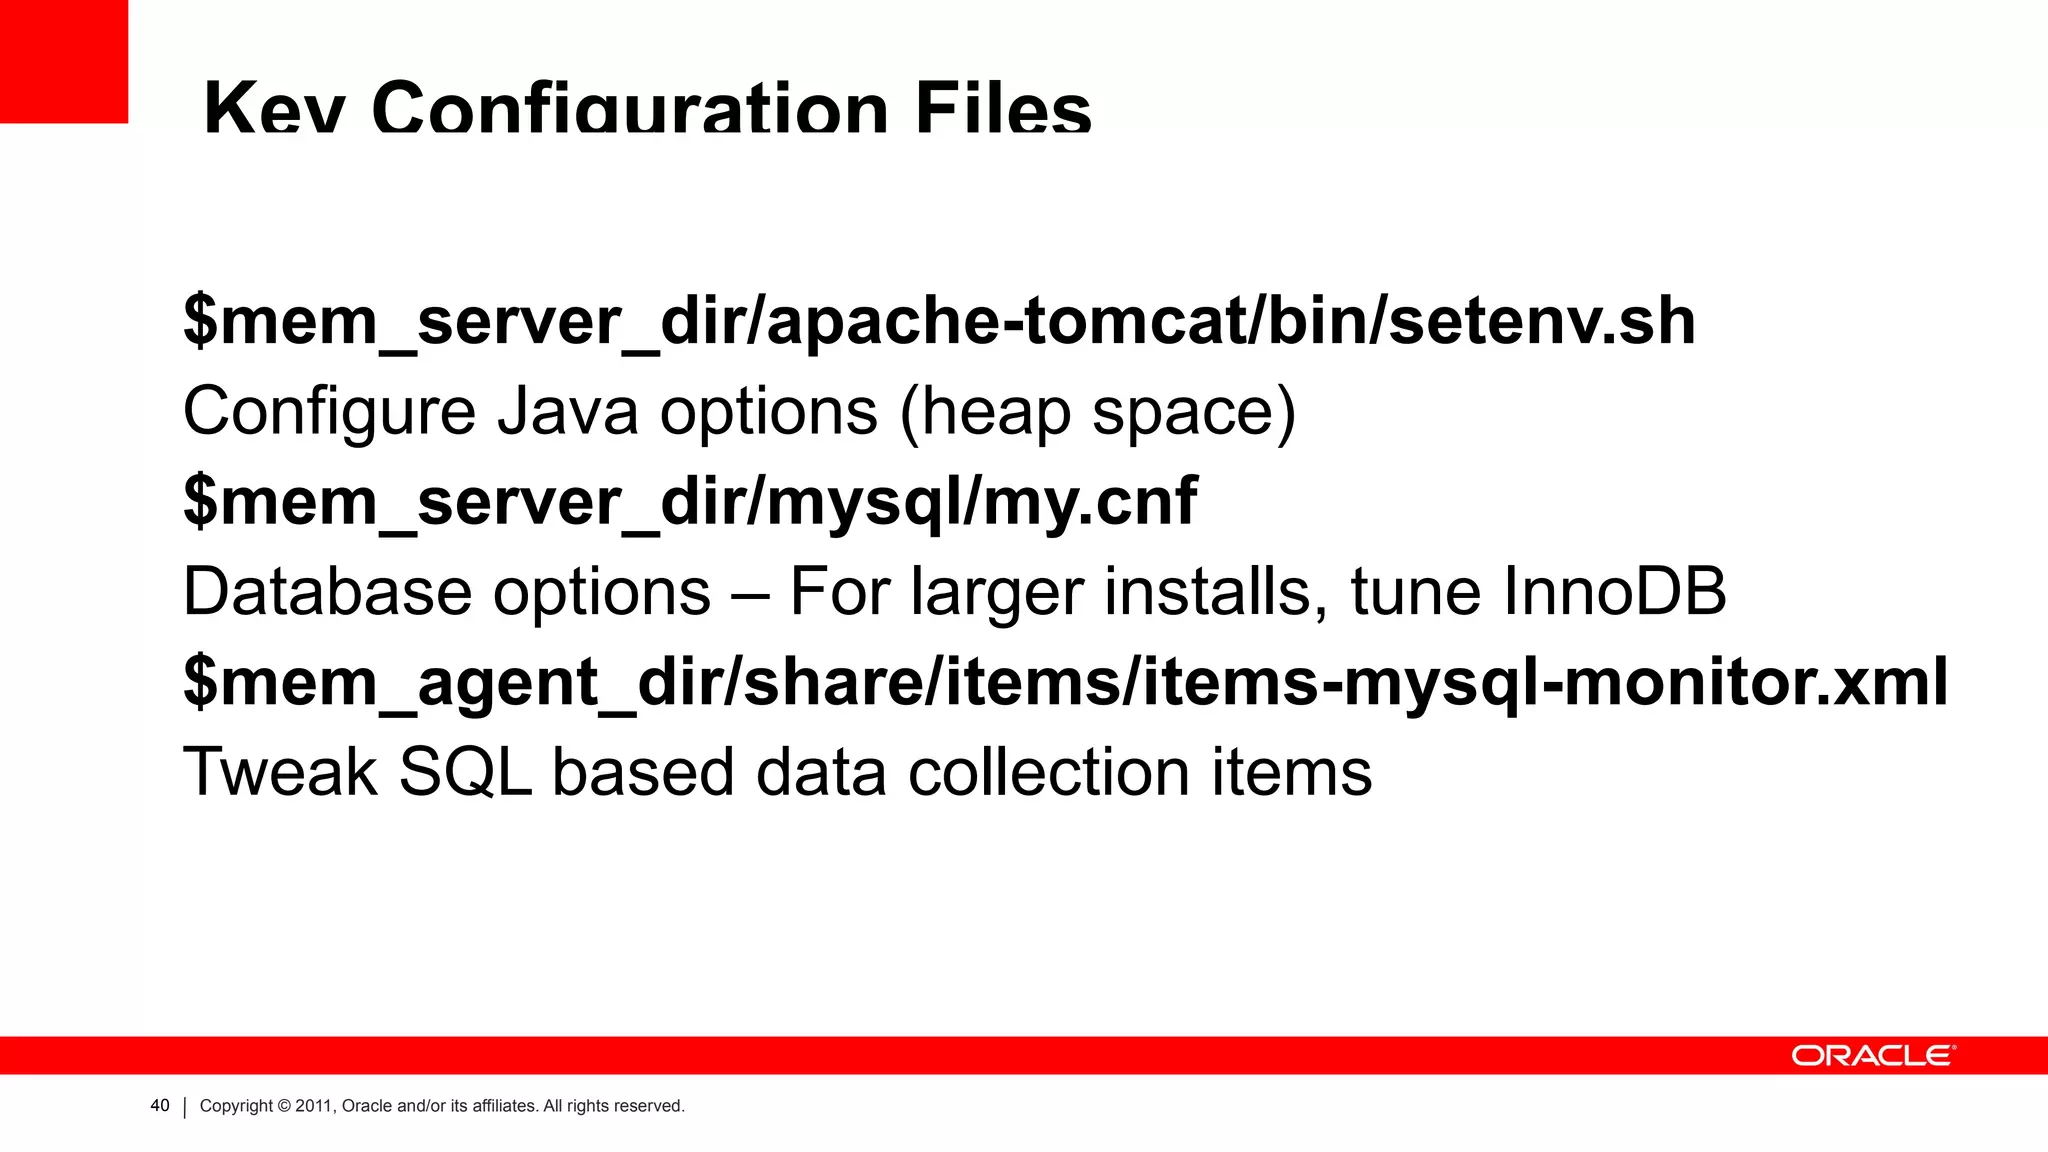
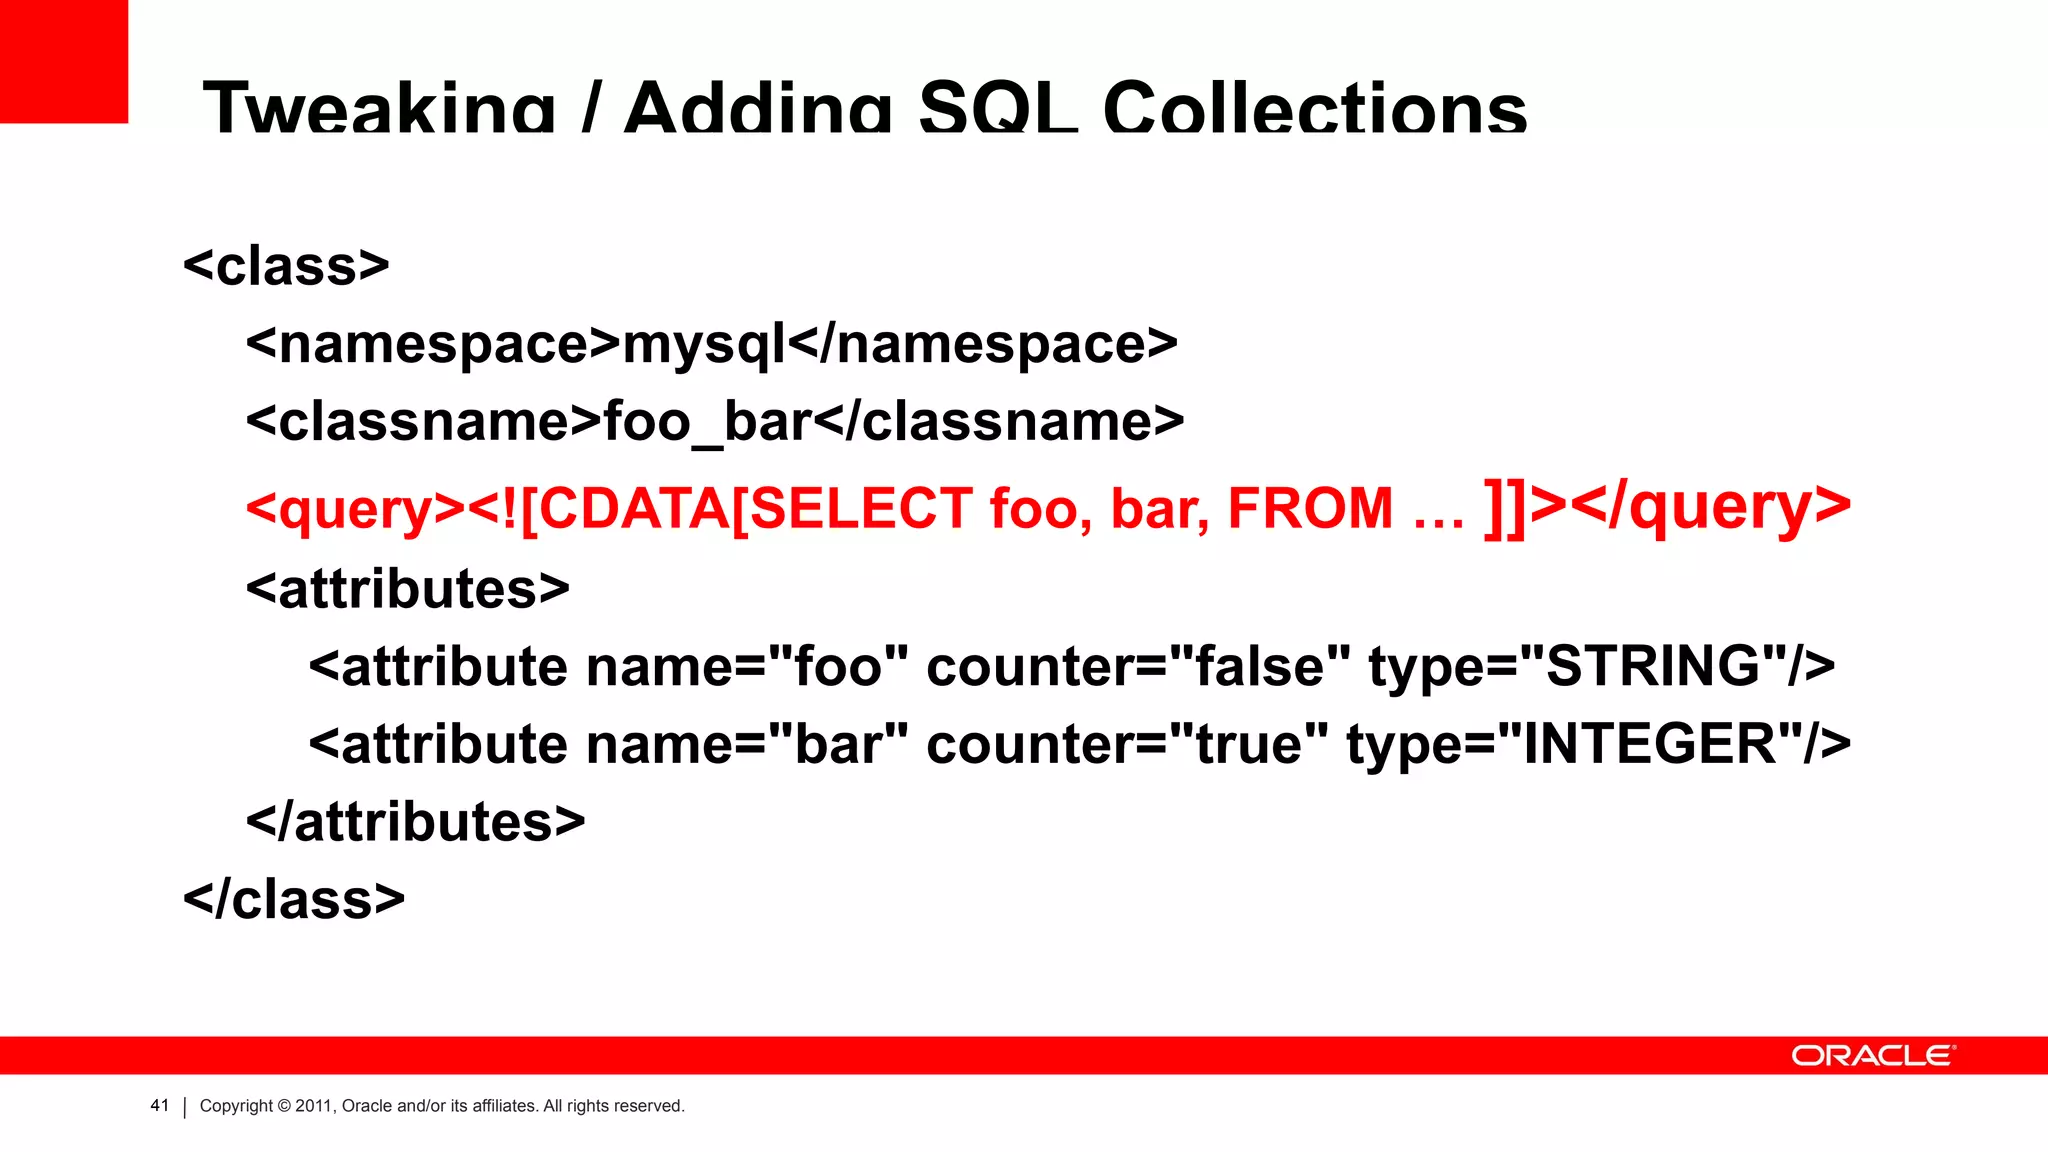
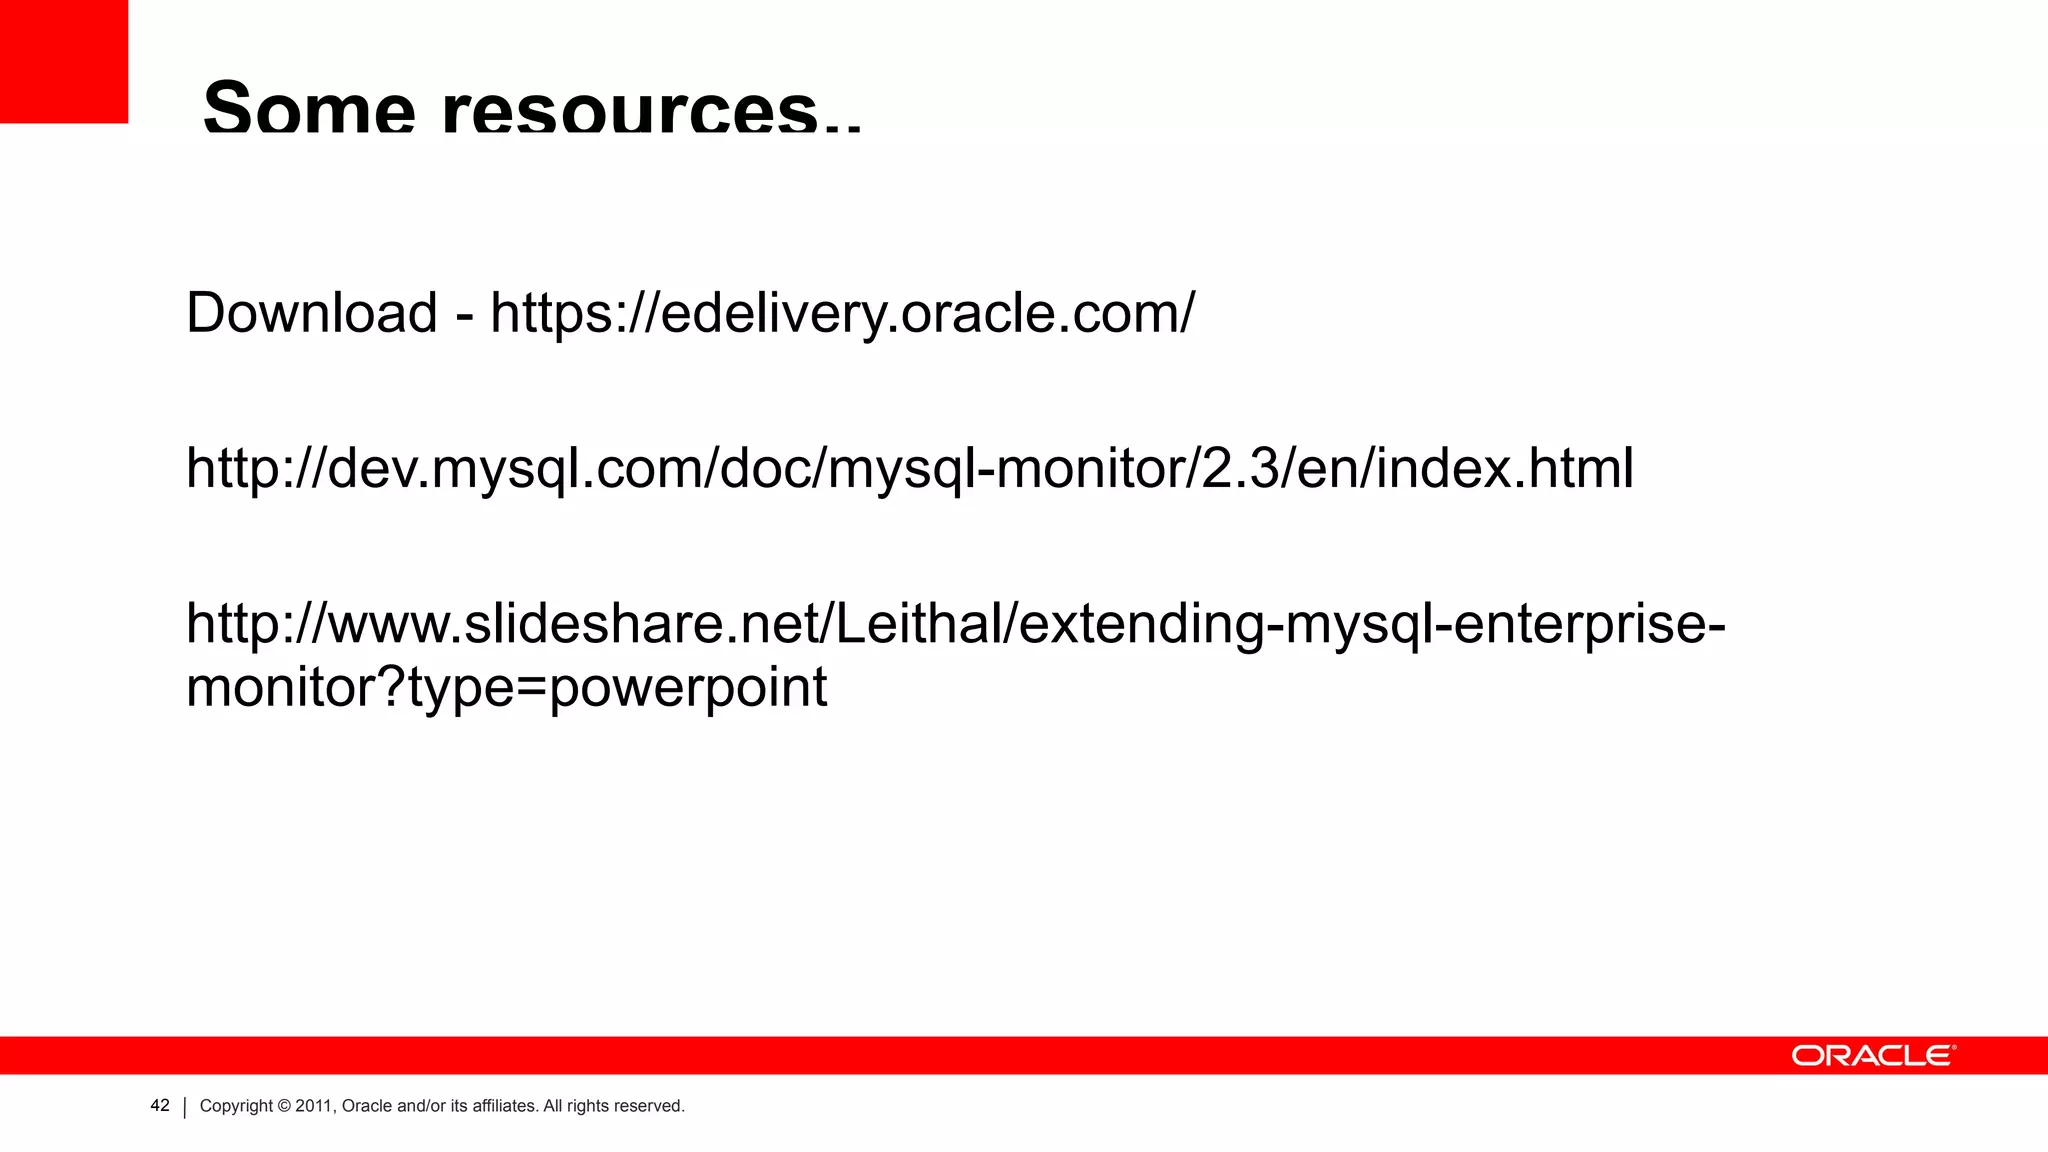


The document outlines the features and architecture of the MySQL Enterprise Monitor, focusing on its ability to monitor and streamline database management at scale. It discusses the installation process, key components like the mem server and agent, and the user interface's monitoring capabilities. Additionally, various metrics, configuration settings, and tools for troubleshooting and performance analysis are covered.