This research proposes a novel method for document image segmentation and classification using an extreme learning machine (ELM) based on header blocks. By employing particle swarm optimization (PSO) for segmentation and gray level co-occurrence matrices for feature extraction, the study achieves an accuracy of 82.3%, outperforming traditional support vector machines with an accuracy of 64.7%. The method effectively categorizes documents into distinct sections such as headings, headers, footers, and author names, enhancing the efficiency of document analysis.
![Kalpana S & Vijaya M S International Journal of Image Processing (IJIP), Volume (8) : Issue (5) : 2014 245 Header Based Classification of Journals Using Document Image Segmentation and Extreme Learning Machine Kalpana S kalpana.msccs@gmail.com Research Scholar PSGR Krishnammal College for Women Coimbatore, India. Vijaya MS msvijaya@grgsact.com Associate Professor PSGR Krishnammal College for Women Coimbatore, India. Abstract Document image segmentation plays an important role in classification of journals, magazines, newspaper, etc., It is a process of splitting the document into distinct regions. Document layout analysis is a key process of identifying and categorizing the regions of interest in the scanned image of a text document. A reading system requires the segmentation of text zones from non- textual ones and the arrangement in their correct reading order. Detection and labelling of text zones play different logical roles inside the document such as titles, captions, footnotes, etc. This research work proposes a new approach to segment the document and classify the journals based on the header block. Documents are collected from different journals and used as input image. The image is segmented into blocks like heading, header, author name and footer using Particle Swarm optimization algorithm and features are extracted from header block using Gray Level Co-occurrences Matrix. Extreme Learning Machine has been used for classification based on the header blocks and obtained 82.3% accuracy. Keywords: Classification, Document Segmentation, Feature Extraction, Extreme Learning Machine. 1. INTRODUCTION In computer vision, document layout analysis is the process of identifying and categorizing the regions of interest in the scanned image of a text document. Document image segmentation is a process of subdividing the document into distinct regions or blocks. It is important process in the document analysis. Document segmentation is a fundamental step in document processing, which aims at identifying the relevant components in the document that deserve further and specialized processing. Document analysis consists of geometric and logical analysis. In geometric based segmentation, the document is segmented upon its geometric structure such as text and non-text regions. Whereas in logical segmentation the document is segmented upon its logical labels assigned to each region of the document such as title, logo, footnote, caption, etc., [1]. The geometric layout analysis is also called as physical layout analysis. The physical layout of a document refers to the physical location and boundaries of various regions in the document image. The process of document layout analysis aims to decompose a document image into a hierarchy of homogenous regions such as figures, backgrounds, text blocks, text lines, words, characters, etc., Logical structure is the result of dividing and subdividing the content of a document into increasingly smaller parts on the basis of the human-perceptible meaning of the content [2]. A logical object is an element of the specific logical structure of a document. For logical objects no classification other than basic logical objects, composite logical objects and document logical](https://image.slidesharecdn.com/ijip-901-151224134234/75/Header-Based-Classification-of-Journals-Using-Document-Image-Segmentation-and-Extreme-Learning-Machine-1-2048.jpg)
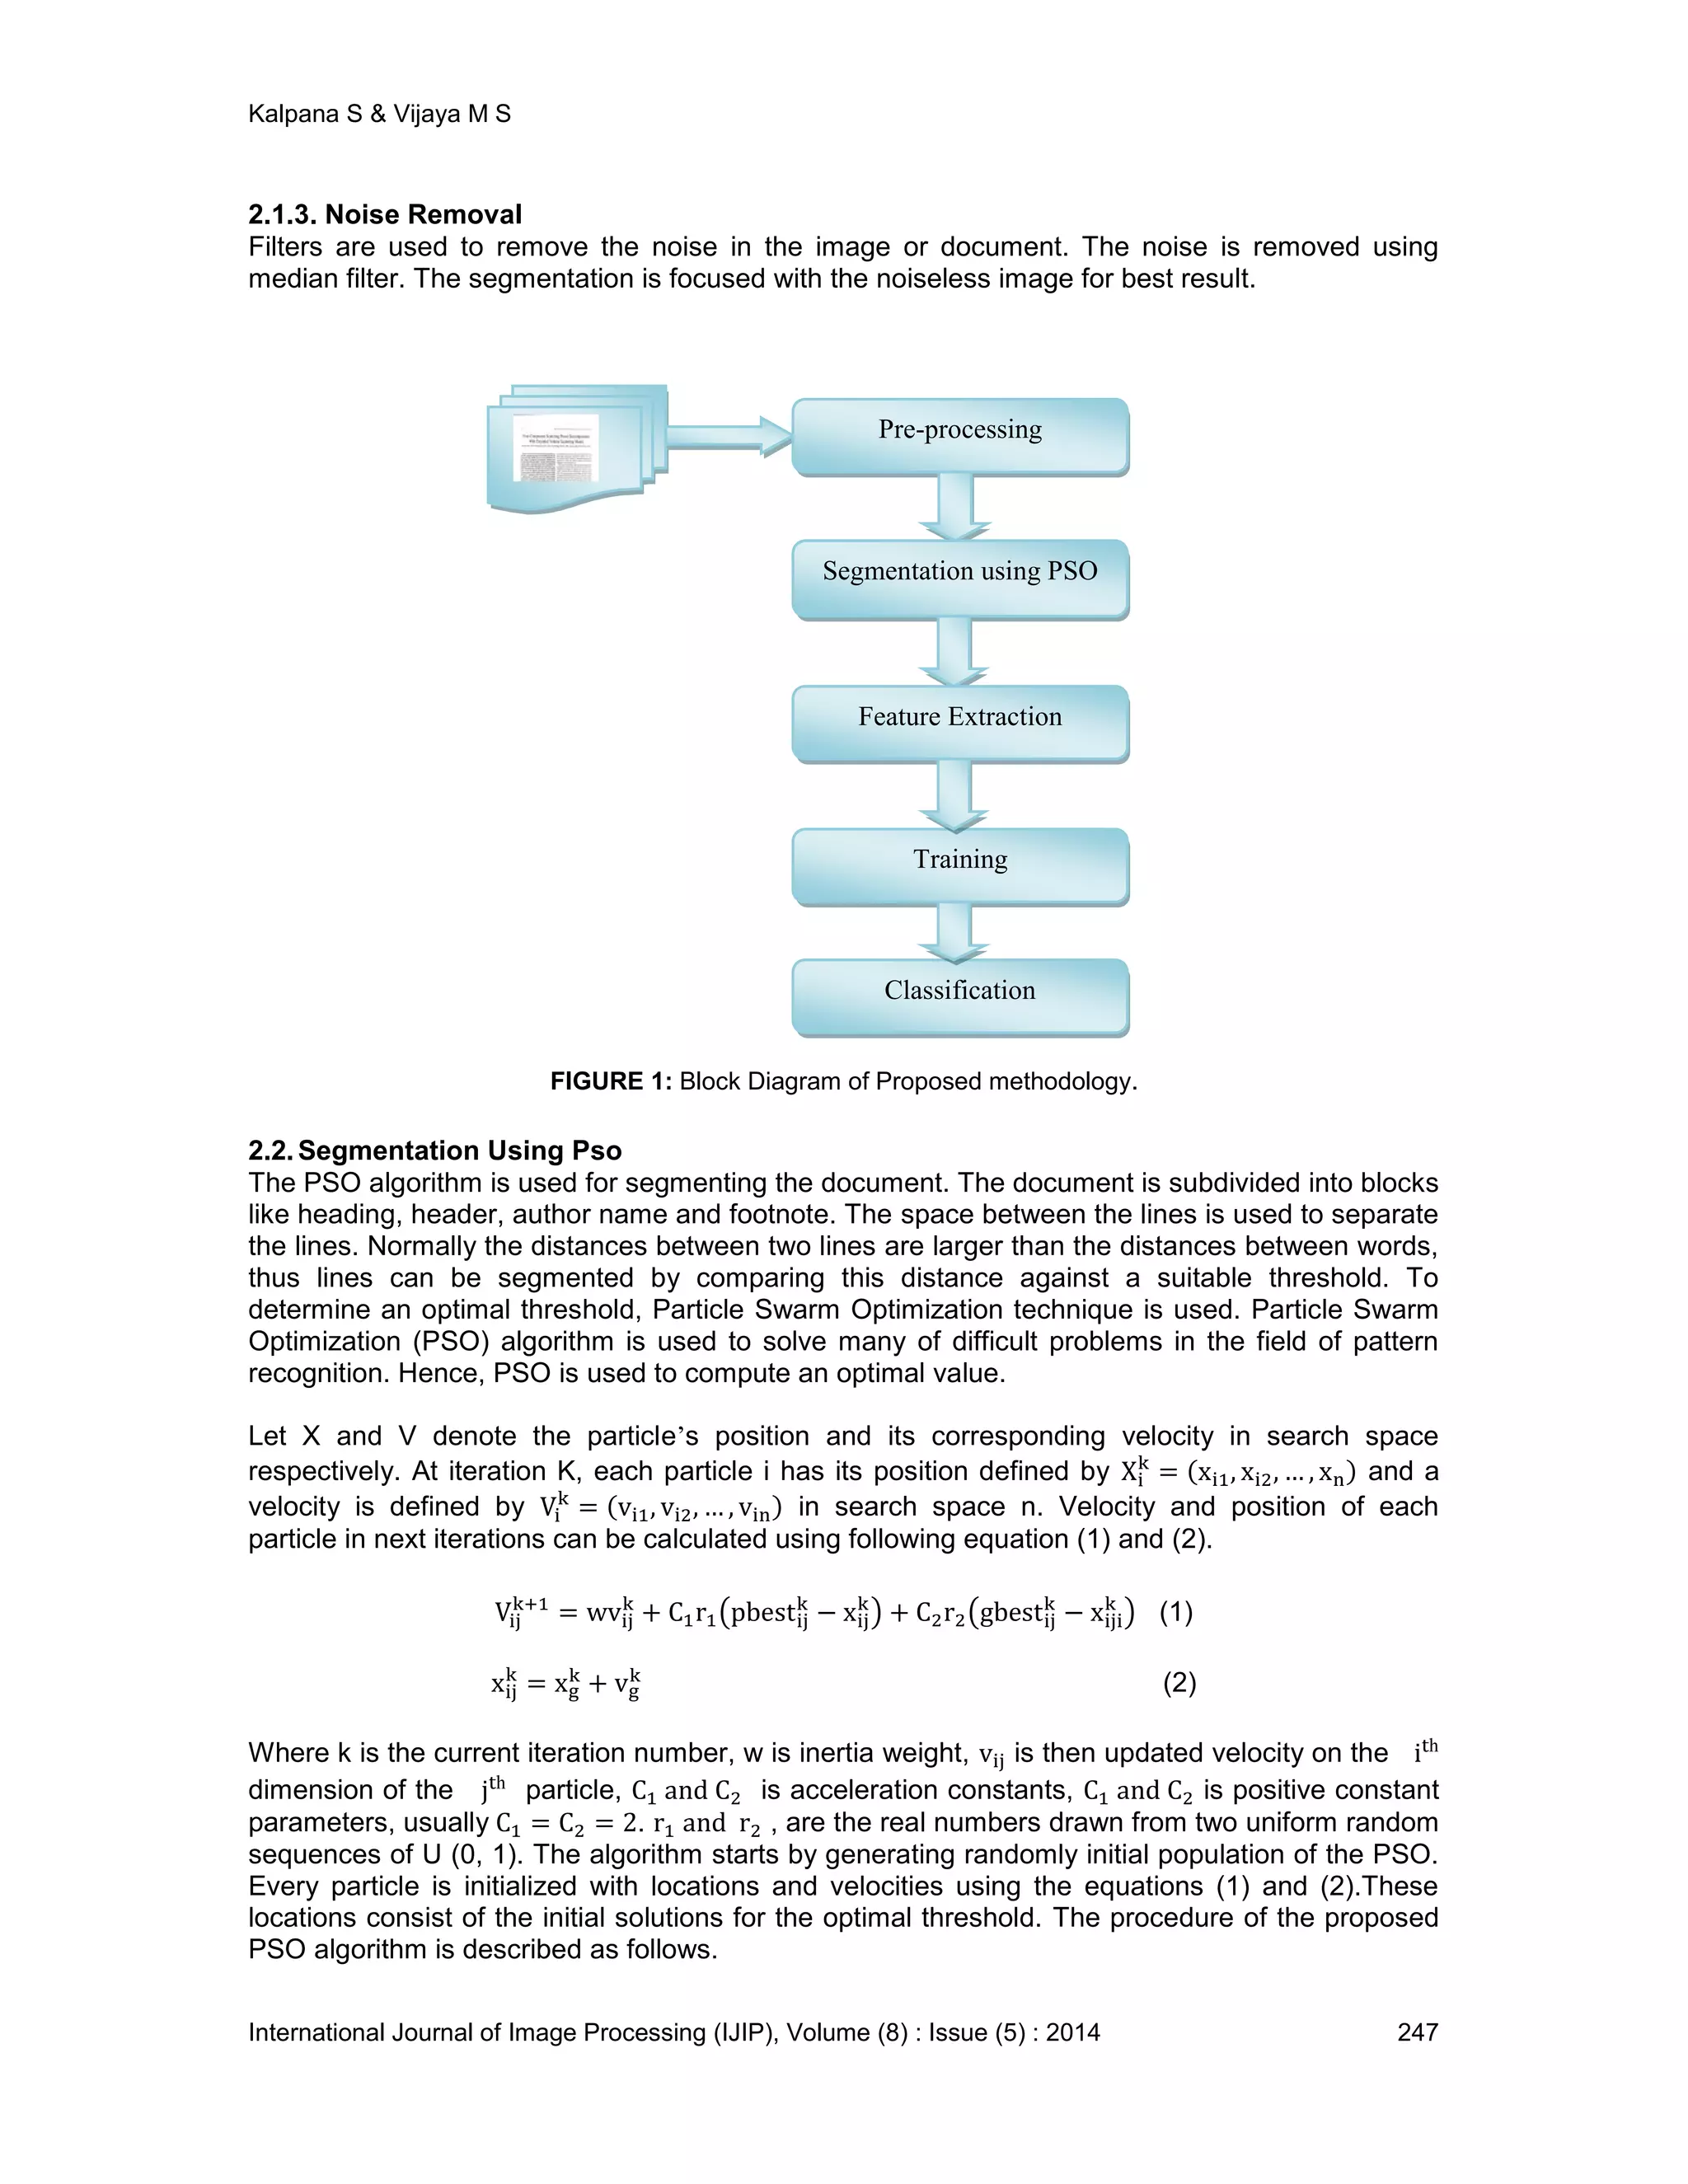
![Kalpana S & Vijaya M S International Journal of Image Processing (IJIP), Volume (8) : Issue (5) : 2014 246 root. The logical objects, which are the subject of extraction in the proposed method, are roughly categorized into the following headlines, headers, footers, captions, notes, and programs, titles, paragraphs, lists, and formulas. Document layout analysis algorithms can be categorized into three approaches namely top-down approaches, bottom-up approaches and hybrid approaches. Top-down algorithms start from the whole document image and iteratively split it into smaller ranges. Bottom-up algorithms start from document image pixels, and cluster the pixels into connected components such as characters which are then clustered into words, lines or zones. Hybrid algorithms can be regarded as a mix of the above two approaches. The Docstrum algorithm was presented in [3], the Voronoi- diagram-based algorithm was proposed in [4] the run-length smearing algorithm was implemented in [5] and the text string separation algorithm is implemented by [6] are typical bottom-up algorithms. The X − Y cut-based algorithm of [7] and the shape-directed-covers-based algorithm [8] are top-down algorithms. In [9] the author proposed a hybrid algorithm using a split- and-merge strategy. The advantage of using top-down approach is, its high speed processing and the drawback is, it cannot process table, improper layout documents and forms. This research work proposes the document segmentation based on logical layout. The segmentation of document image is done using Particle Swarm Optimization (PSO). The document image is segmented as header, heading, footer, author name. From the segmented blocks, features are extracted using Gray Level Co-occurrence Matrix (GLCM), which is the statistical method of examining the textures that considers the spatial relationship of the pixels. Features such as Energy, Entropy Autocorrelation, Contrast, Correlation, Cluster Prominence, Cluster Shade, Dissimilarity, Homogeneity, Maximum probability, Variance, Sum average, Sum variance, Sum entropy, Difference variance, Difference entropy, Information measure of correlation1 and correlation2 are computed. Energy and entropy are renowned properties of an image. Energy identifies the uniformity of the image and entropy identifies the randomness of the image. Finally the classification is performed based on header block of the document image using Extreme Learning Machine. 2. PROPOSED MODEL FOR DOCUMENT SEGMENTATION AND CLASSIFICATION The proposed work aims to segment the document image based on logical layout. For this the documents are collected from five different journals and they are used as the input. First the noise is removed from the given input document image using median filter. The noiseless image is used for segmenting the document using the Particle Swarm optimization (PSO) algorithm and the features are extracted. The features are extracted using Gray Level Co-occurrence Matrix (GLCM). At last, the classification of journals based on the header block is carried out by using Extreme Learning Machine and Support Vector Machine. The overview of the proposed work is shown in Fig.1. 2.1. Pre-processing Pre-processing is a sequence of tasks performed on the image. It enhances the quality of the image for segmentation. The various tasks performed on the image in pre-processing stage are scanning of documents, binarization and noise removal. 2.1.1. Scanning of Documents The documents are collected from various journals and only the first page of each document is scanned. They are stored in the database and used as input image. 2.1.2. Binarization It is a process which converts the gray scale image into a binary image using the global threshold method. A binary image has only two values 0 or 1 for each pixel. 0 represents white pixel and 1 represents black.](https://image.slidesharecdn.com/ijip-901-151224134234/75/Header-Based-Classification-of-Journals-Using-Document-Image-Segmentation-and-Extreme-Learning-Machine-2-2048.jpg)
![Kalpana S & Vijaya M S International Journal of Image Processing (IJIP), Volume (8) : Issue (5) : 2014 249 FIGURE 3: Labeling Connected Components. 2.3.Feature Extraction Features such as Energy, Entropy Autocorrelation, Contrast, Correlation, Cluster Prominence, Cluster Shade, Dissimilarity, Homogeneity, Maximum probability, Variance, Sum average, Sum variance, Sum entropy, Difference variance, Difference entropy, Information measure of correlation1 and correlation2 are computed for classification of document region[10]. Few of the common statistics applied to co-occurrence probabilities are discussed below. 1) Energy This is also called uniformity or angular second moment. It measures the textural uniformity that is pixel pair repetitions. It detects disorders in textures. Energy reaches a maximum value equal to one. 2) Entropy This statistic measures the disorder or complexity of an image. The entropy is larger when the image is not texturally uniform and many GLCM elements have very small values. Complex textures tend to have high entropy. 3) Contrast It measures the spatial frequency of an image and difference moment of GLCM. It is the difference between the highest and the lowest values of a contiguous set of pixels. It measures the amount of local variation present in the image. 4) Variance It is a measure of heterogeneity and is strongly correlated to first order statistical variable such as standard deviation. Variance increases when the gray level values differ from their mean. 5) Homogeneity If weights decrease away from the diagonal, the result will be larger for windows with little contrast. Homogeneity weights values by the inverse of the contrast weight, with weights decreasing exponentially away from the diagonal. 6) Correlation The correlation feature is a measure of gray tone linear dependencies in the image. GLCM correlation is quite a different calculation from the other texture measures. It also has a more intuitive meaning to the actual calculated values: 0 is uncorrelated, 1 is perfectly correlated.](https://image.slidesharecdn.com/ijip-901-151224134234/75/Header-Based-Classification-of-Journals-Using-Document-Image-Segmentation-and-Extreme-Learning-Machine-5-2048.jpg)
![Kalpana S & Vijaya M S International Journal of Image Processing (IJIP), Volume (8) : Issue (5) : 2014 252 block 19 features are extracted using GLCM. The dataset is then trained using ELM based on the header block for the classification of journals and it is compared with SVM classifier for predictive accuracy. The prediction accuracy and learning time of the ELM is observed. The function elm_train is used to train the model by identifying elm type, number of hidden neurons and activation function as parameters. The elm_predict function is used to test the model as [output] = elm_predict (TestingData_File). To calculate the accuracy the whole testing data is used. Based on the accuracy and the learning time the performance evaluation of the proposed work is obtained. The classification result of ELM gives the list of document headings in the specific folder based on the header block of the input image. The accuracy of ELM is evaluated using the following formula and achieved 82.3% accuracy. Accuracy = To compare with ELM the second experiment is carried out using the same dataset and the classification algorithm SVM is trained using the same dataset to create the classifier. The accuracy of the SVM classifier is tested using the same test dataset and the classification results are obtained as 64.7% accuracy.It is observed from the results that the performance of the model built based on Extreme Learning Machine for classification of segmented document image is more accurate and fast compared to Support Vector Machine. Comparative results of Support Vector Machine and Extreme Learning Machine are summarized in Table I. The comparative results in terms of accuracy and learning time of both classifiers are shown in Figure.4 and Figure.5 respectively. Classifiers Learning Time (seconds) Accuracy (%) SVM 15.29 64.7 ELM 13.35 82.3 TABLE 1: Comparative Results of the Classifiers. FIGURE 4: Comparison - Accuracy of Classifiers. 0 20 40 60 80 100 SVM ELM Accuracy (%) Accuracy (%)](https://image.slidesharecdn.com/ijip-901-151224134234/75/Header-Based-Classification-of-Journals-Using-Document-Image-Segmentation-and-Extreme-Learning-Machine-8-2048.jpg)
![Kalpana S & Vijaya M S International Journal of Image Processing (IJIP), Volume (8) : Issue (5) : 2014 253 FIGURE 5: Comparison - Learning Time of Classifiers. 5. CONCLUSION This paper demonstrates the modeling of document segmentation and classification task that describes the implementation of machine learning approach for segmenting the document into various regions. The corpus is created by collecting the documents from five different journals and stored in the database. These documents are pre-processed to remove the noise using median filter. The pre-processed documents are segmented into various blocks such as heading, header, author name and footer using Particle Swarm Optimization algorithm. From each header block the features are extracted and the training dataset is created. Finally classification based on header blocks is done using supervised classification algorithms namely ELM and SVM. The performance of both classifiers is evaluated in terms of accuracy and learning time. It has been observed that ELM technique shows better performance than SVM technique for document image classification. Future work of segmentation can be extended by detecting images, postal codes, handwritten and printed documents with more features. 6. REFERENCES [1] Okun O. Doermann D and M. Pietikainen. “Page segmentation and zone classification”. The state of the art. In UMD, 1999. [2] Yuan. Y. Tang and M. Cheriet, Jiming Liu, J.N Said, “Document Analysis and recognition by computers”. [3] L. O. Gorman, “The document spectrum for page layout analysis,” IEEE Transactions on Pattern Analysis and Machine Intelligence 15, pp. 1162–1173, 1993. [4] K. Kise, A. Sato, and M. Iwata, “Segmentation of page images using the area Voronoi diagram,” Computer Vision and Image Understanding 70, pp. 370–382, 1998. [5] Wahl. K. Wong, and R. Casey, “Block segmentation and text extraction in mixed text/image documents,” Graphical Models and Image Processing 20, pp. 375–390, 1982. [6] L. A. Fletcher and R. Kasturi, “A robust algorithm for text string separation from mixed text/graphics images,” IEEE Transactions on Pattern Analysis and Machine Intelligence 10, pp. 910–918, 1988. [7] Nagy, S. Seth, and M. Viswanathan, “A prototype document image analysis system for technical journals,” Computer 25, pp. 10–22, 1992. [8] S. Baird, S. E. Jones, and S. J. Fortune, “Image segmentation by shape-directed covers,” in Proceedings of International Conference on Pattern Recognition, pp. 820–825, (Atlantic City, NJ), June 1990. [9] T. Pavlidis and J. Zhou, “Page segmentation and classification,” Graphical Models and Image Processing 54, pp. 484–496, 1992. 12 13 14 15 16 SVM ELM Learning Time (seconds) Learning Time (seconds)](https://image.slidesharecdn.com/ijip-901-151224134234/75/Header-Based-Classification-of-Journals-Using-Document-Image-Segmentation-and-Extreme-Learning-Machine-9-2048.jpg)
![Kalpana S & Vijaya M S International Journal of Image Processing (IJIP), Volume (8) : Issue (5) : 2014 254 [10] Haralick R.M., Shanmugam K., Dinstein I., “Textural Features for Image Classification”, IEEE Trans. on System Man and Cybernetics, 1973, 3(6), p.610-621. [11] Santanu Chaudhury, Megha Jindal, and Sumantra Dutta Roy, “Model-Guided Segmentation and Layout Labeling of Document Images using a Hierarchical Conditional Random Field”, New Delhi, India. [12] Jianying Hu, Ramanujan Kashi, Gordon Wilfong, “Document Classification using Layout Analysis”, USA. [13] Gerd Maderlechner, Angela Schreyer and Peter Suda, “Information Extraction from Document Images using Attention Based Layout Segmentation”, Germany. [14] Y. Ishitani. Document layout analysis based on emergent computation. Proc. 4th ICDAR, 1:45–50, 1997. [15] K. T. Spoehr. Visual information processing. W. H. Freeman and Company, 1982. [16] Robert M. Haralick,”Document image Understanding: Geometric and Logical layout”, University of Washington, Seattle. [17] ISO: 8613: Information Processing-Text and Office Systems-Office, Document Architecture (ODA) and Interchange Format, International Organization for Standardization, 1989. [18] Y. Ishitani. Logical structure analysis of document images based on emergent computation. Proc. 5th ICDAR, 1999. [19] Esposito, F., Malerba, D., Francesca, Lisi, F.A., Ras, W.: Machine learning for intelligent processing of printed documents. Journal of Intelligent Information Systems 14 (2000) 175–198. [20] M. Krishnamoorthy, G. Nagy, S. Seth, and M. Viswanathan, “Syntactic segmentation and labeling of digitized pages from technical journals,” IEEE Transactions on Pattern Analysis and Machine Intelligence 15, pp. 737–747, 1993.](https://image.slidesharecdn.com/ijip-901-151224134234/75/Header-Based-Classification-of-Journals-Using-Document-Image-Segmentation-and-Extreme-Learning-Machine-10-2048.jpg)