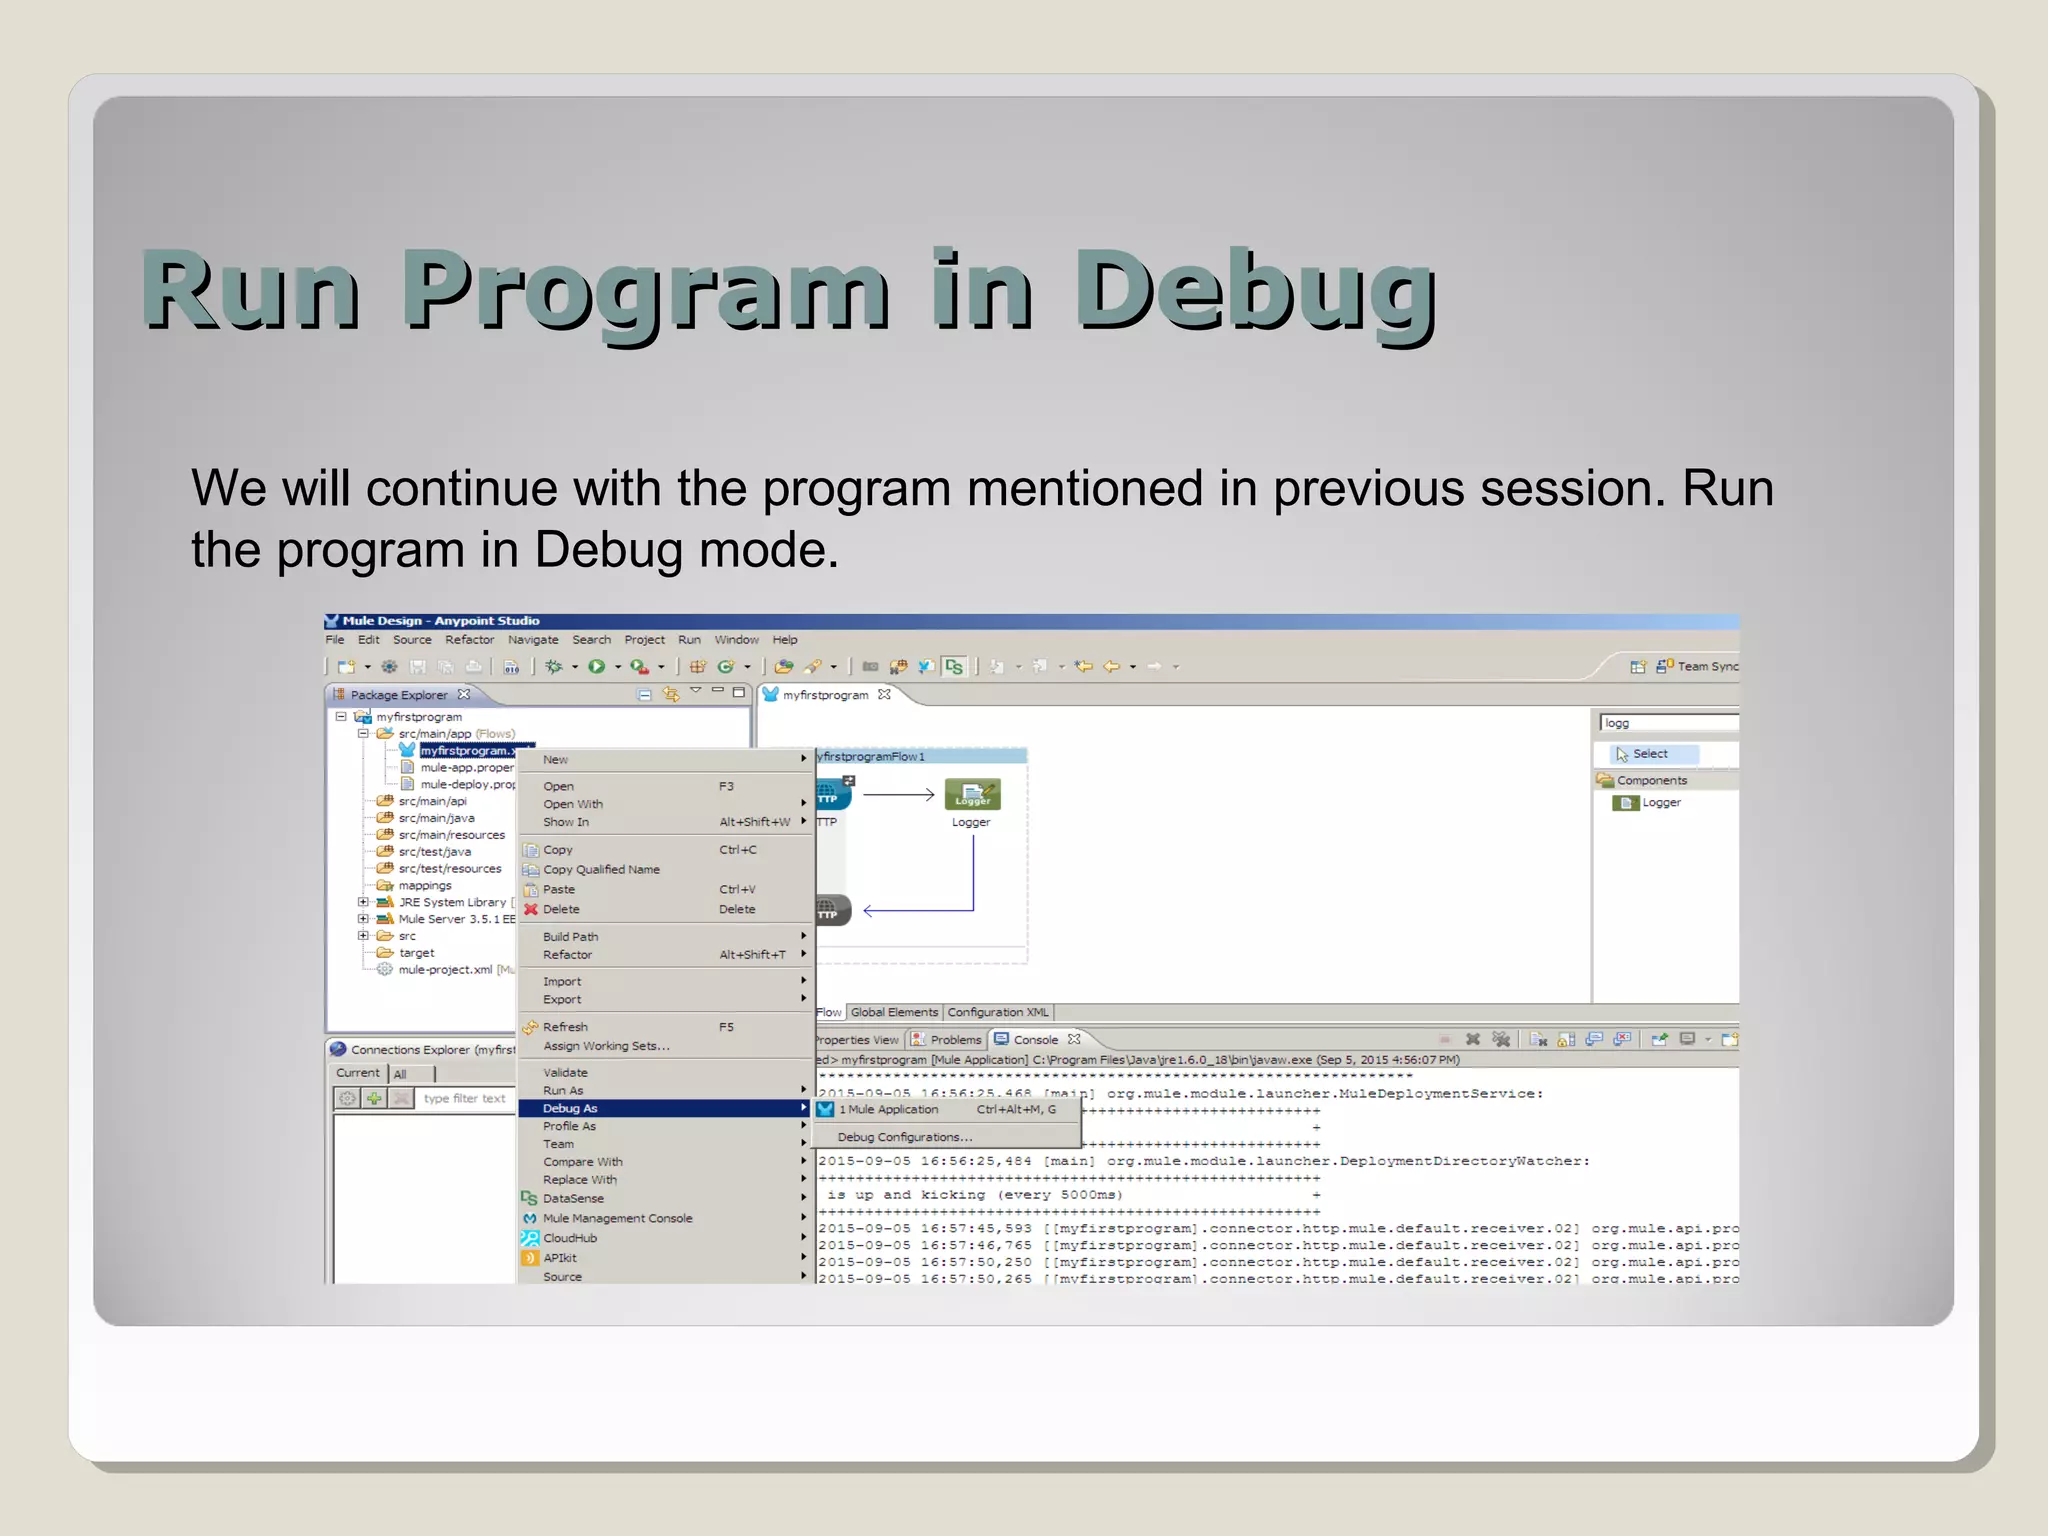
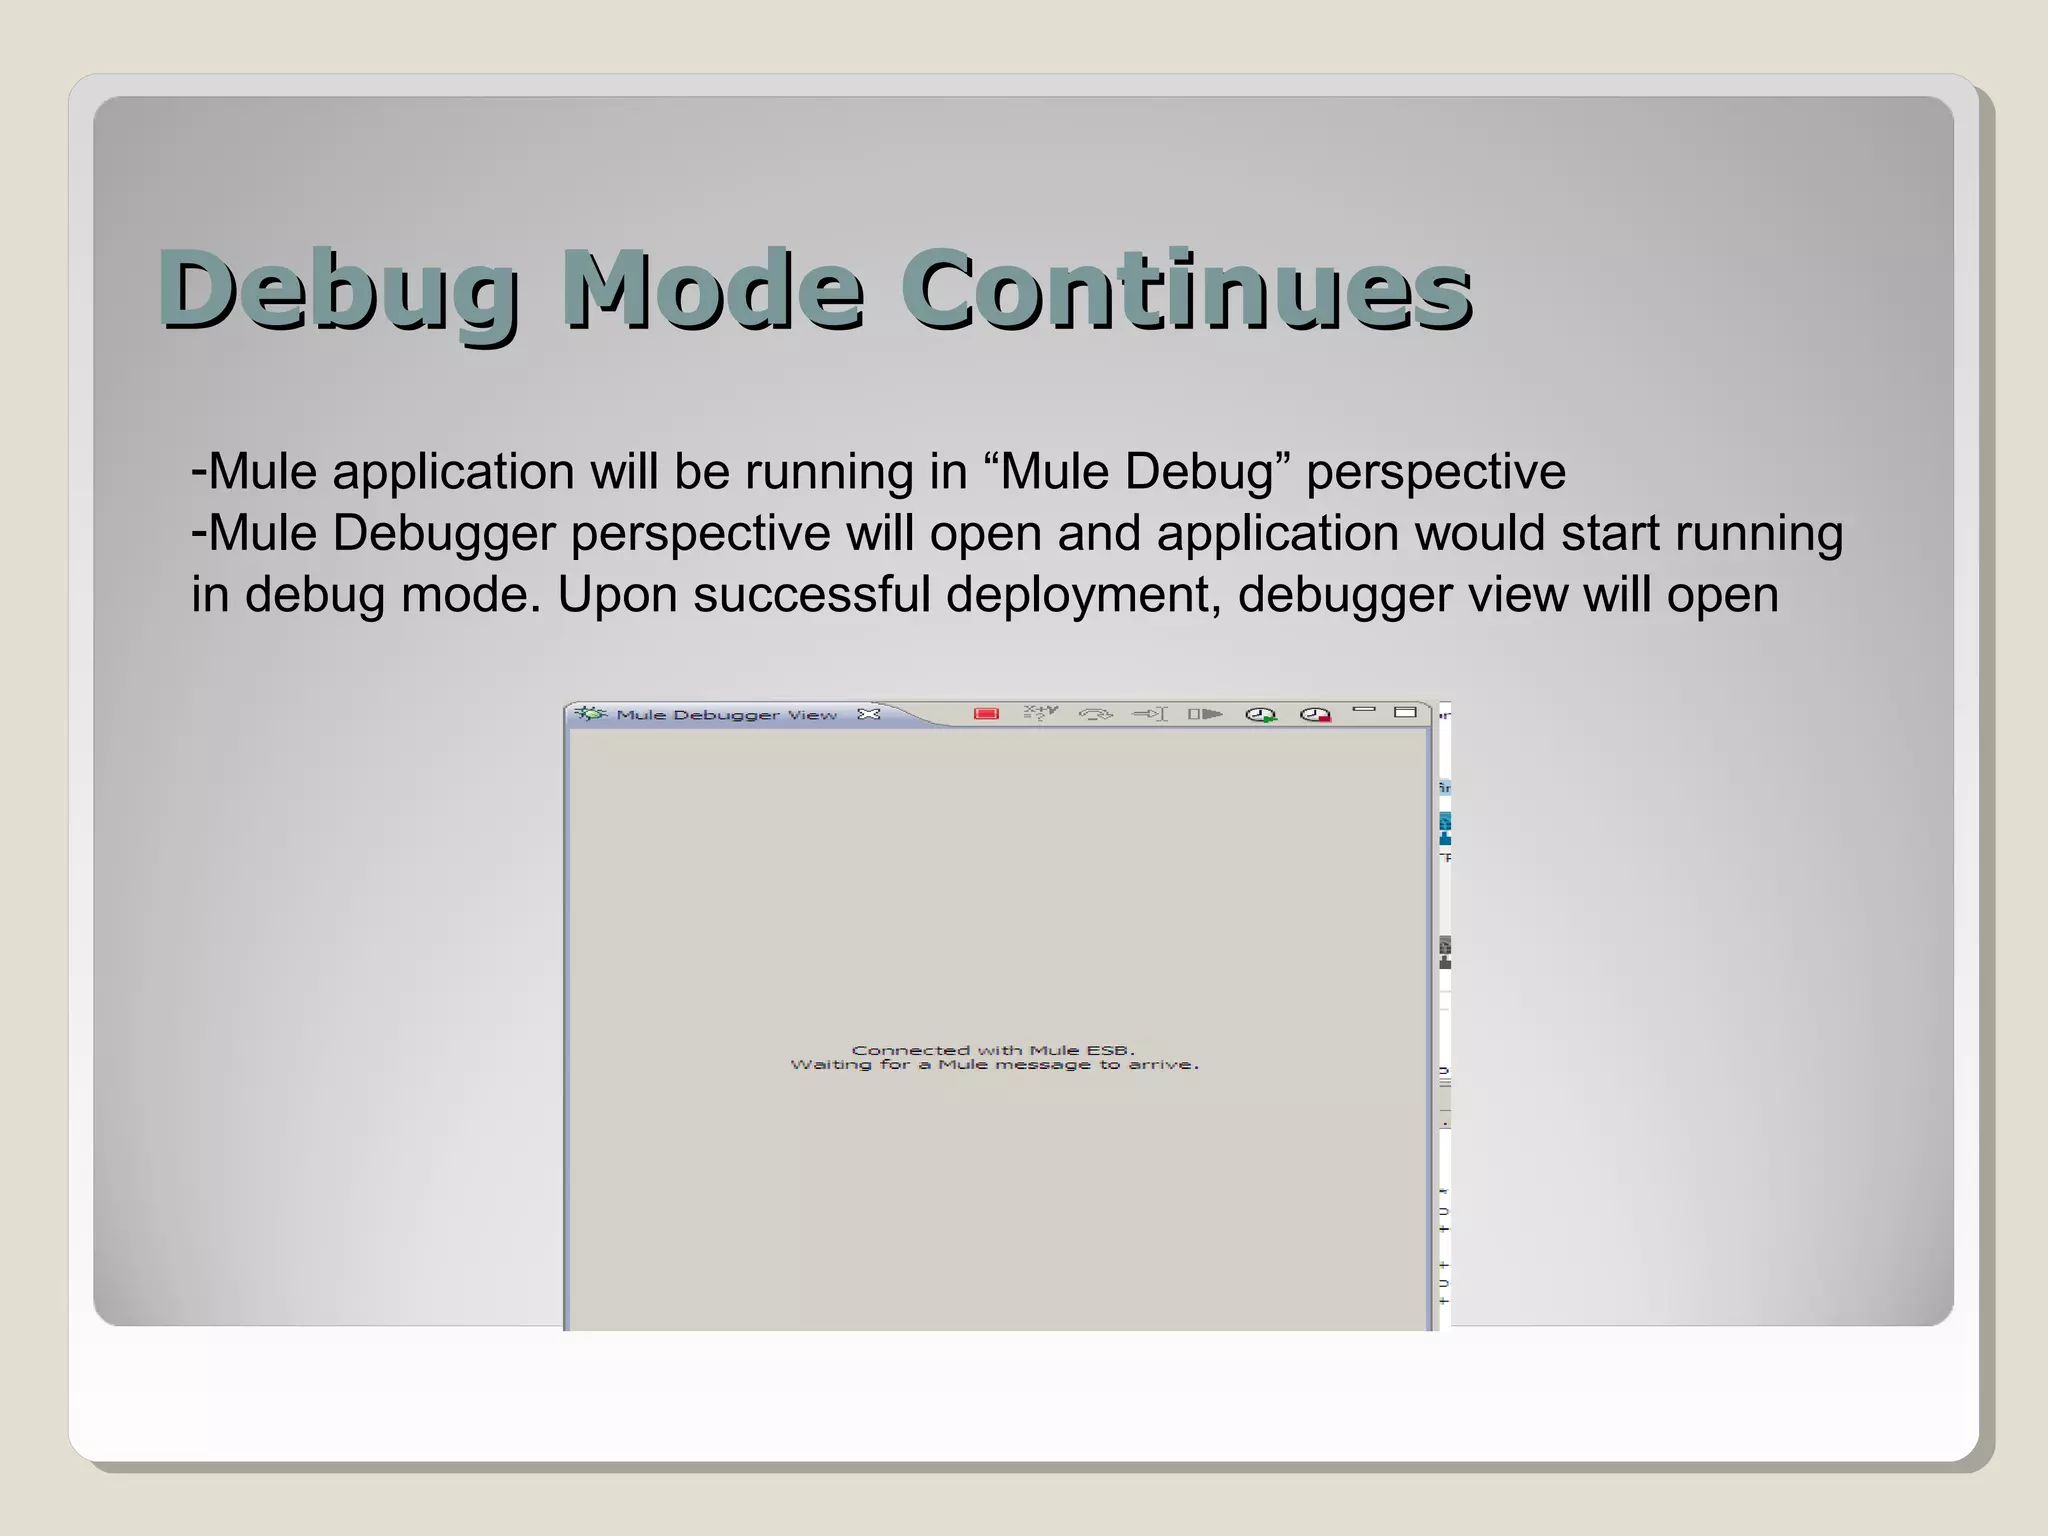
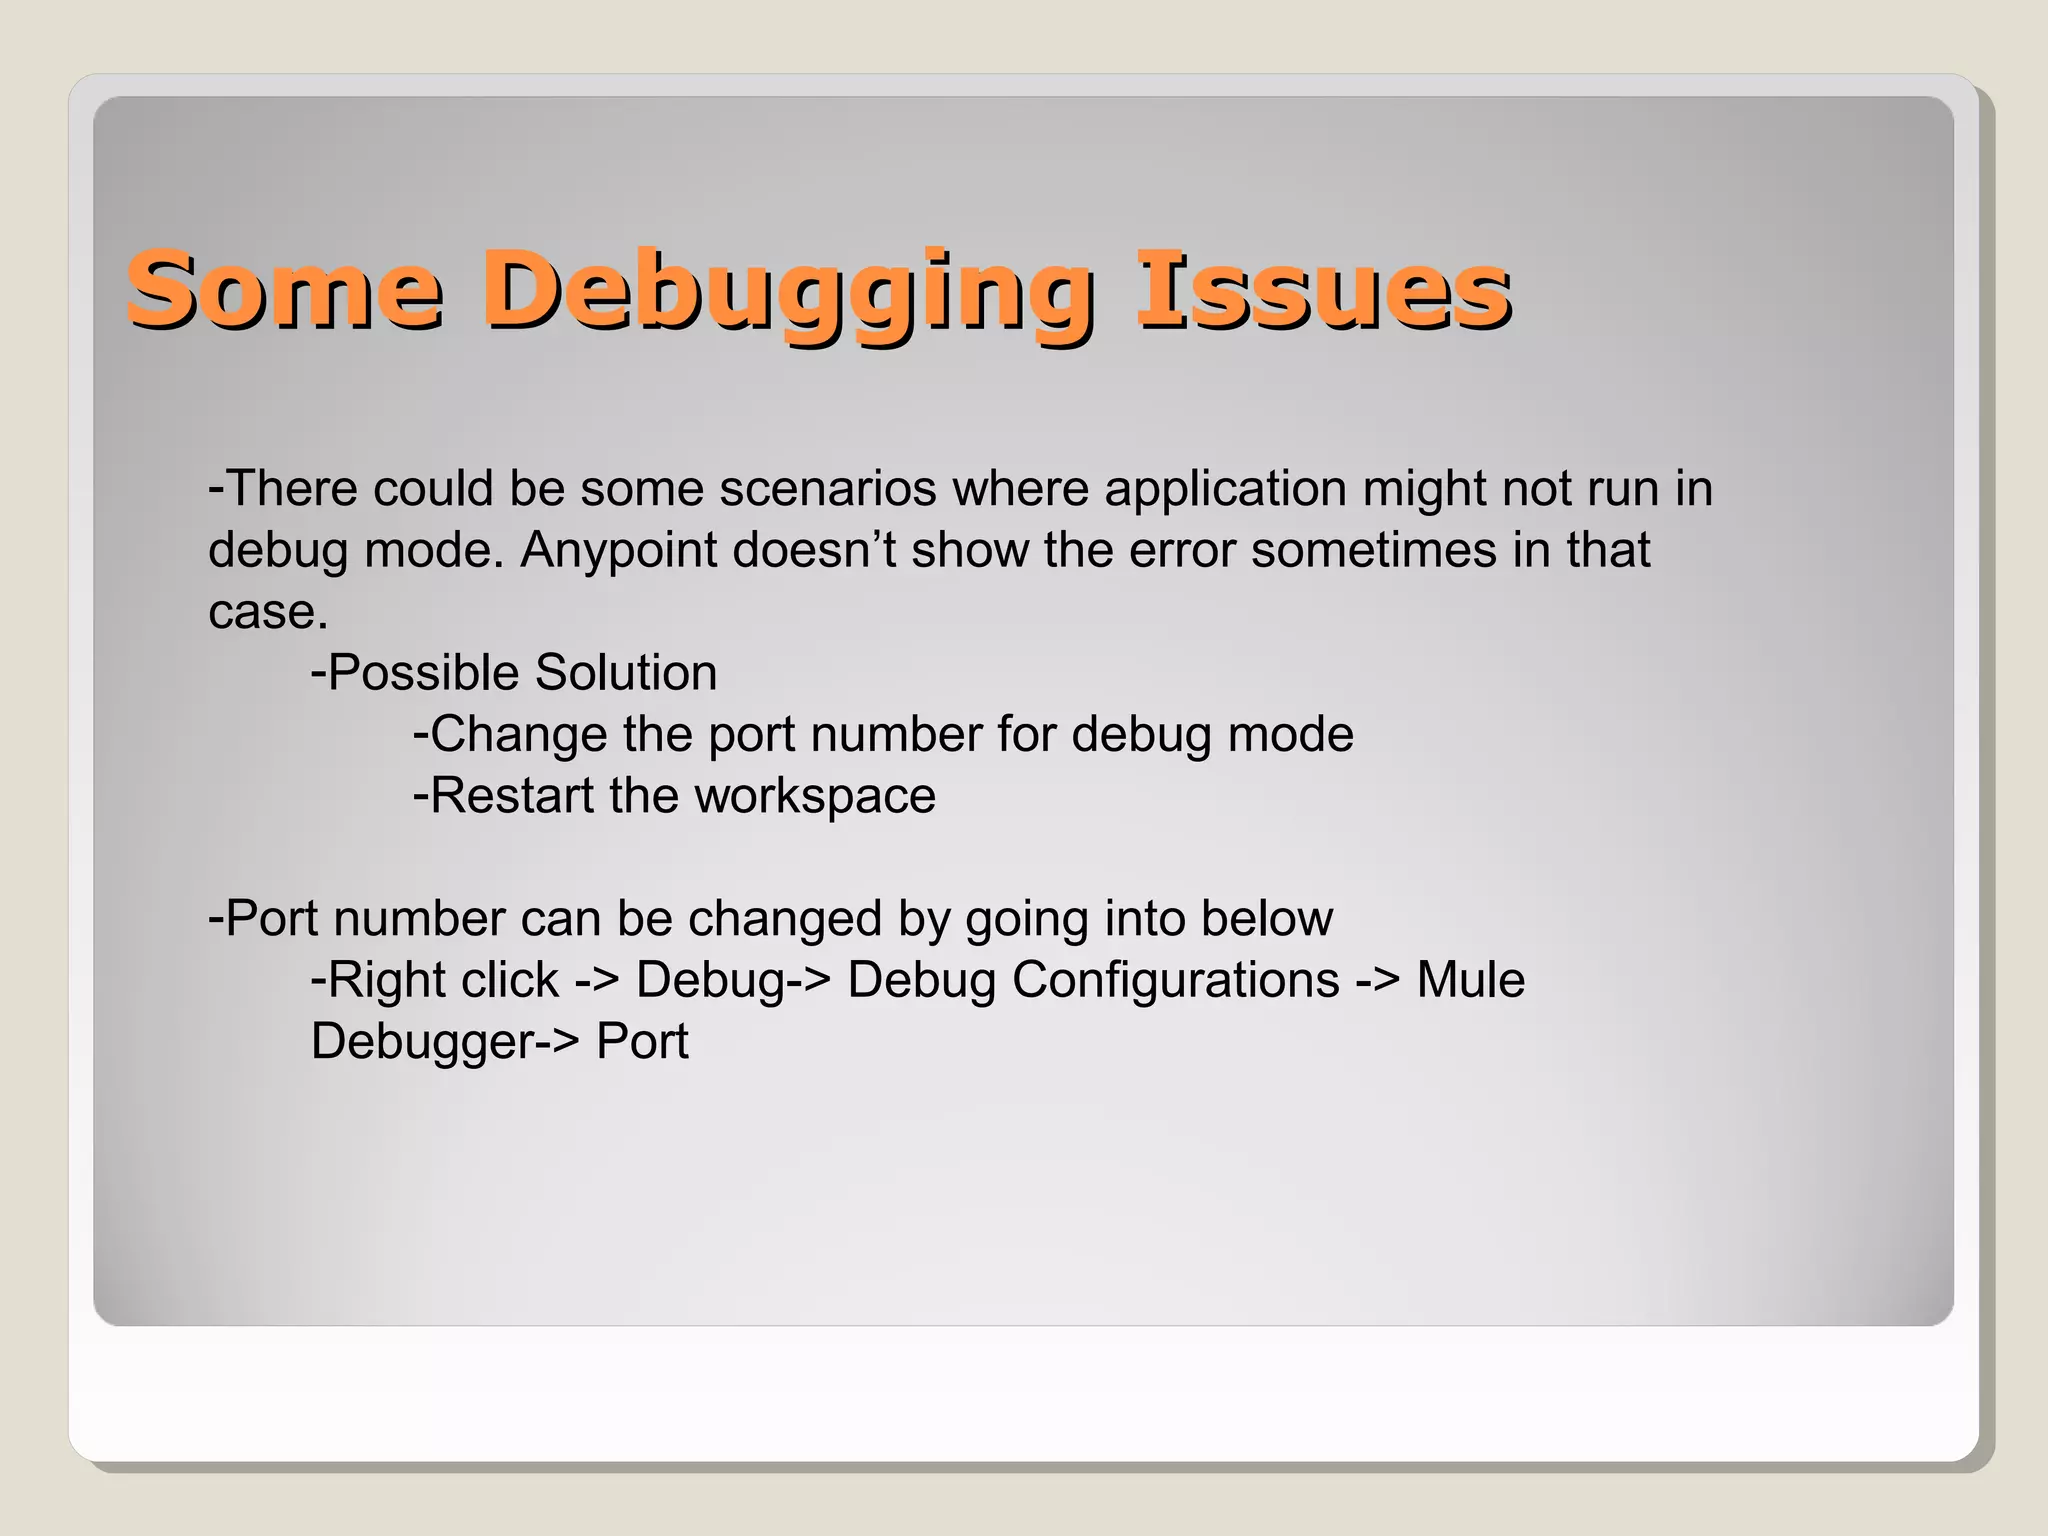
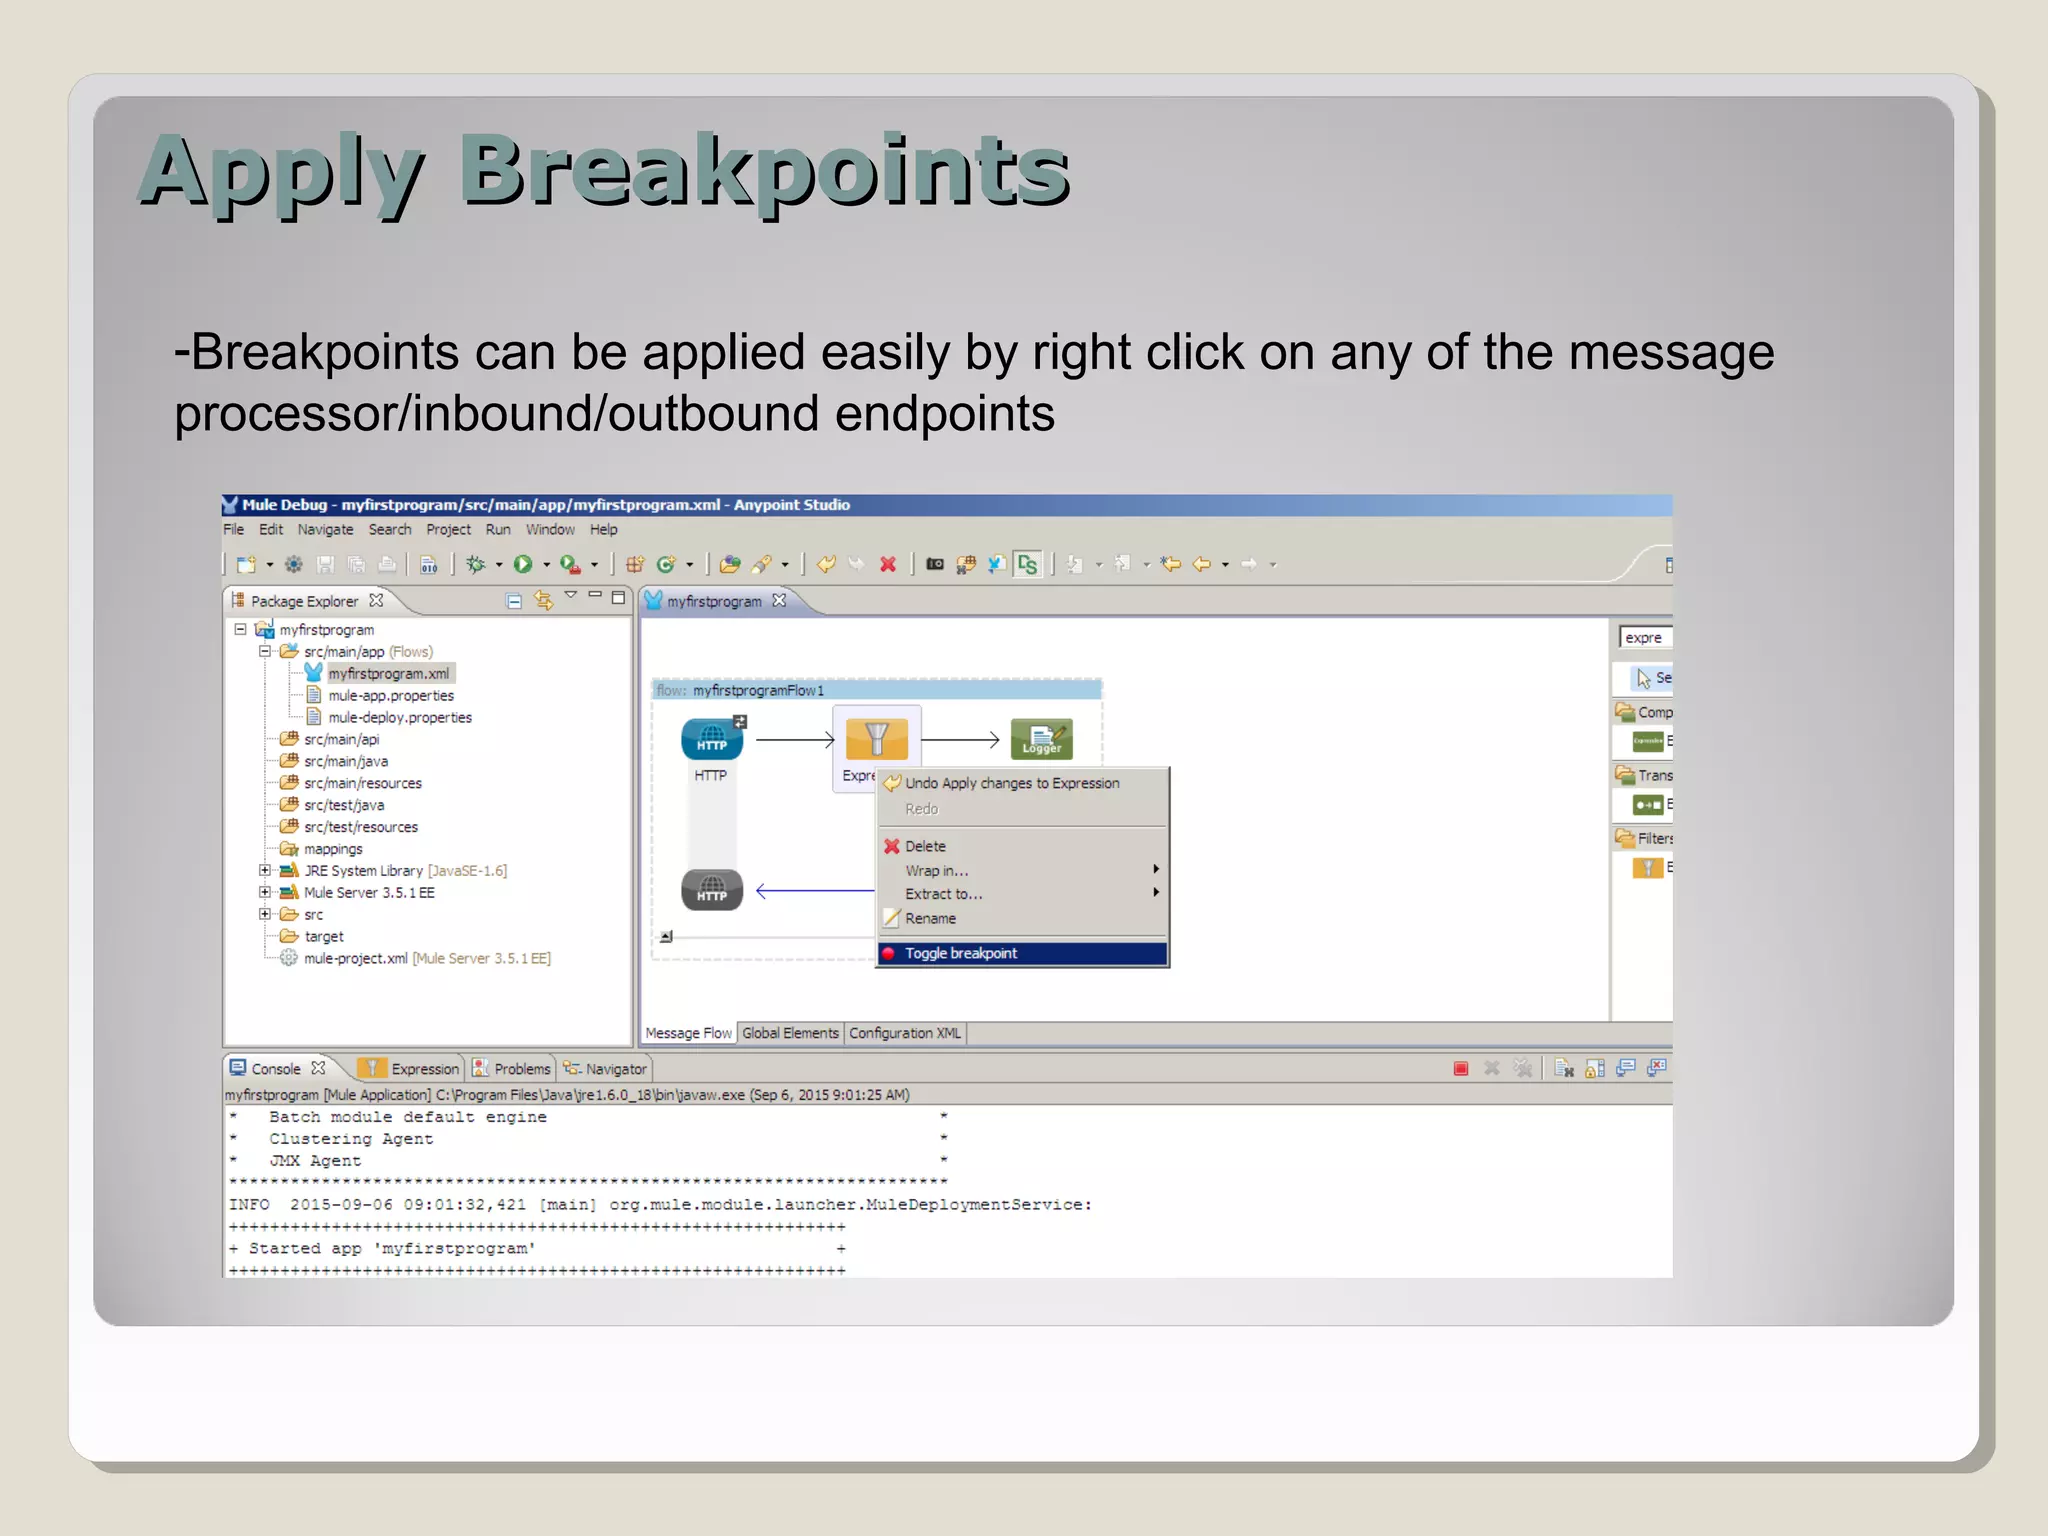
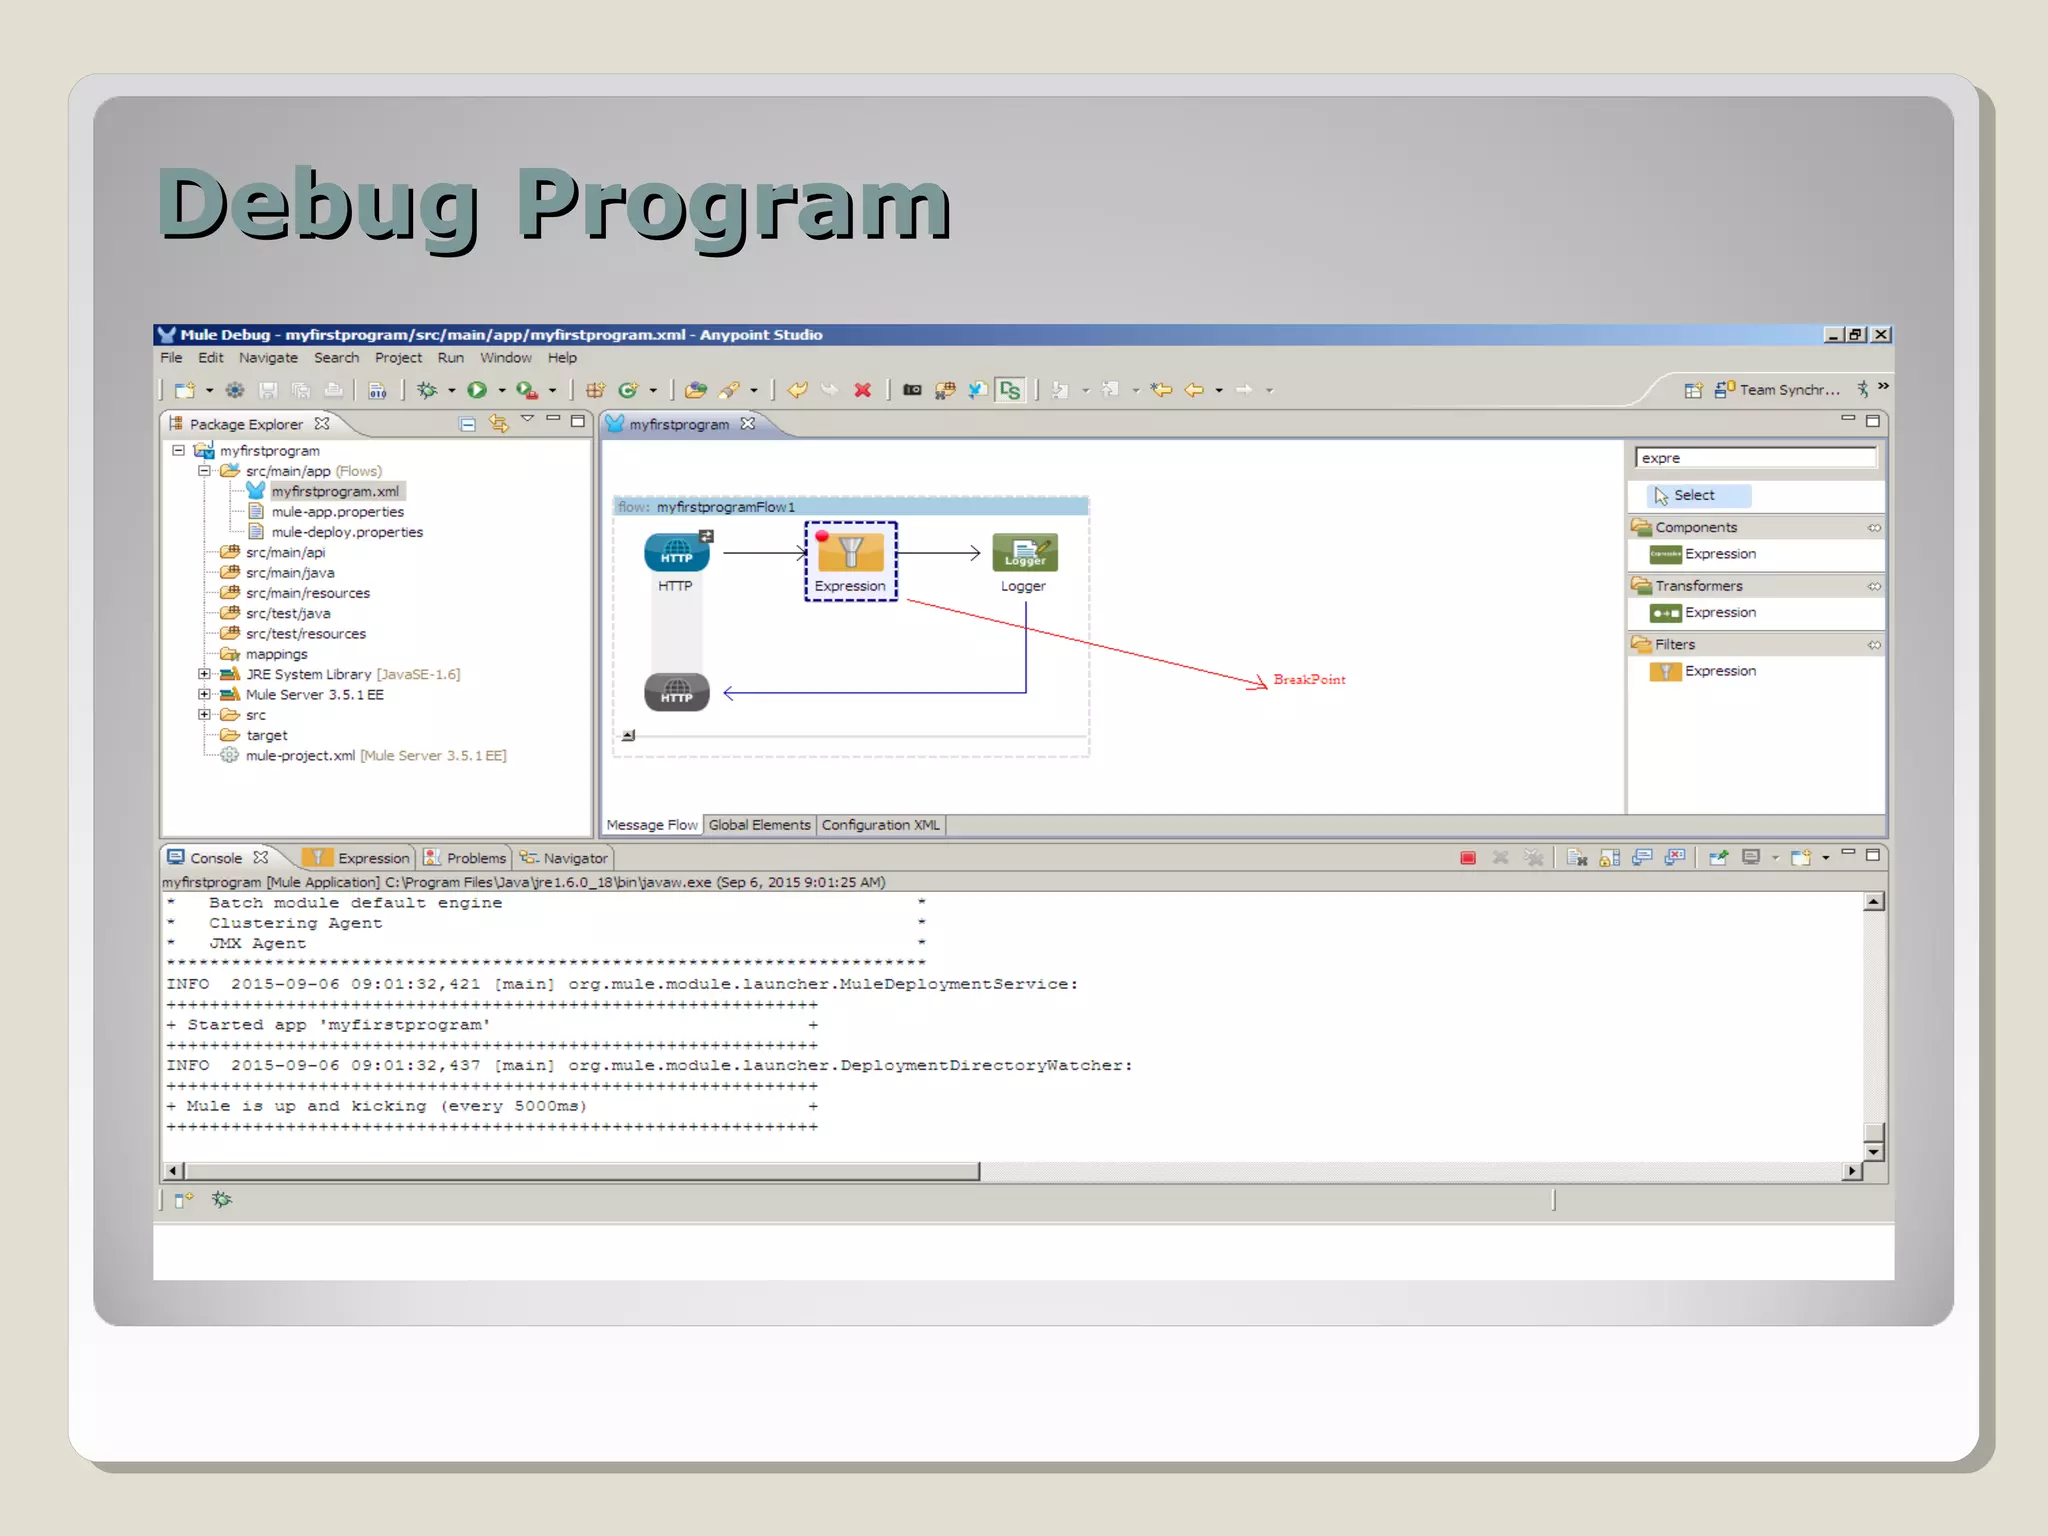
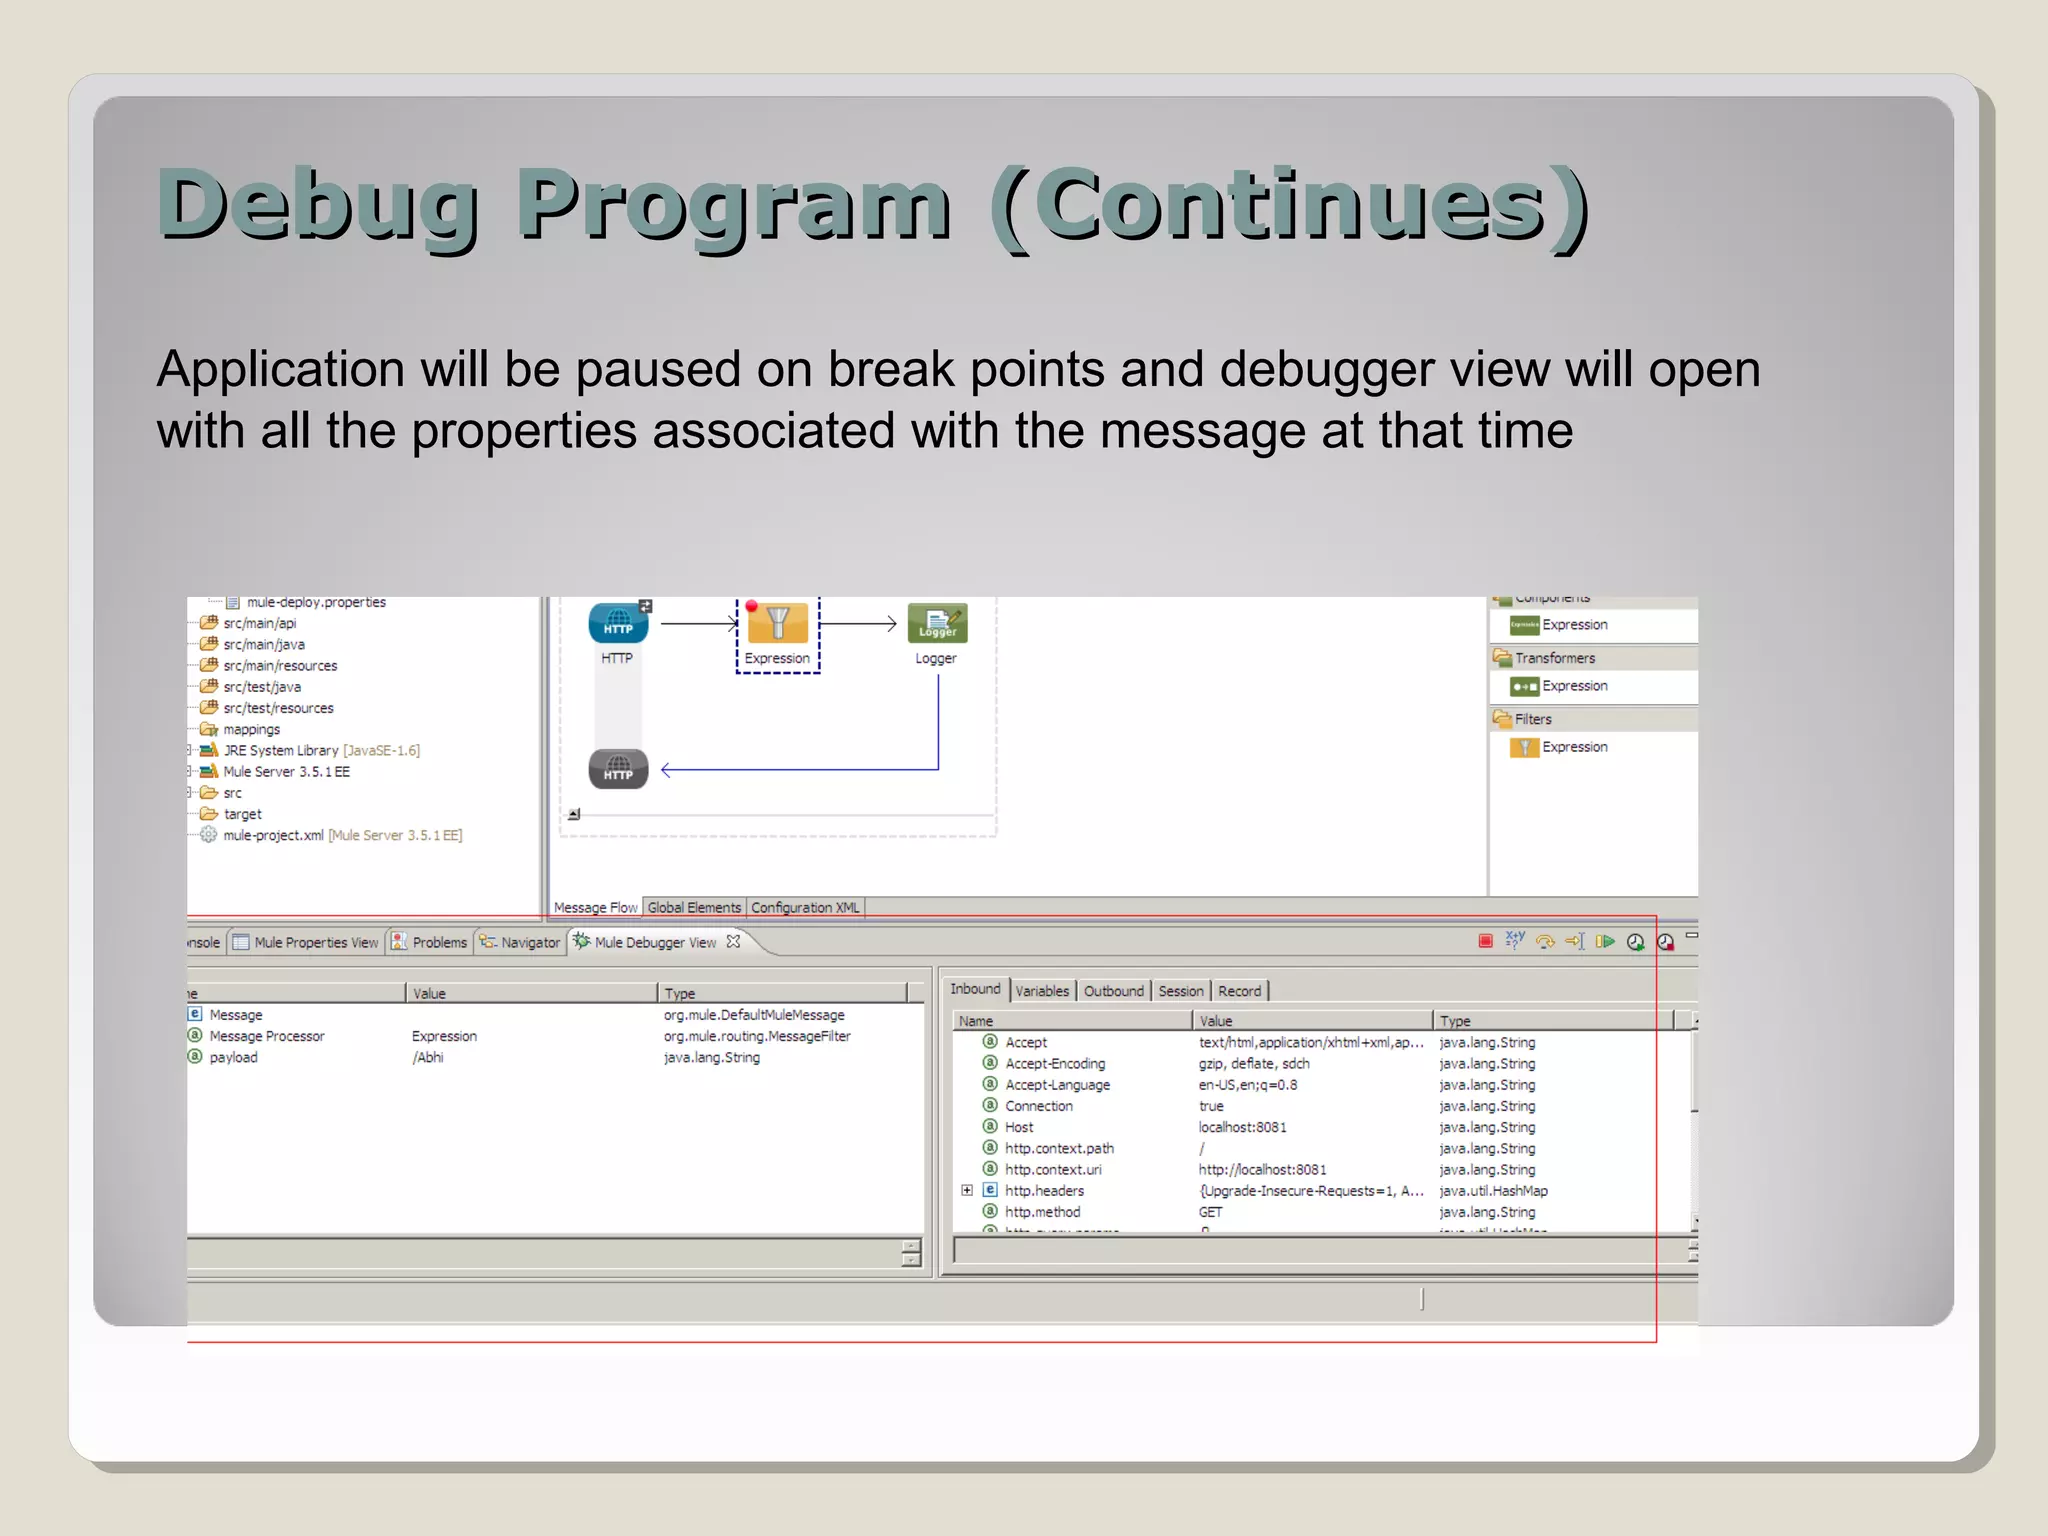
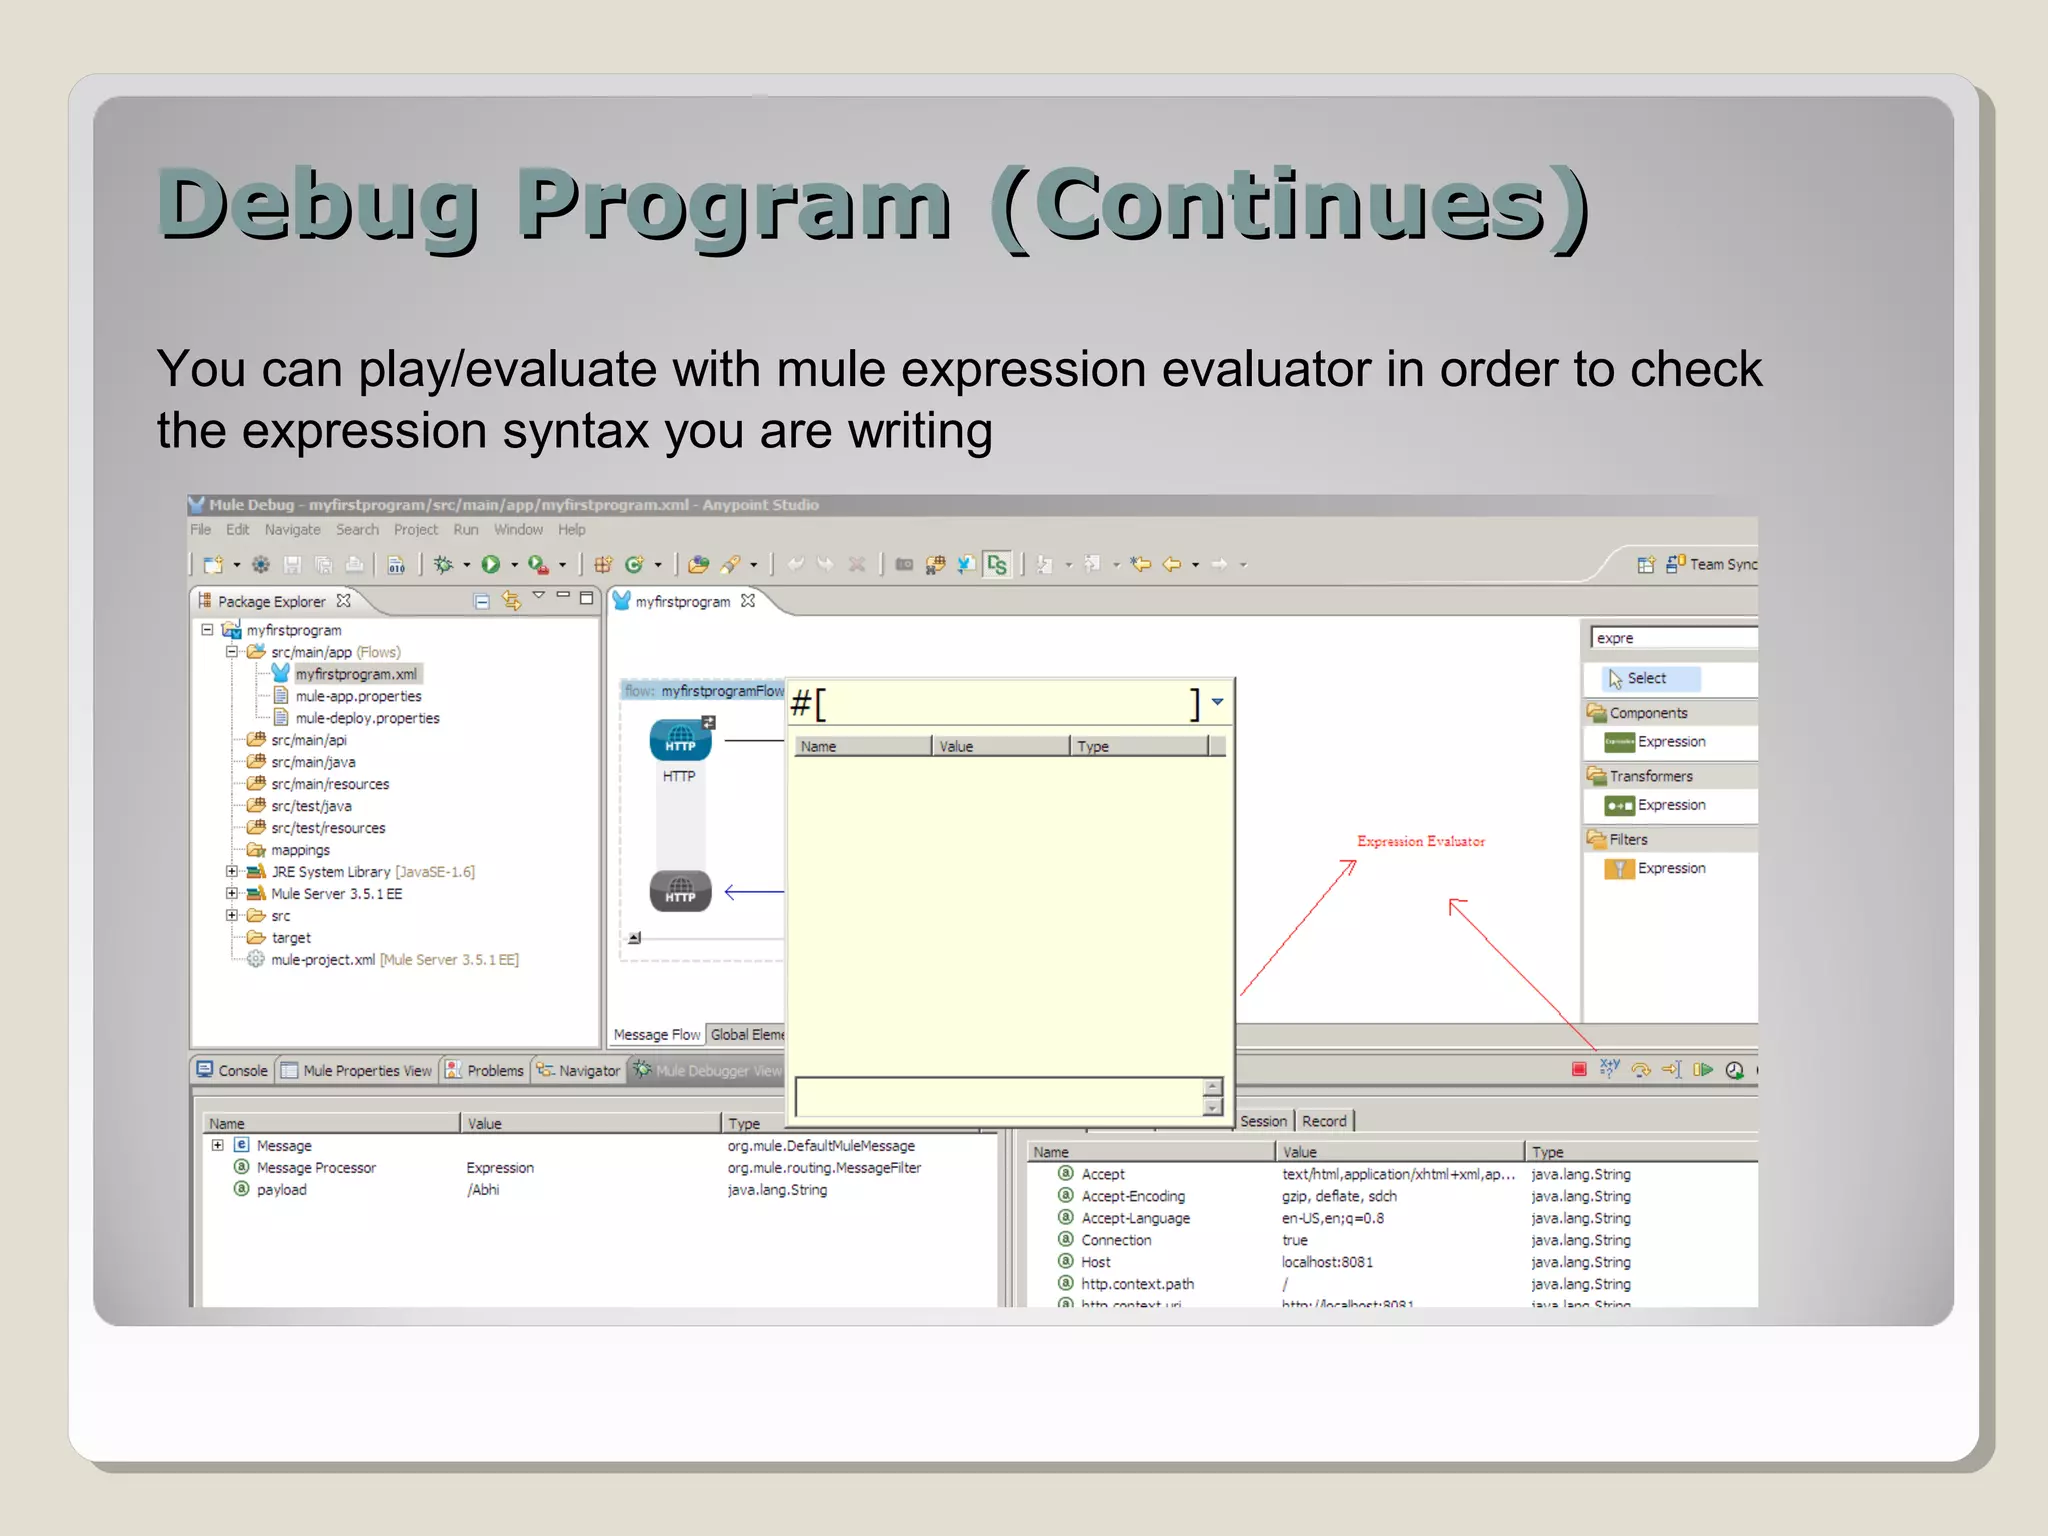
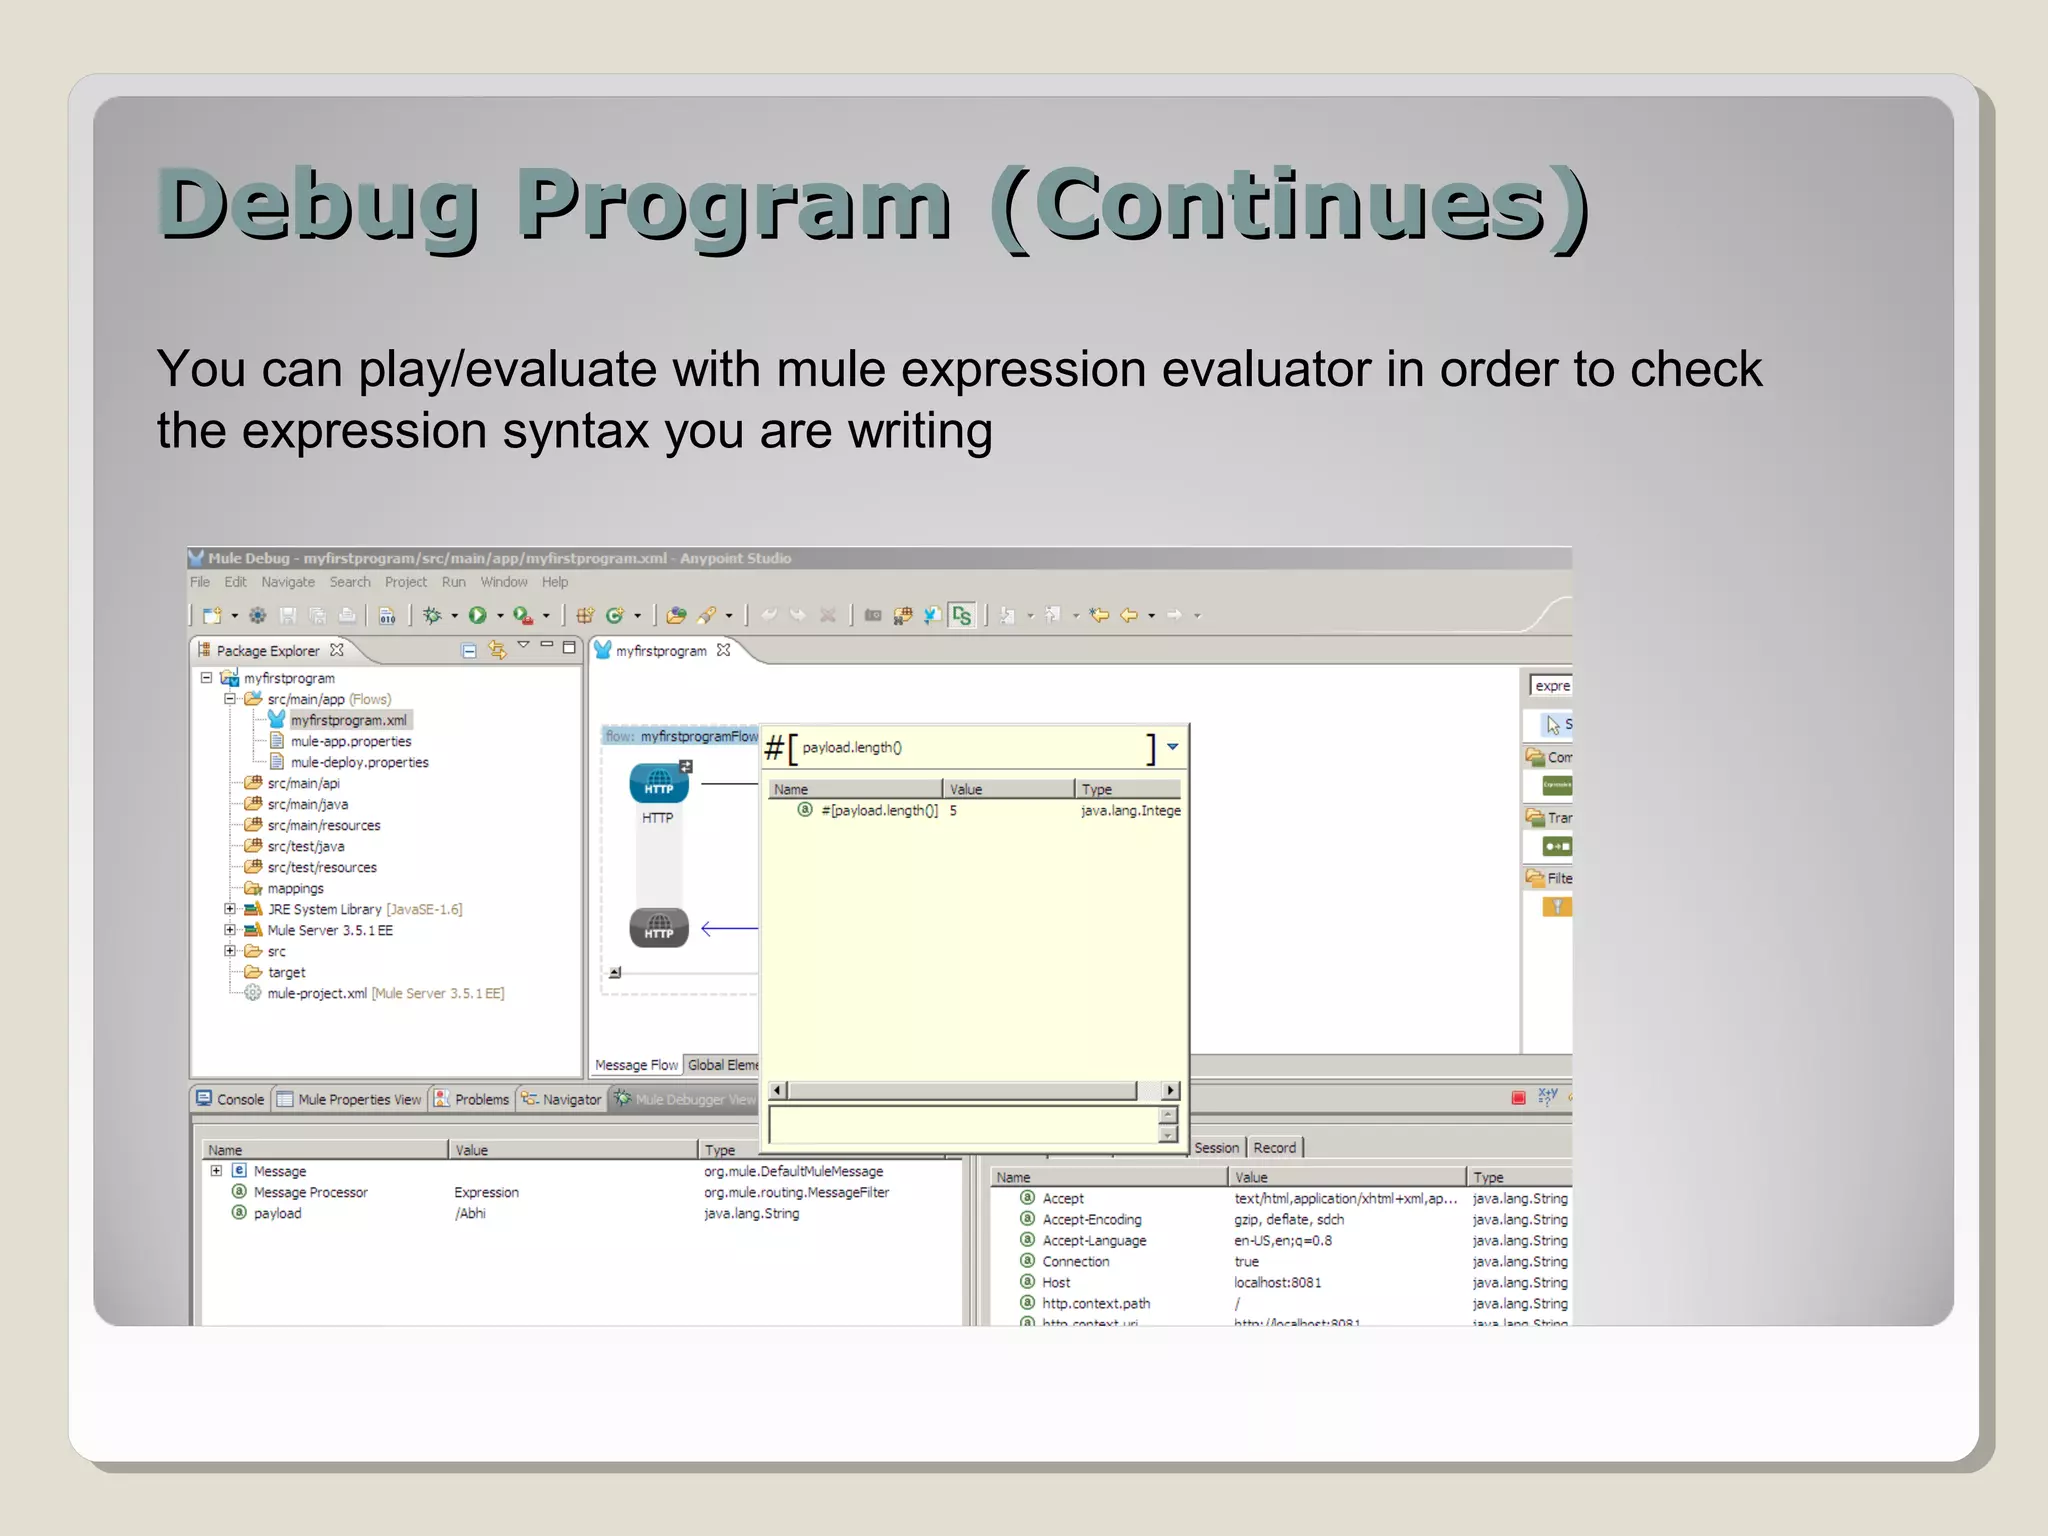
MuleSoftMuleSoft Debug ProgramDebug Program Abhishek Jain
AgendaAgenda Mule Project Creation Basic Structure Simple Program Run Program Topic for next session Reference
Run Program in DebugRun Program in Debug We will continue with the program mentioned in previous session. Run the program in Debug mode.
Debug Mode ContinuesDebug Mode Continues -Mule application will be running in “Mule Debug” perspective -Mule Debugger perspective will open and application would start running in debug mode. Upon successful deployment, debugger view will open
Some Debugging IssuesSome Debugging Issues -There could be some scenarios where application might not run in debug mode. Anypoint doesn’t show the error sometimes in that case. -Possible Solution -Change the port number for debug mode -Restart the workspace -Port number can be changed by going into below -Right click -> Debug-> Debug Configurations -> Mule Debugger-> Port
Apply BreakpointsApply Breakpoints -Breakpoints can be applied easily by right click on any of the message processor/inbound/outbound endpoints
Debug ProgramDebug Program
Debug Program (Continues)Debug Program (Continues) Application will be paused on break points and debugger view will open with all the properties associated with the message at that time
Debug Program (Continues)Debug Program (Continues) You can play/evaluate with mule expression evaluator in order to check the expression syntax you are writing
Debug Program (Continues..)Debug Program (Continues..) Program can be continued.. By pressing f8 or next message processor button under mule debugger Debugger is having capabilities to check the properties at runtime, evaluate the expression, analyze each component/processor in detail
Next SessionNext Session Filters
ReferencesReferences www.mulesoft.com
Thank YouThank You

Mule soft debugprogram