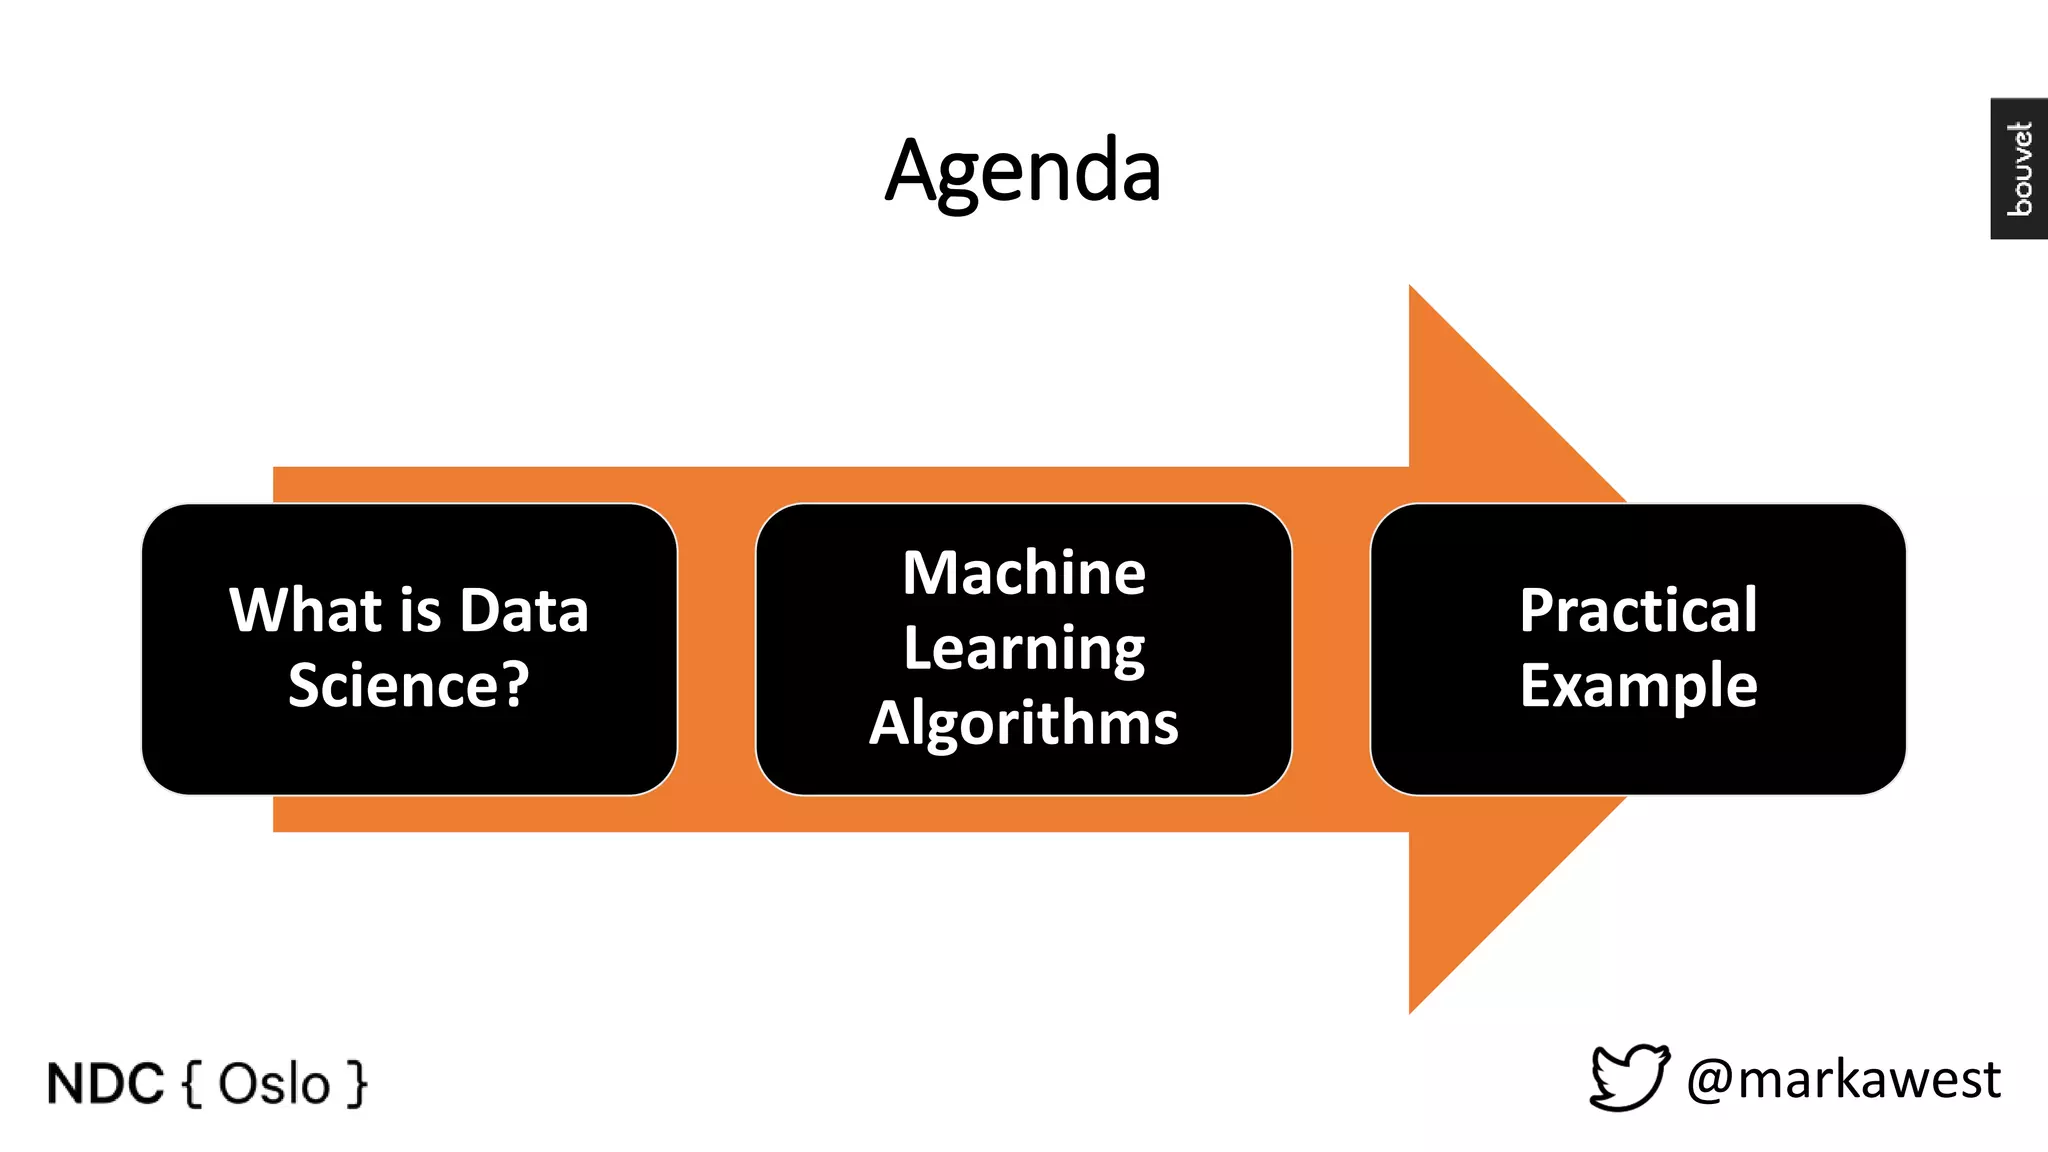
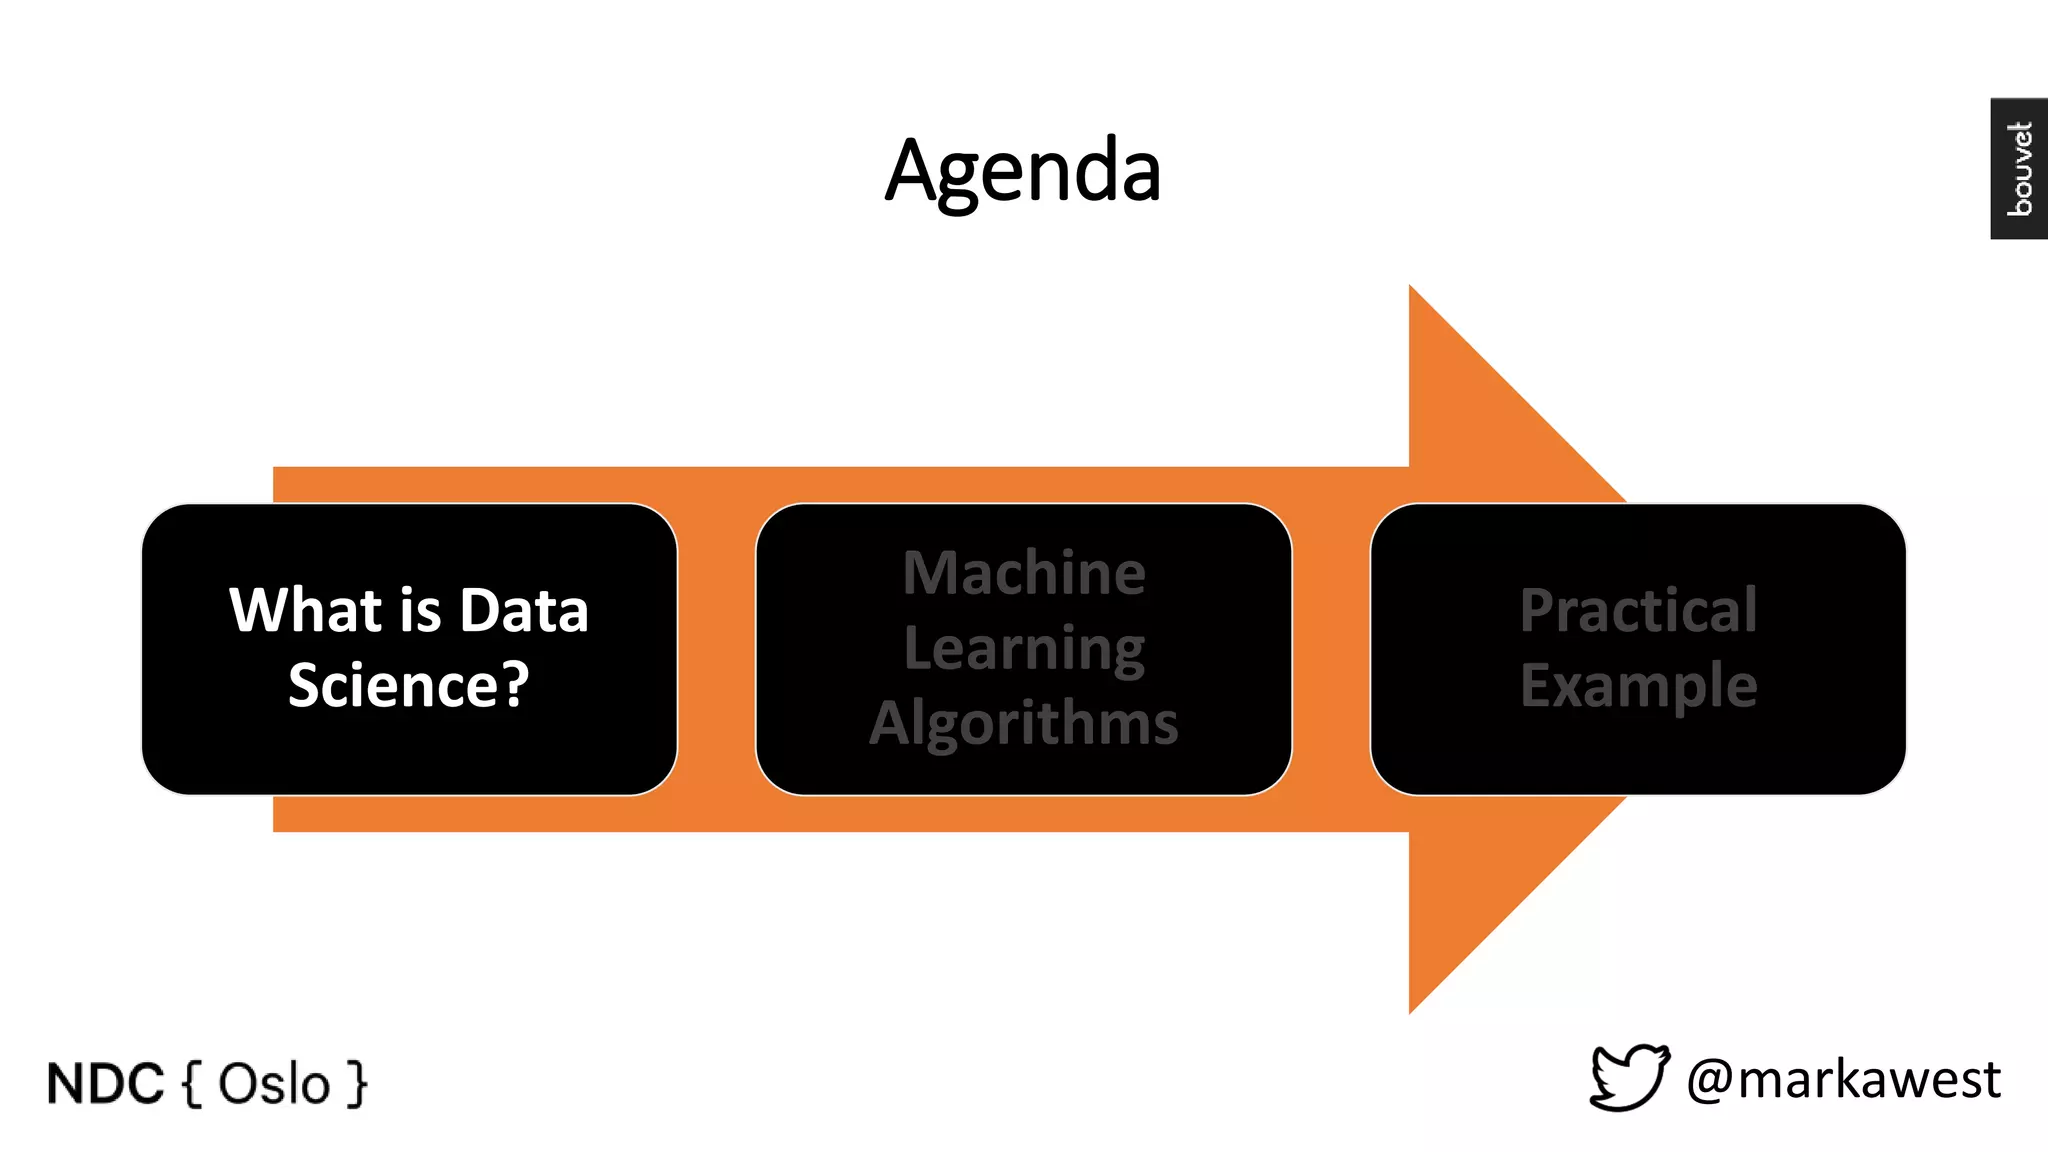
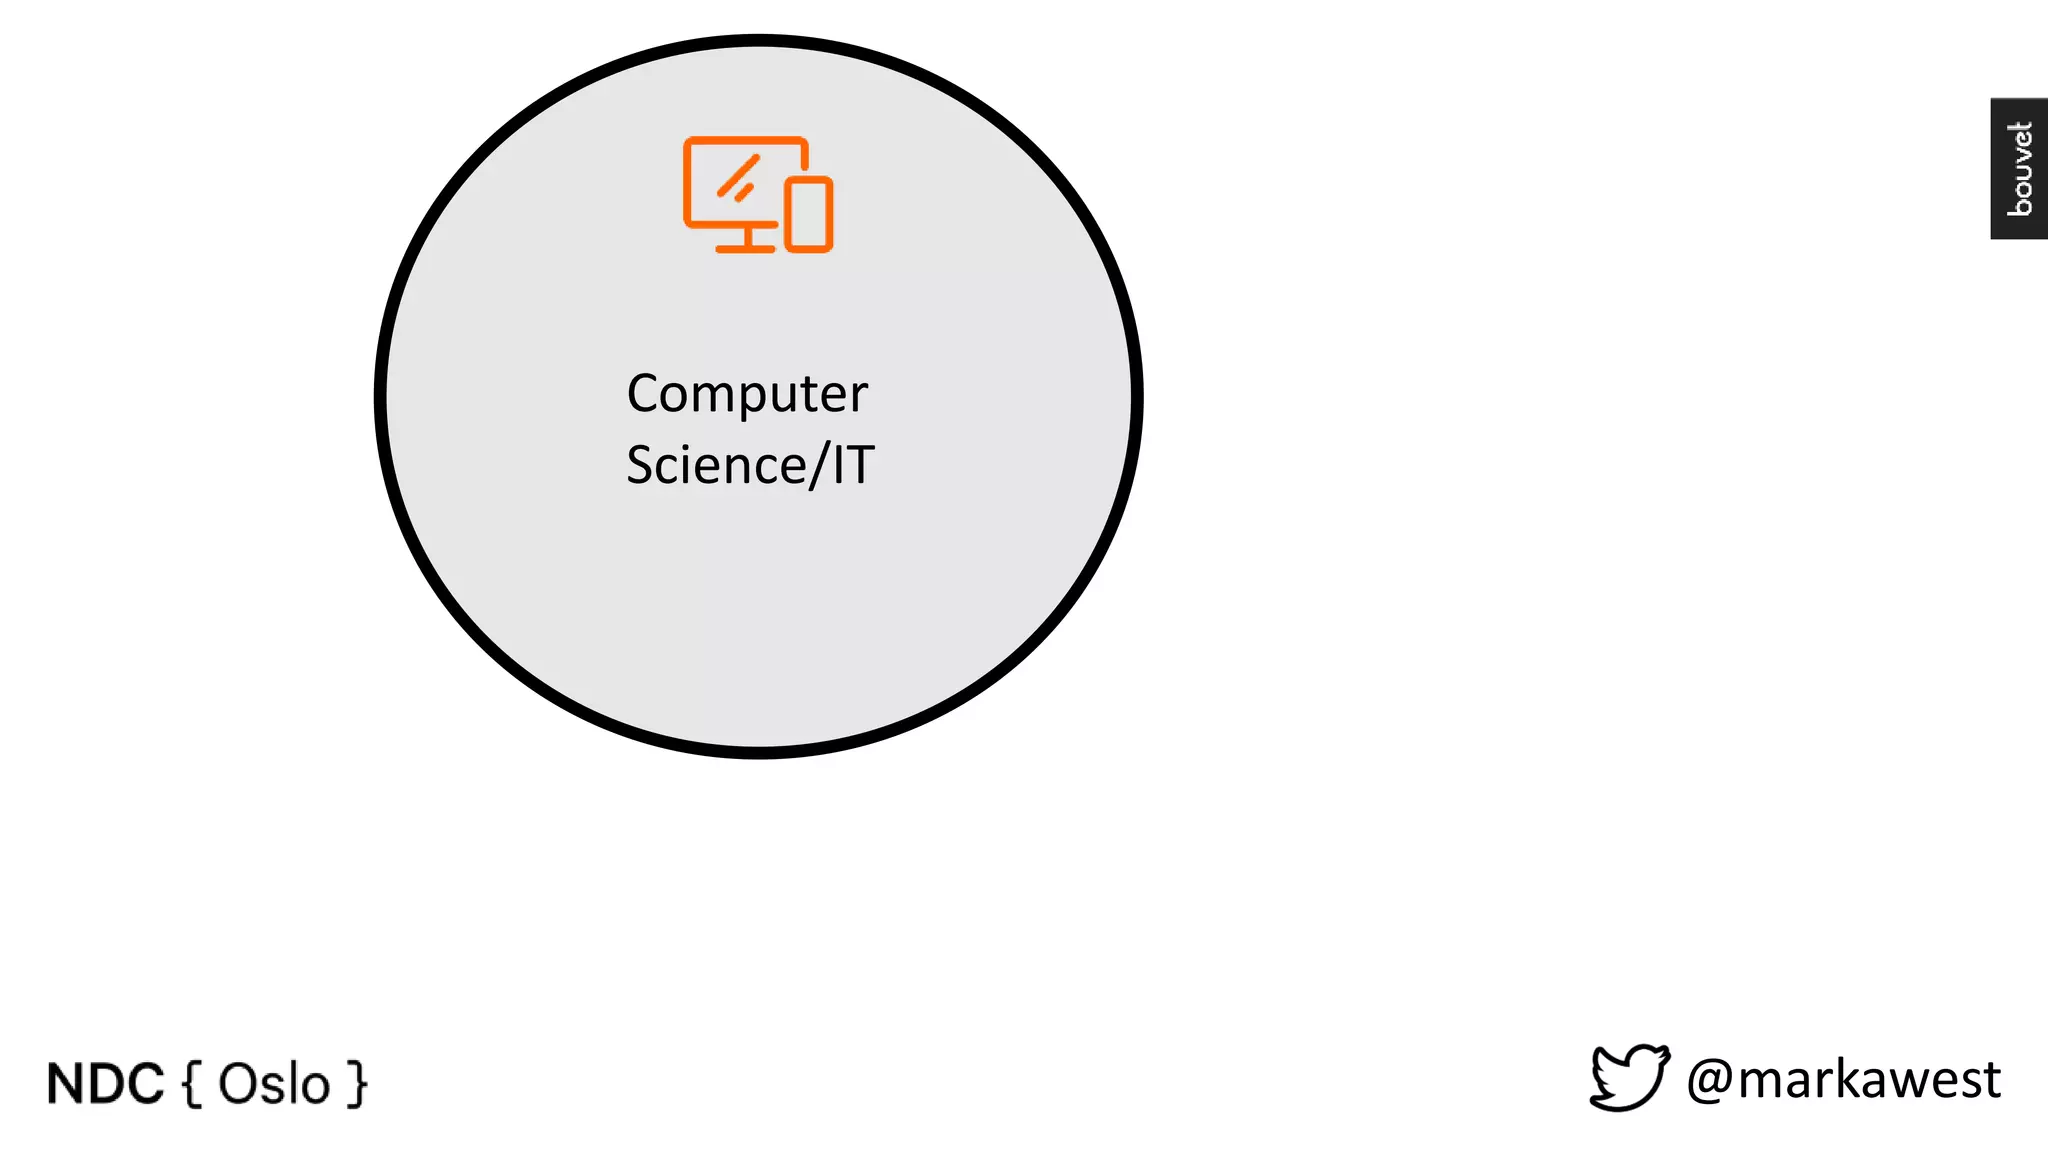
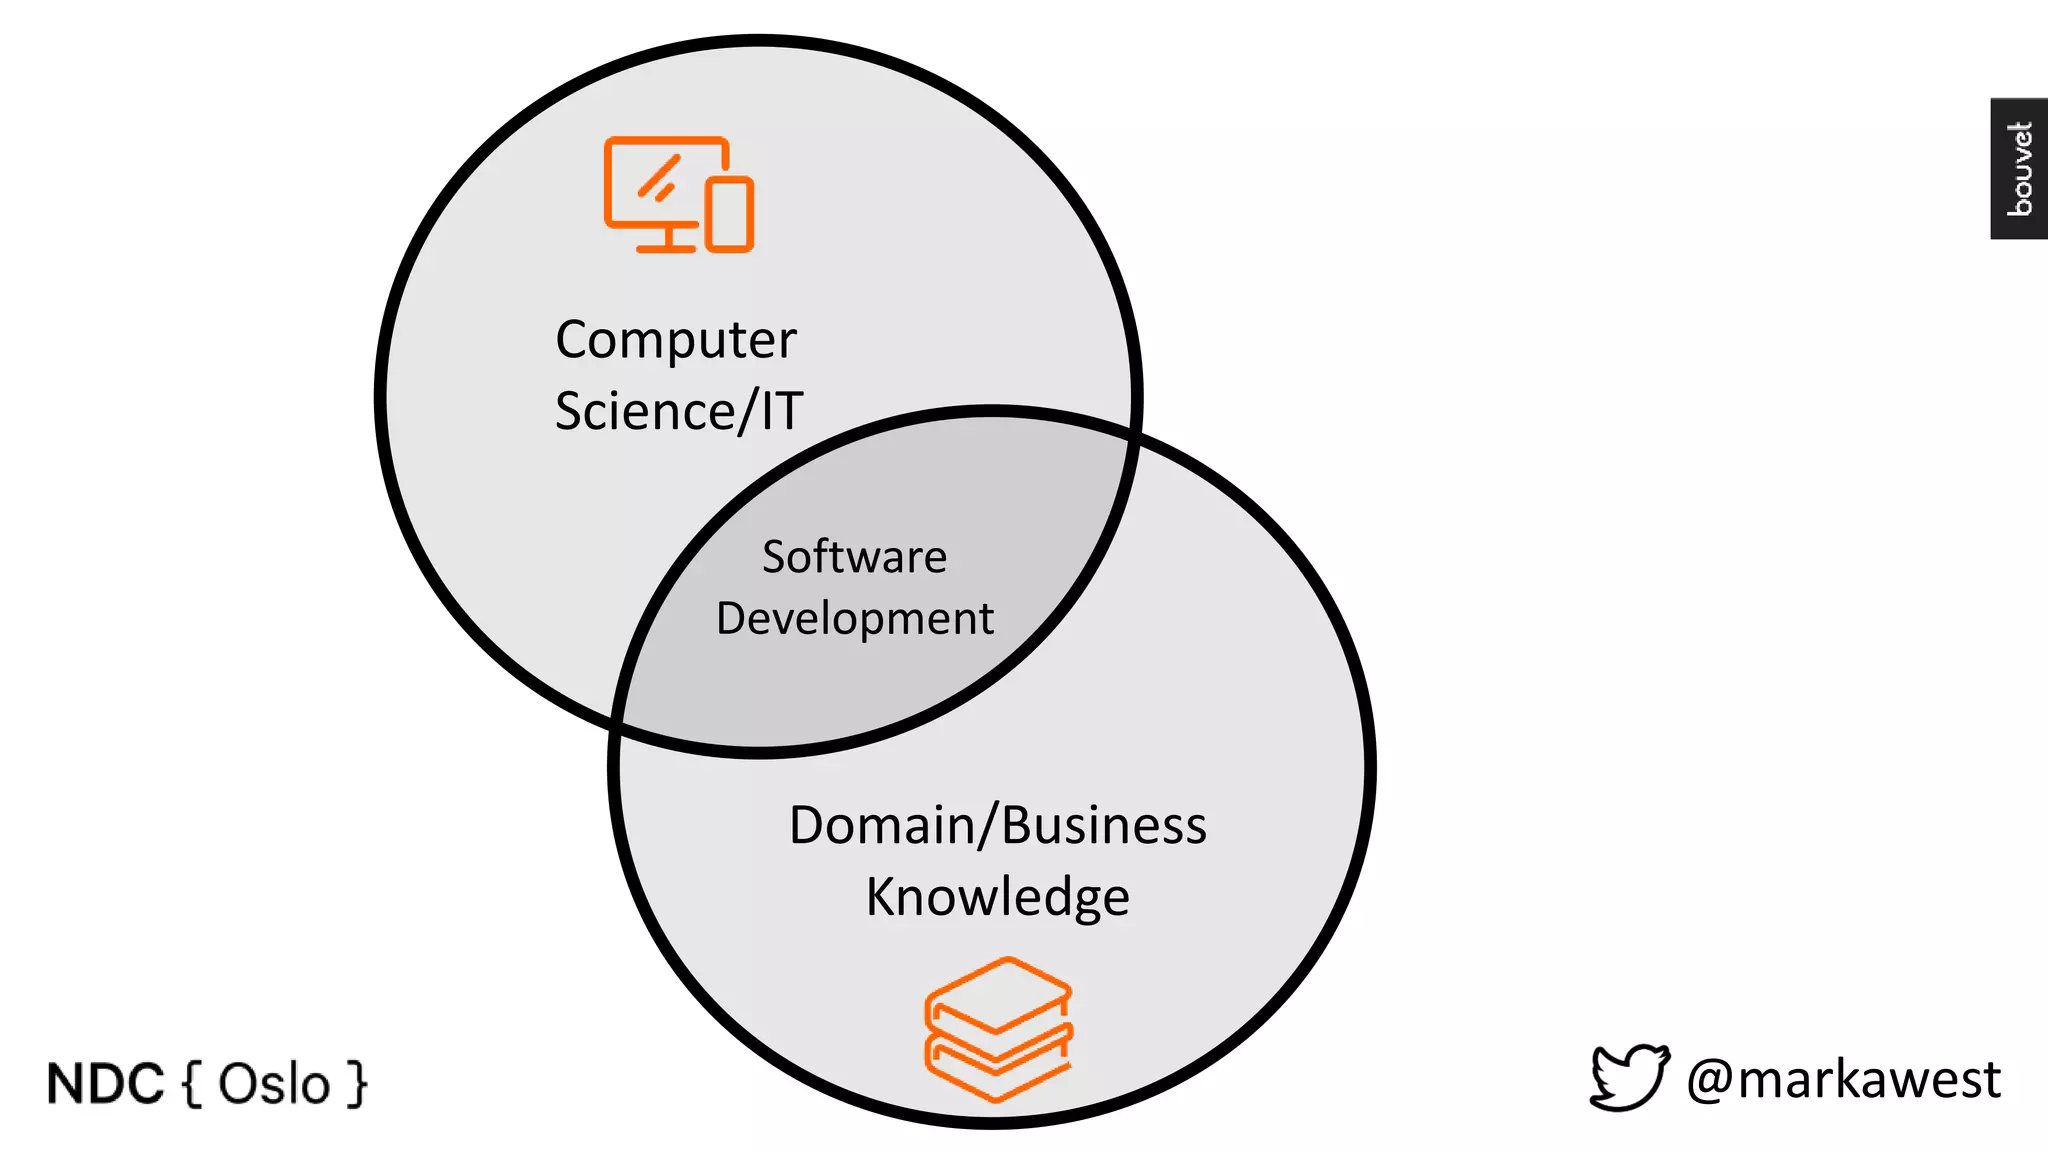
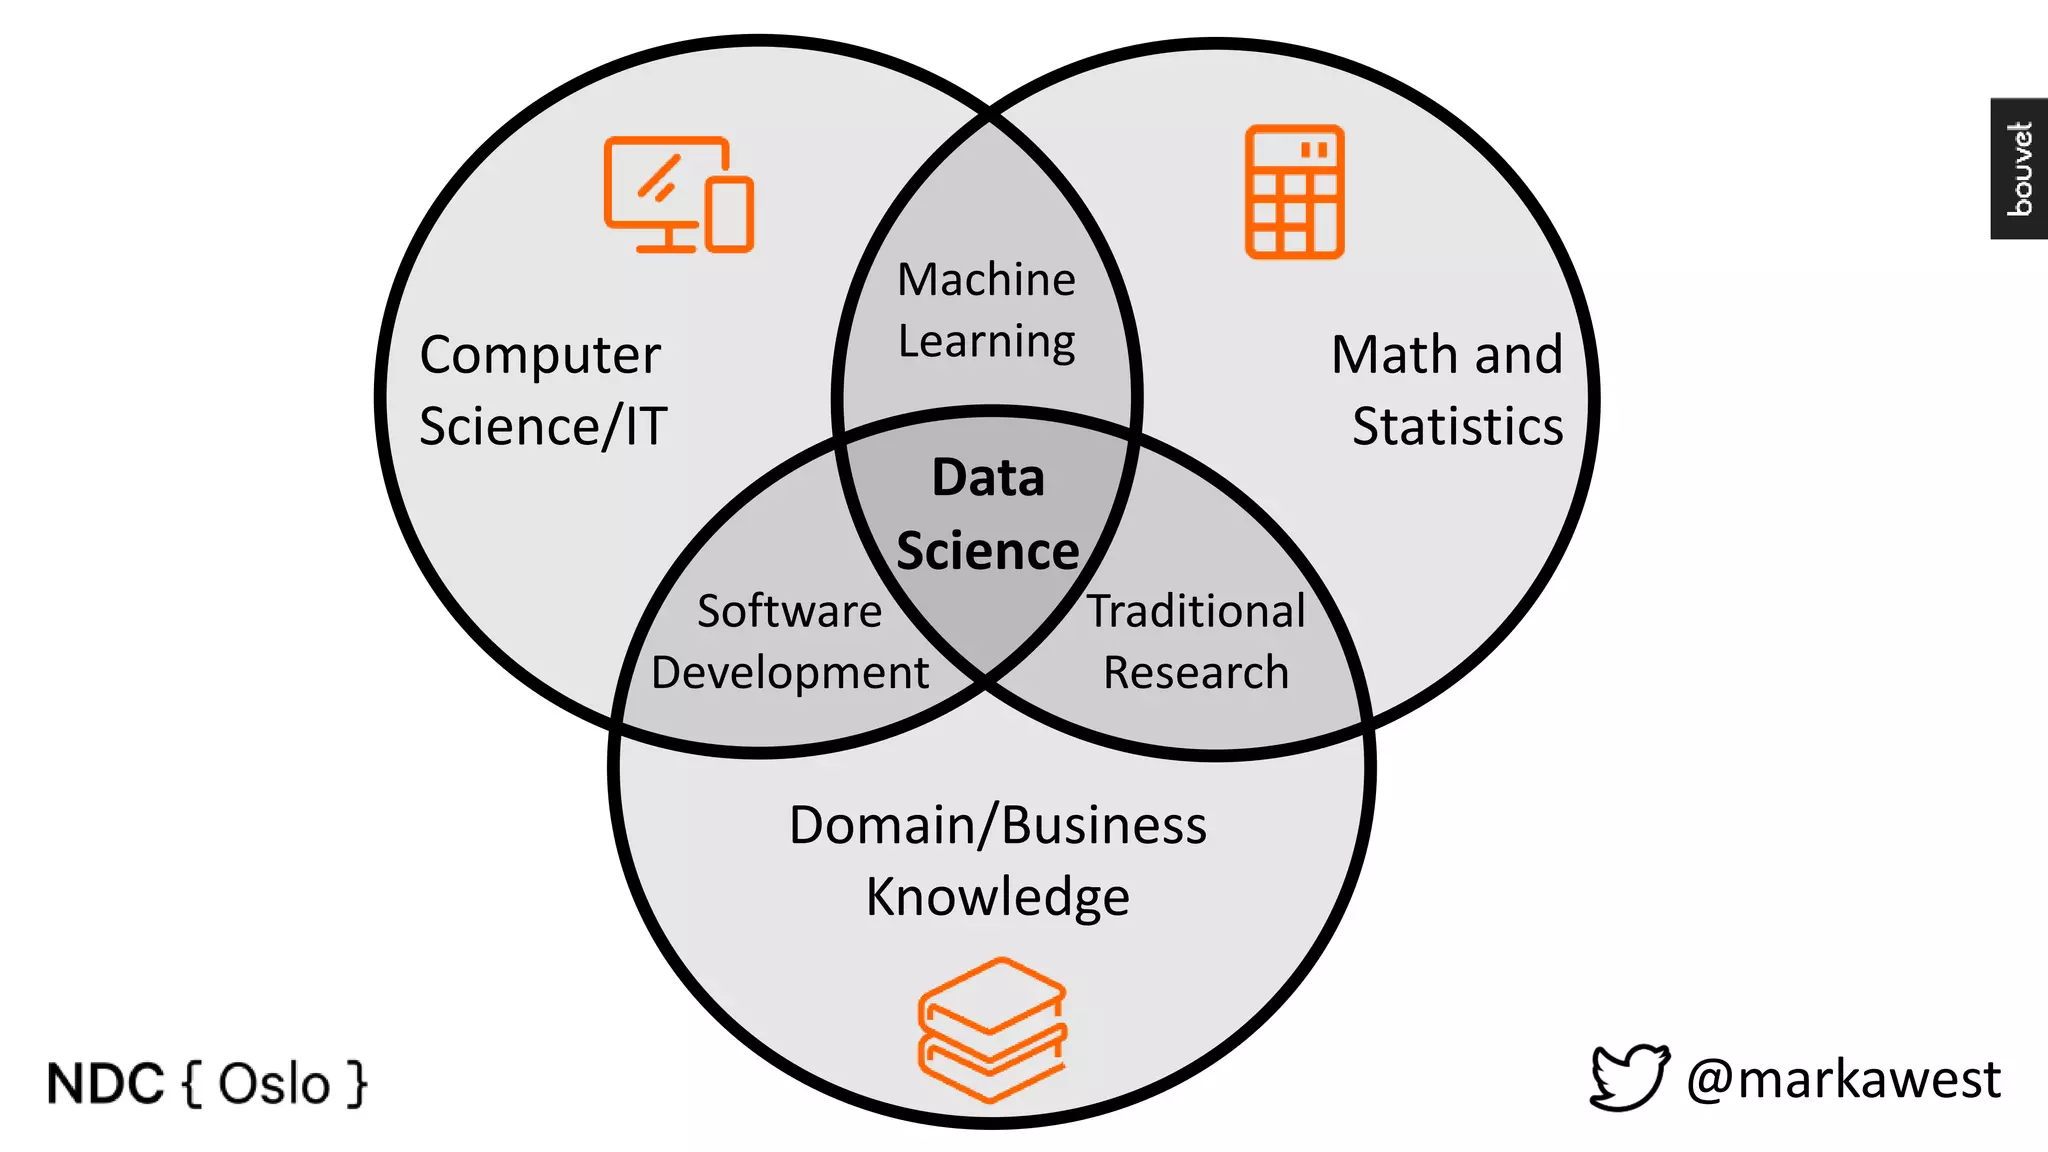
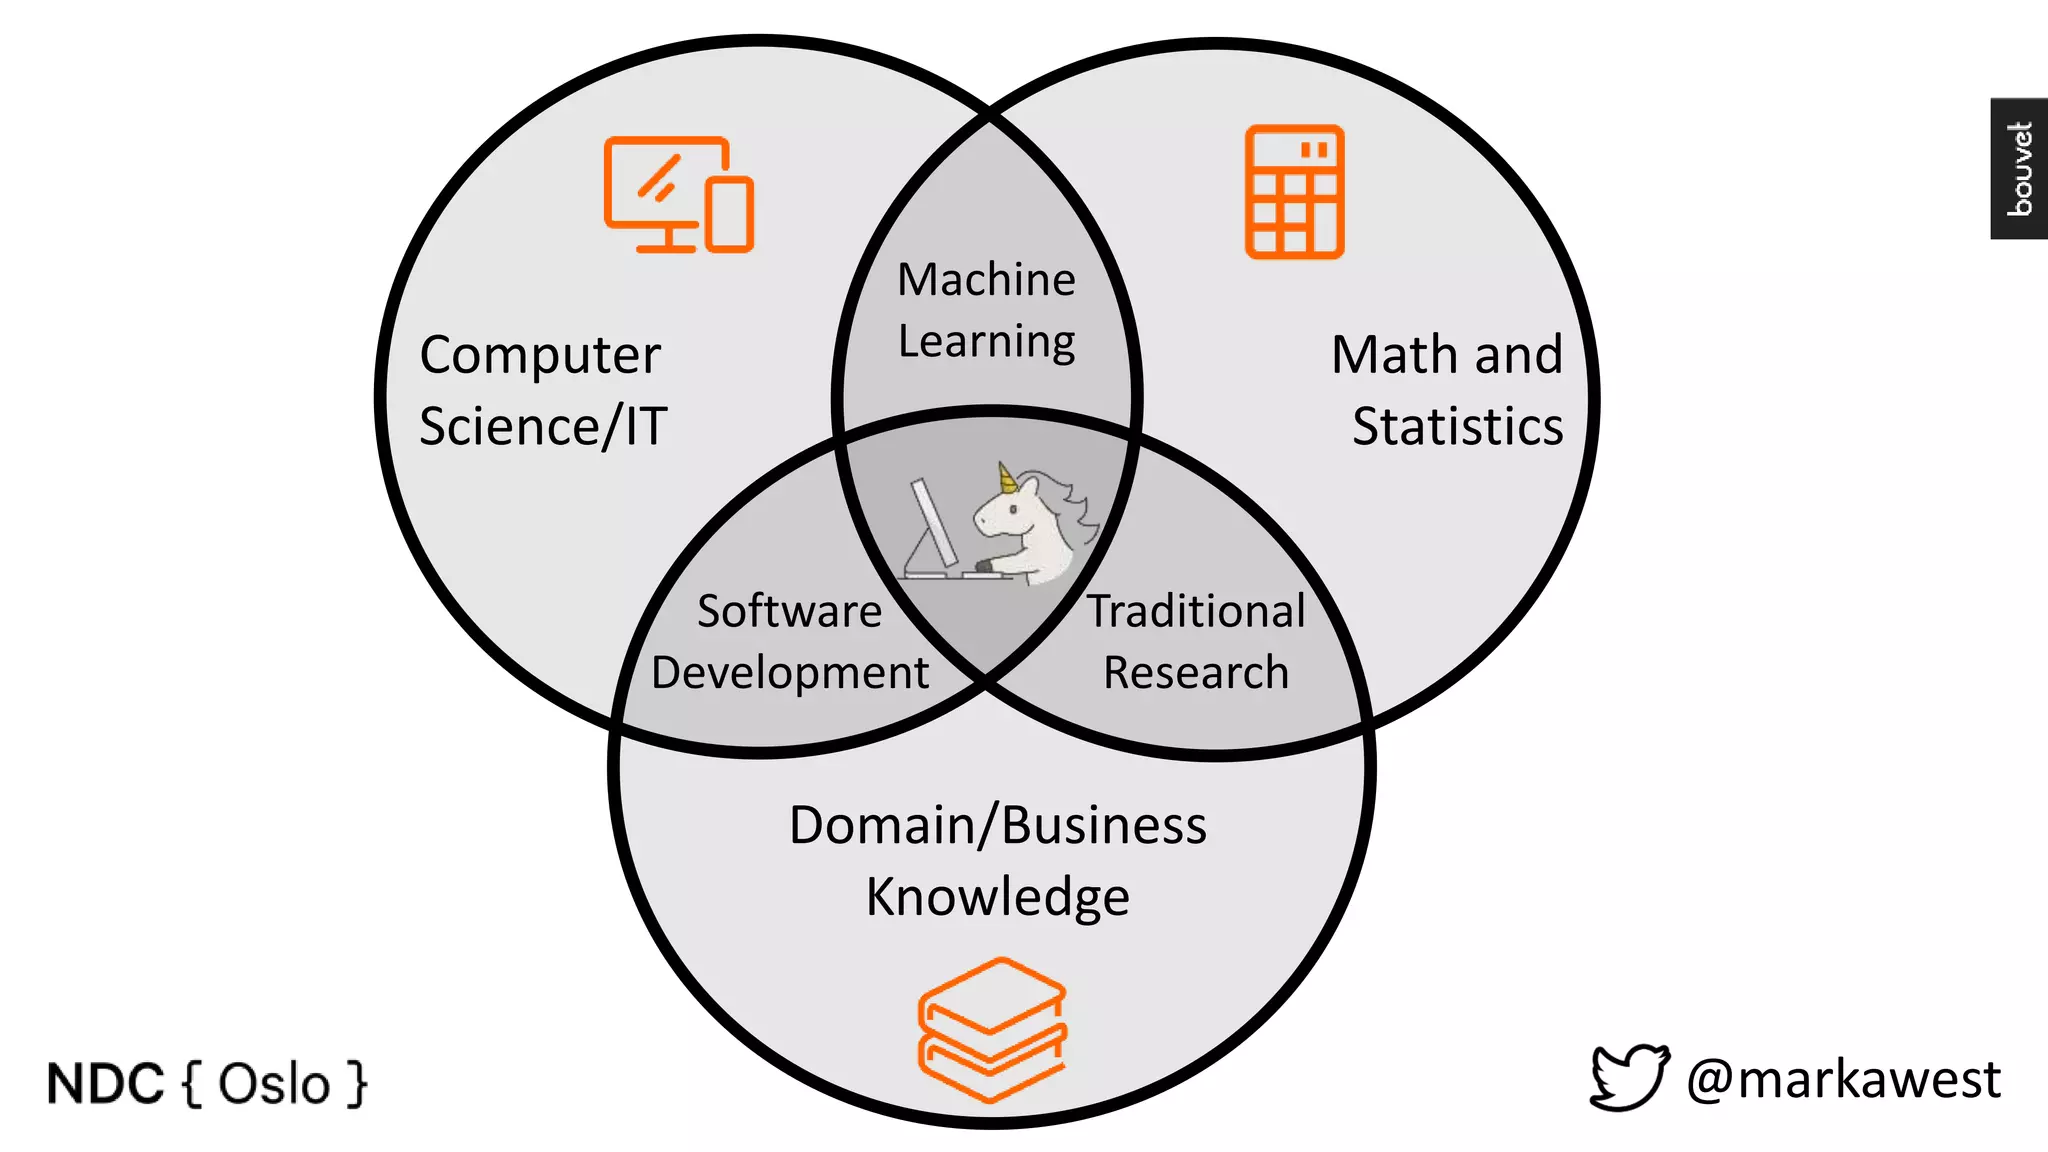
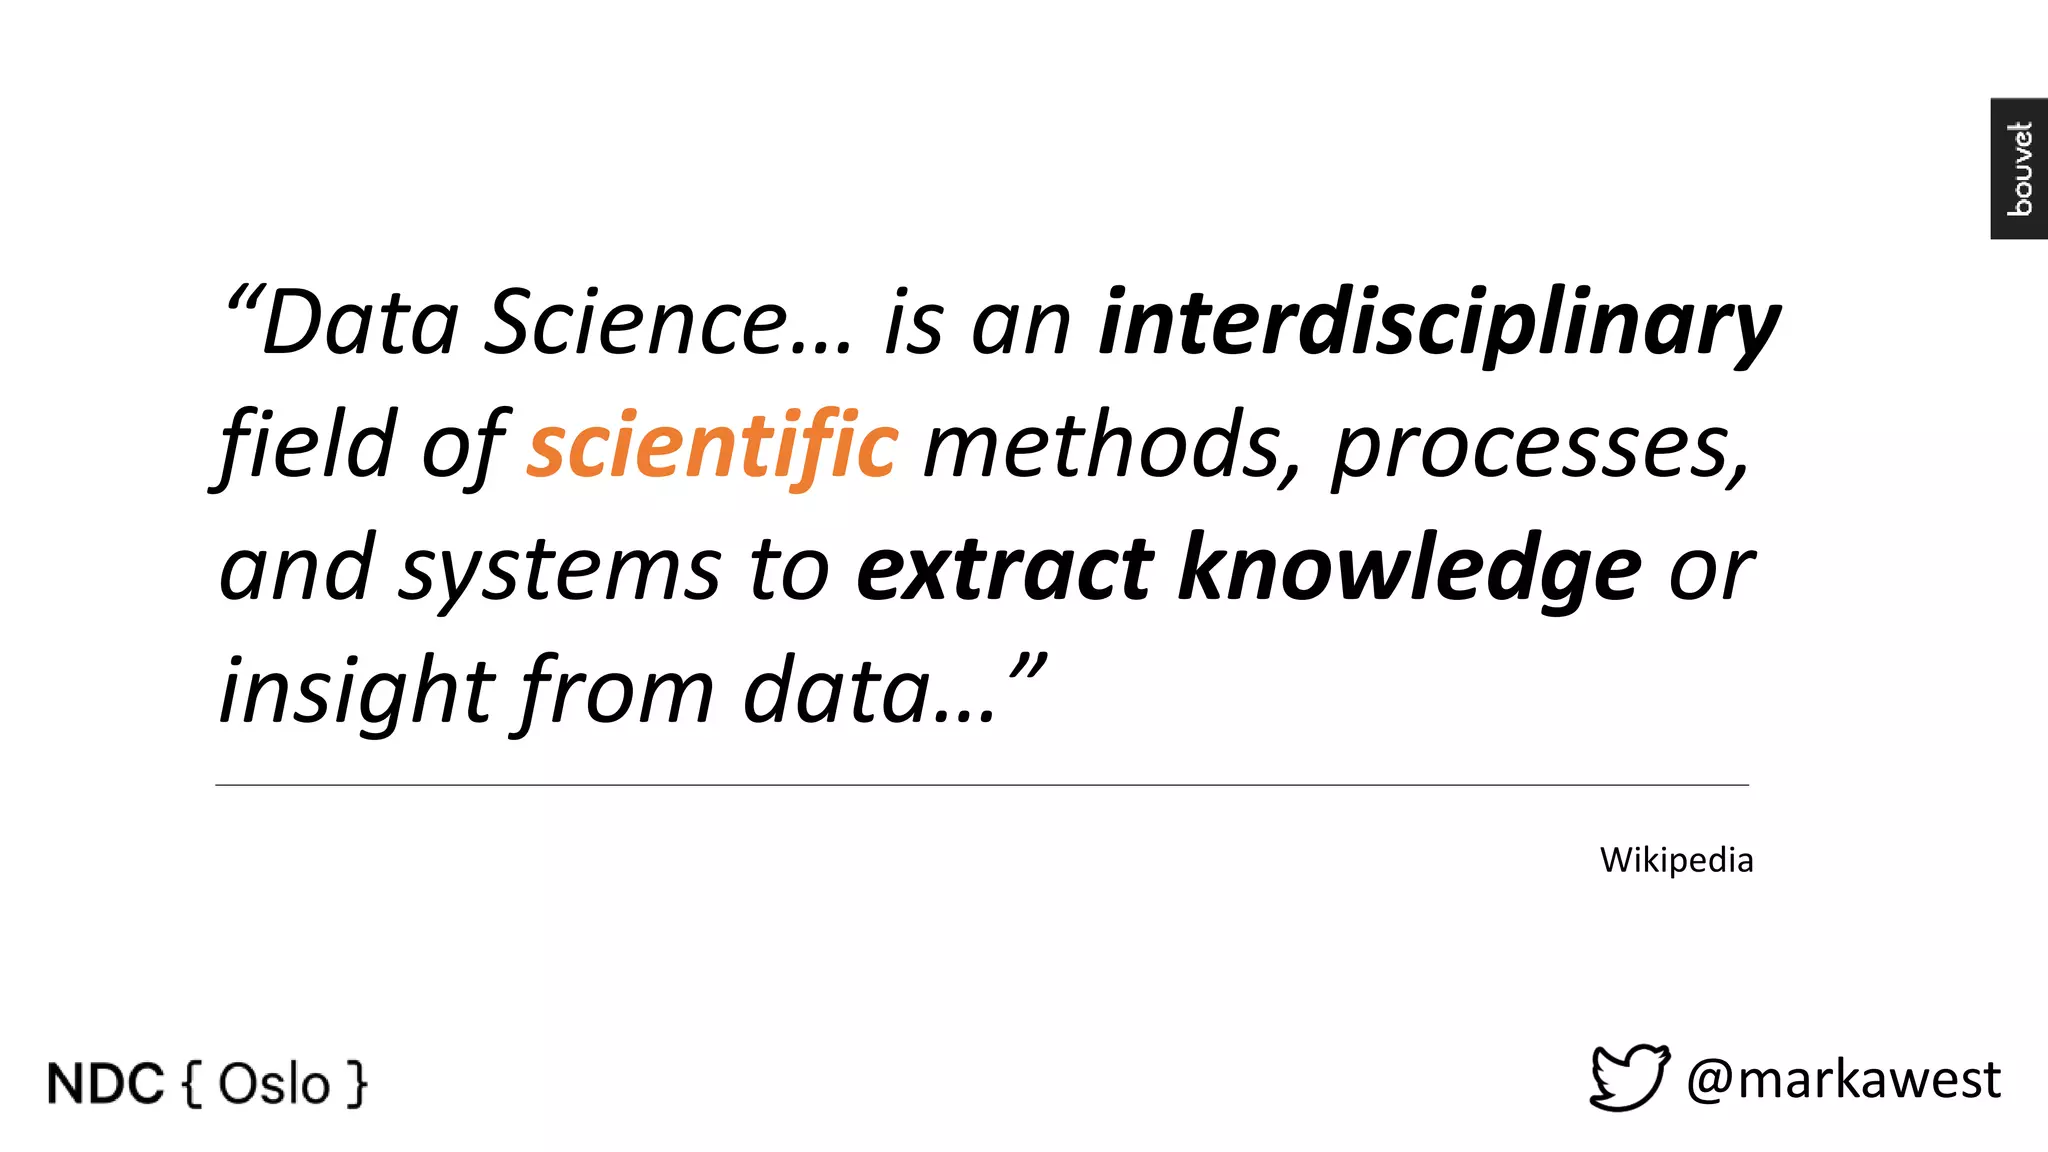
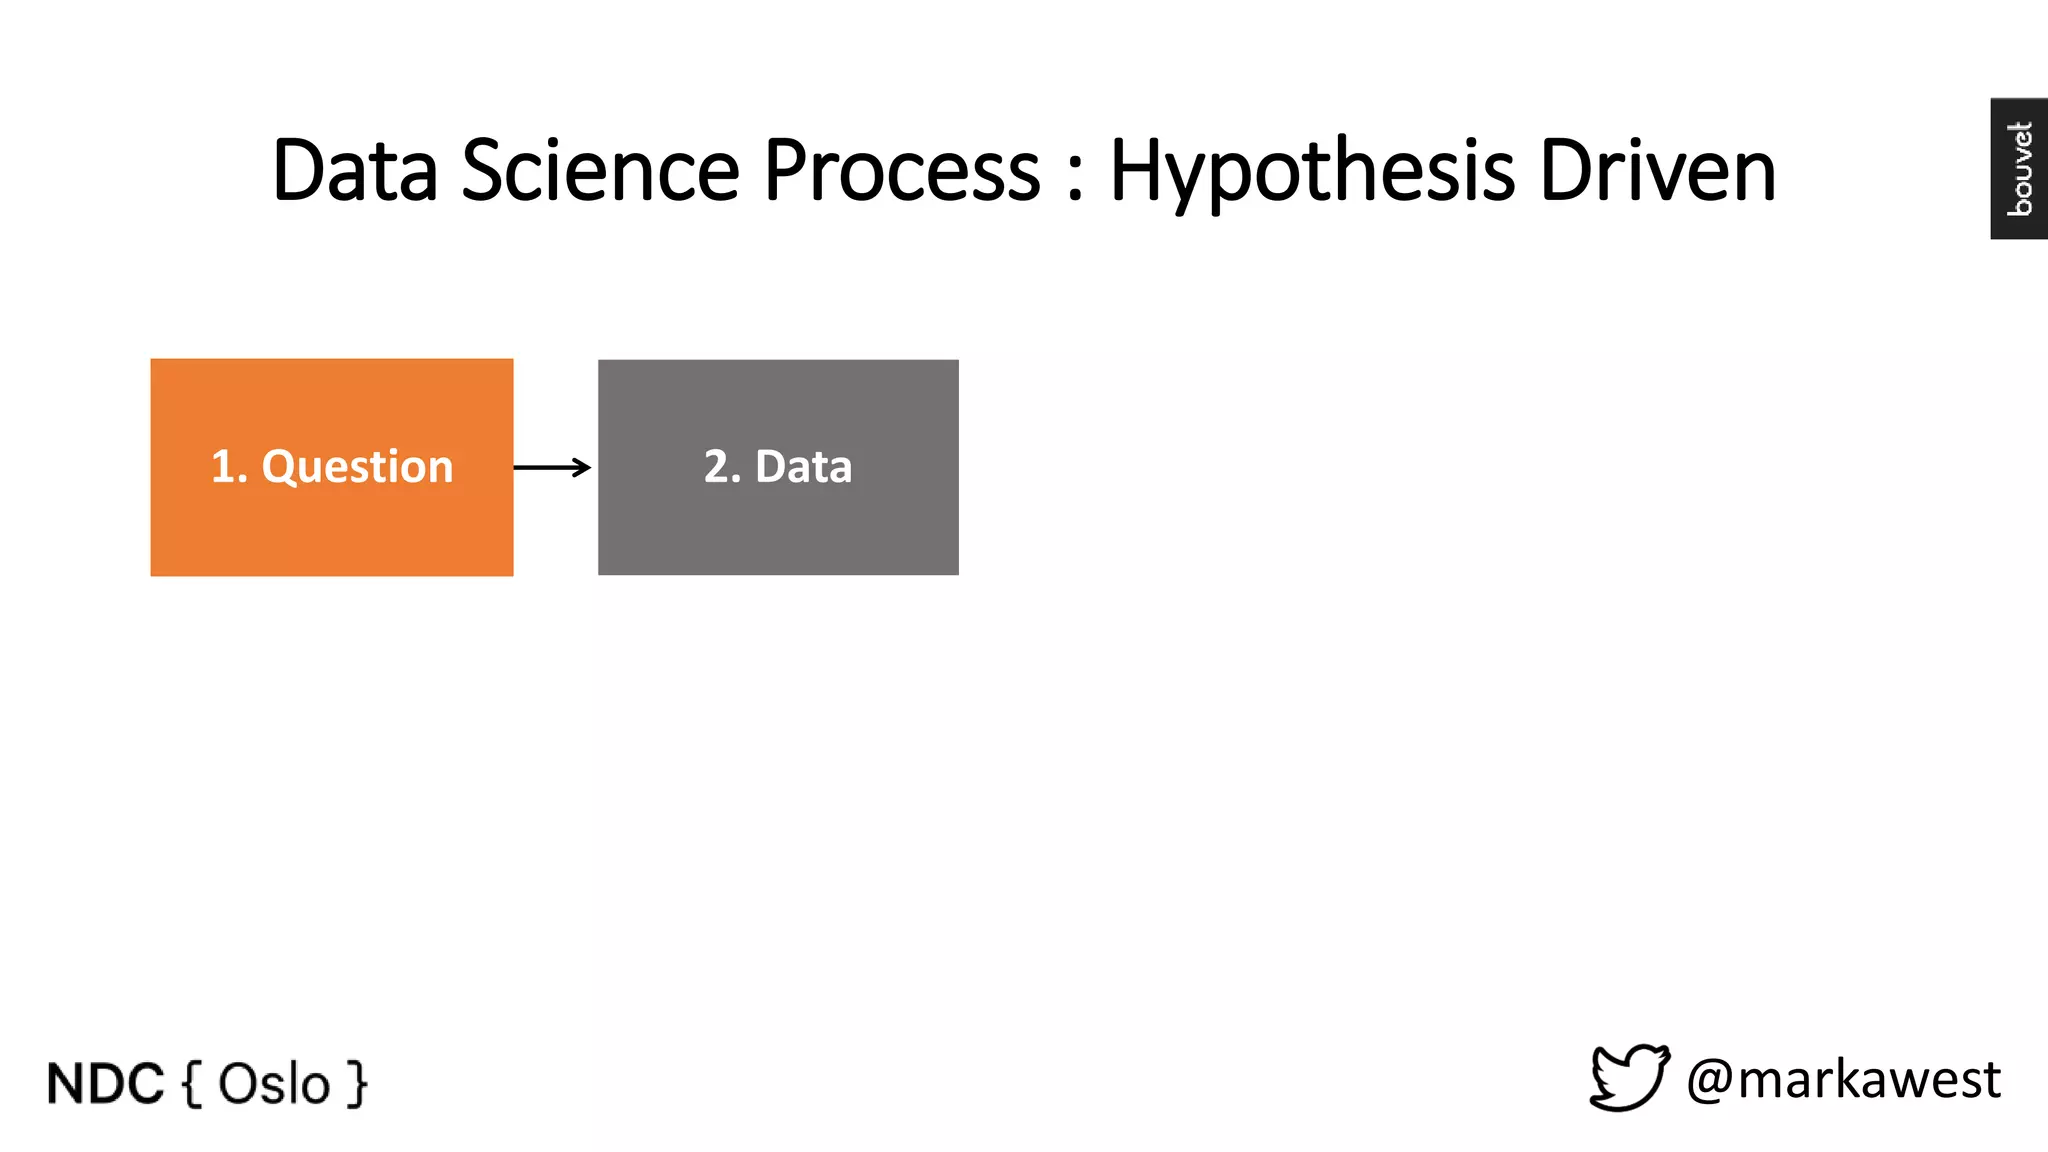
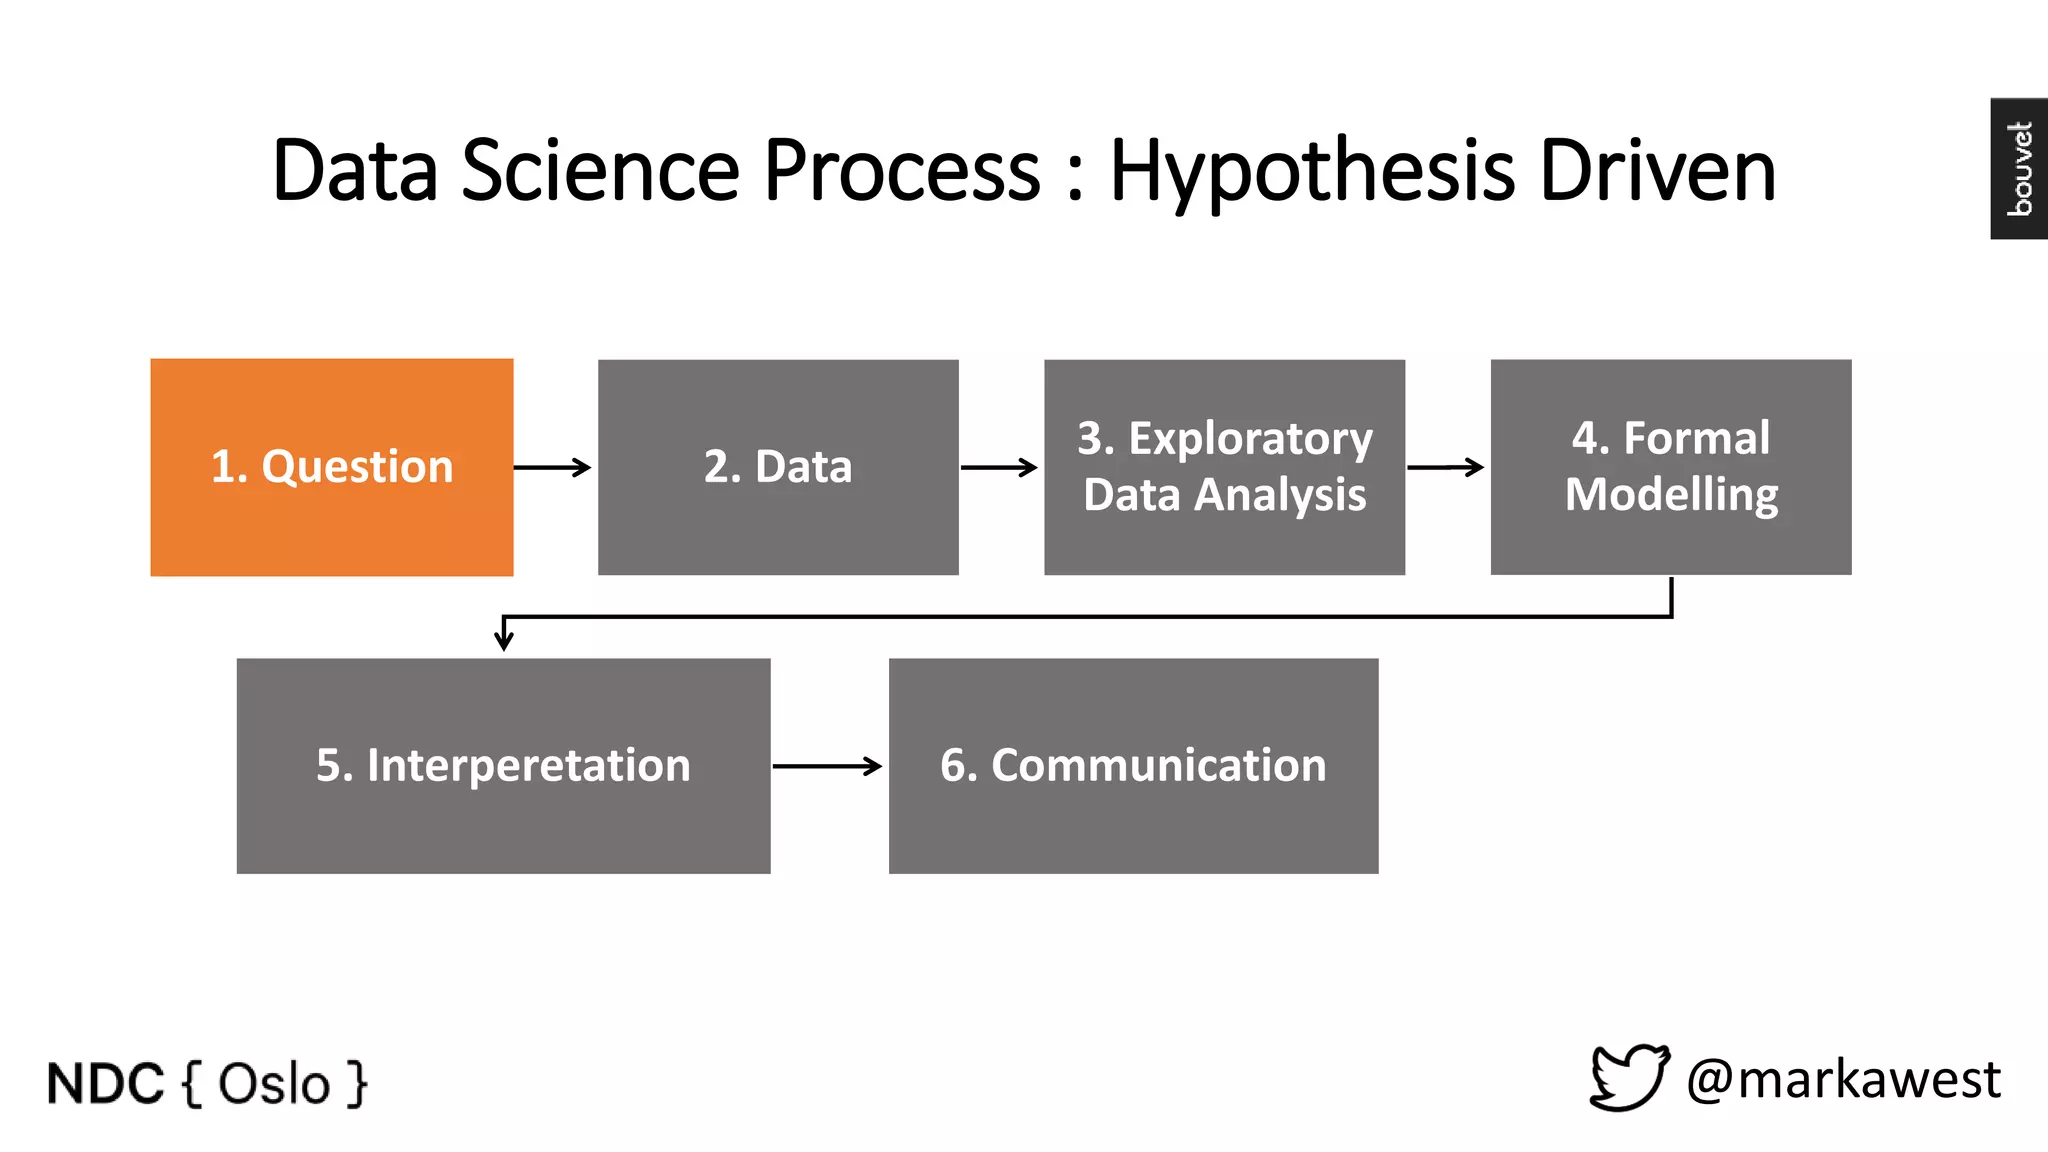
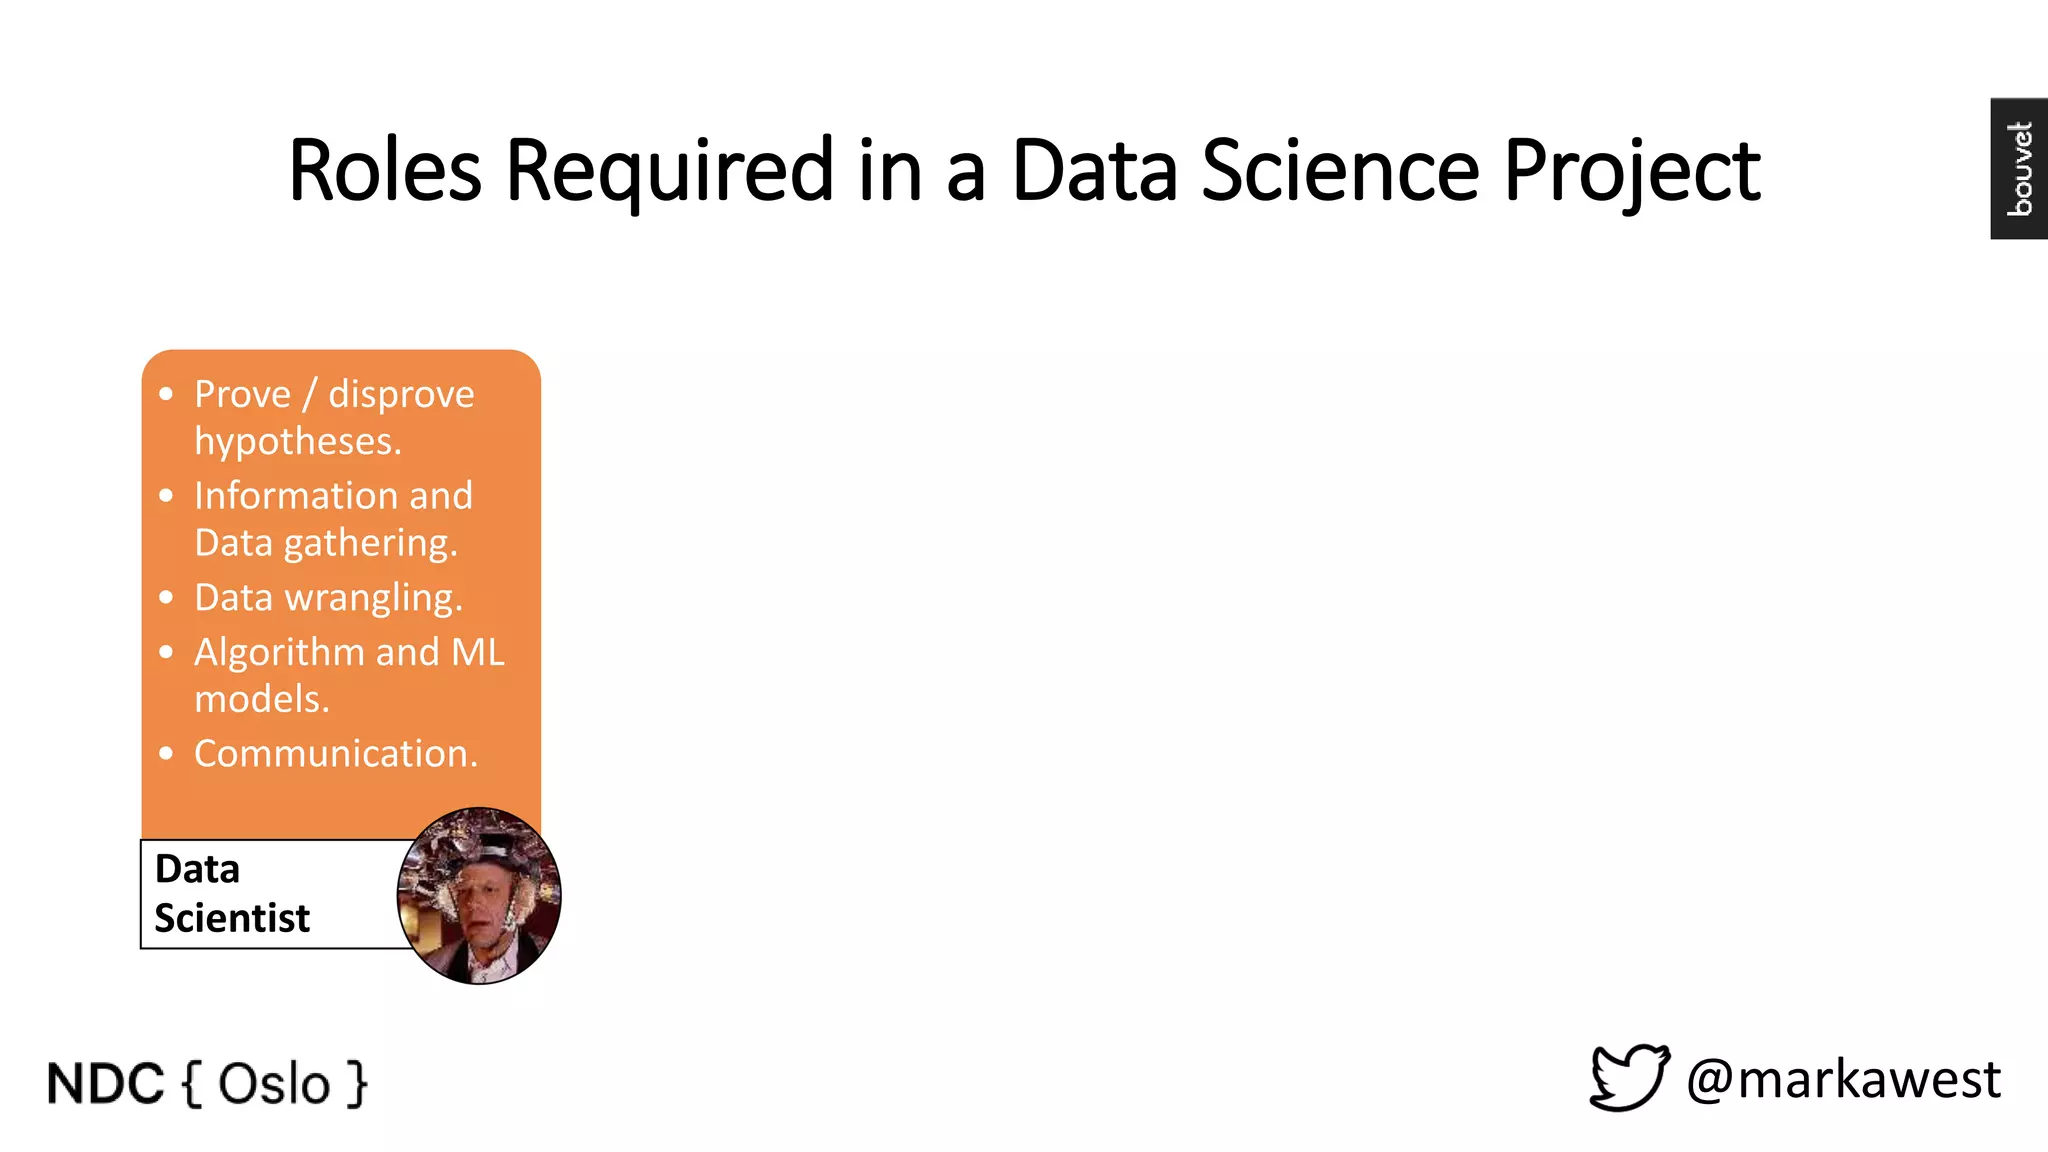
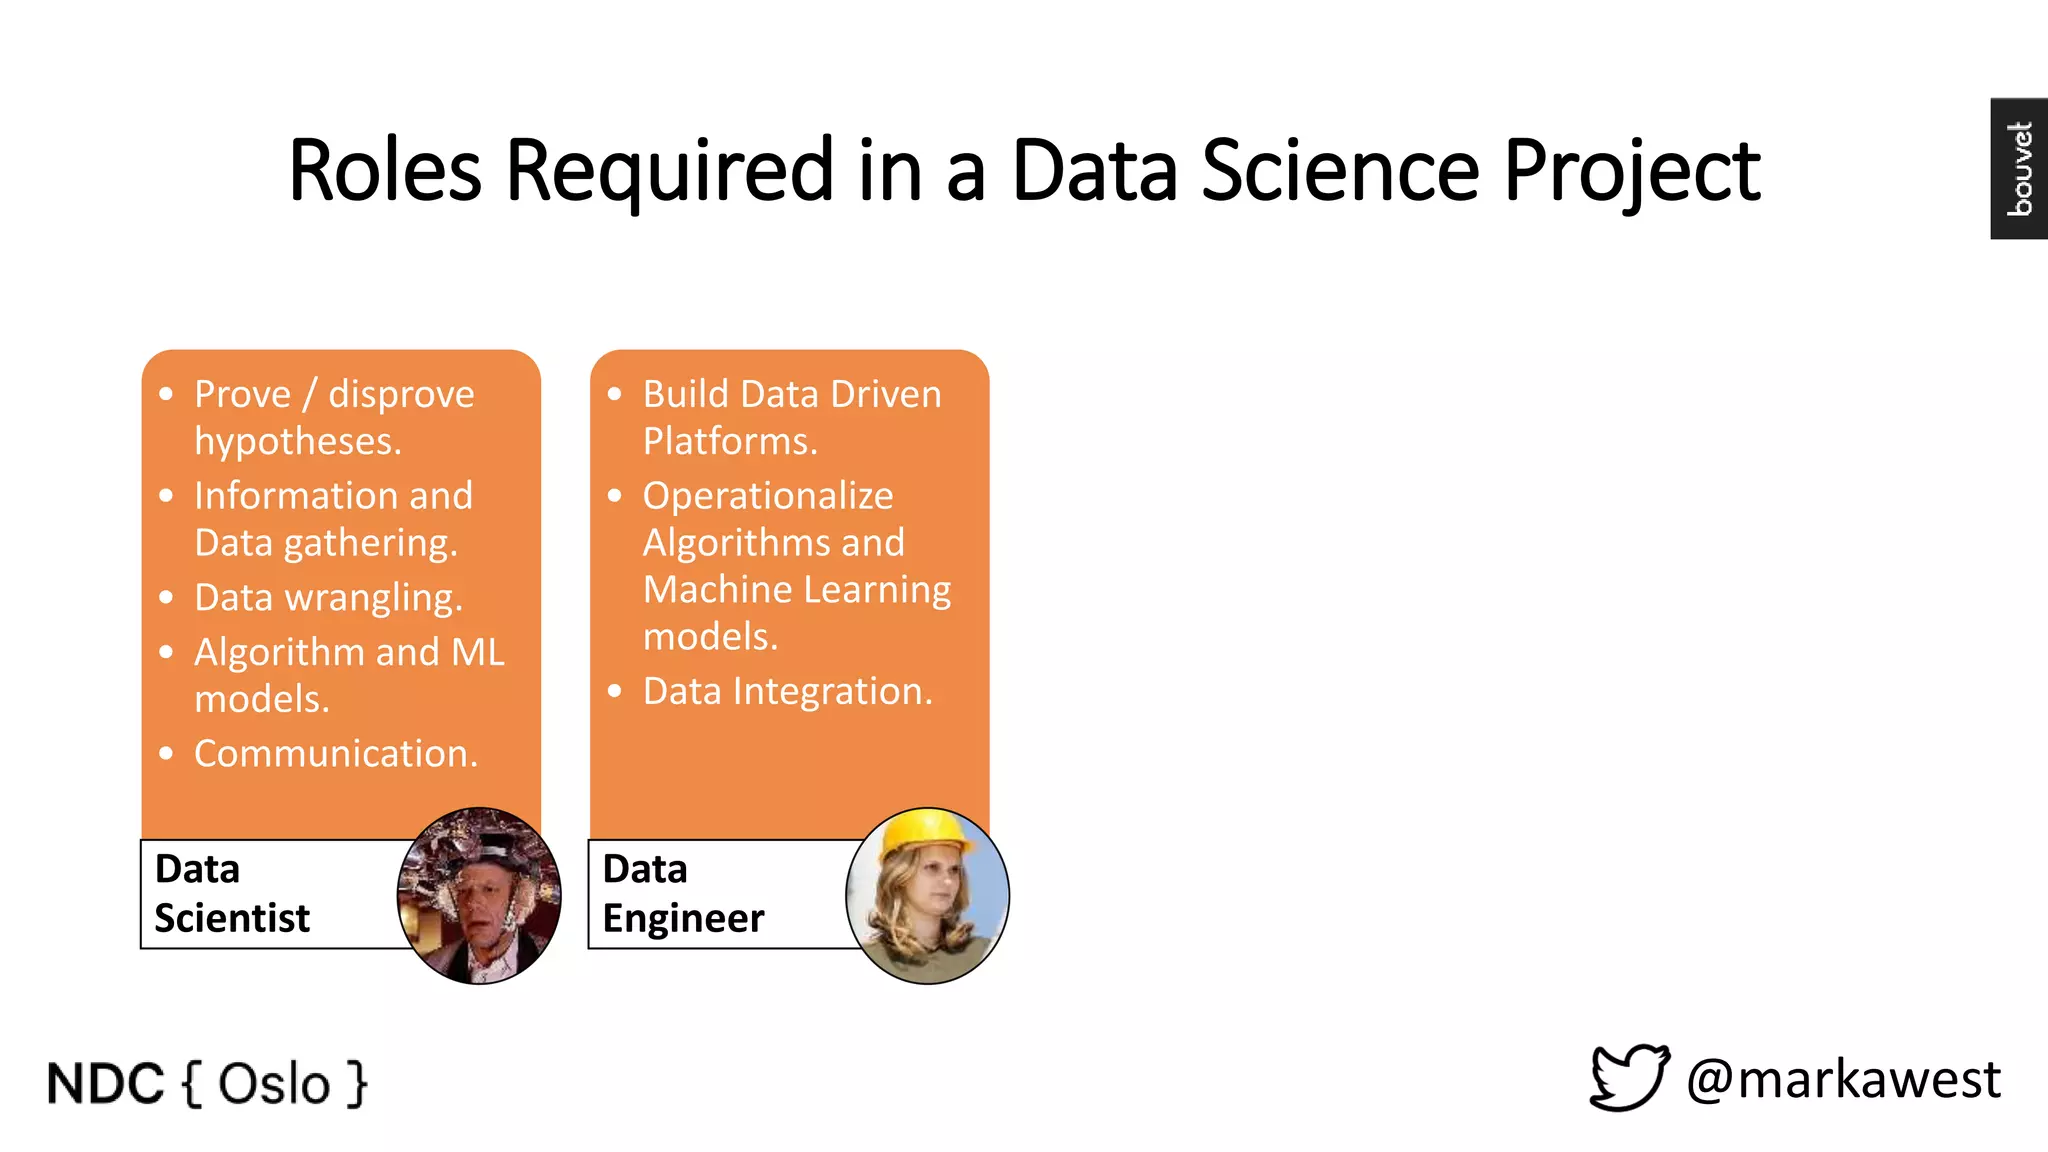
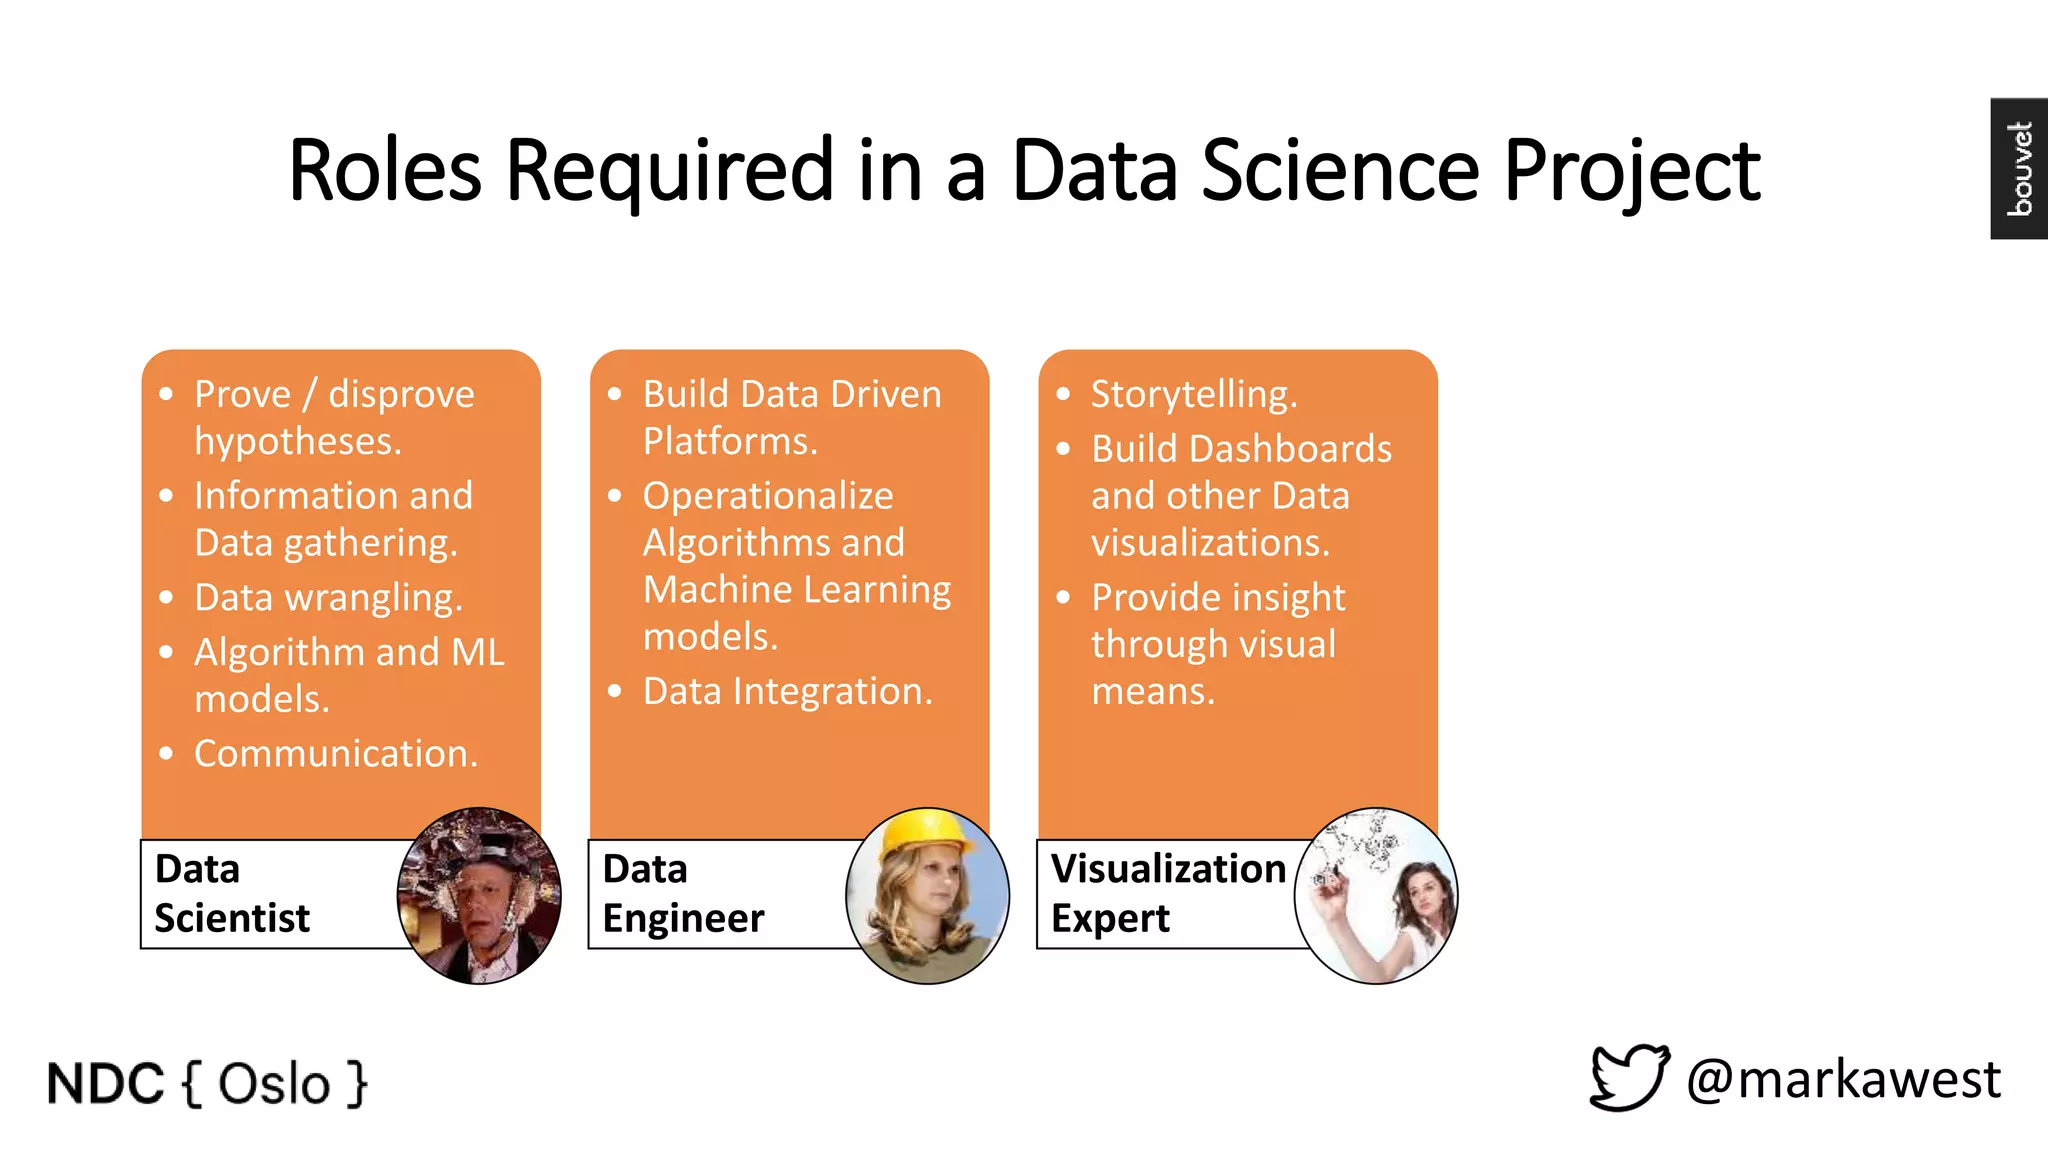
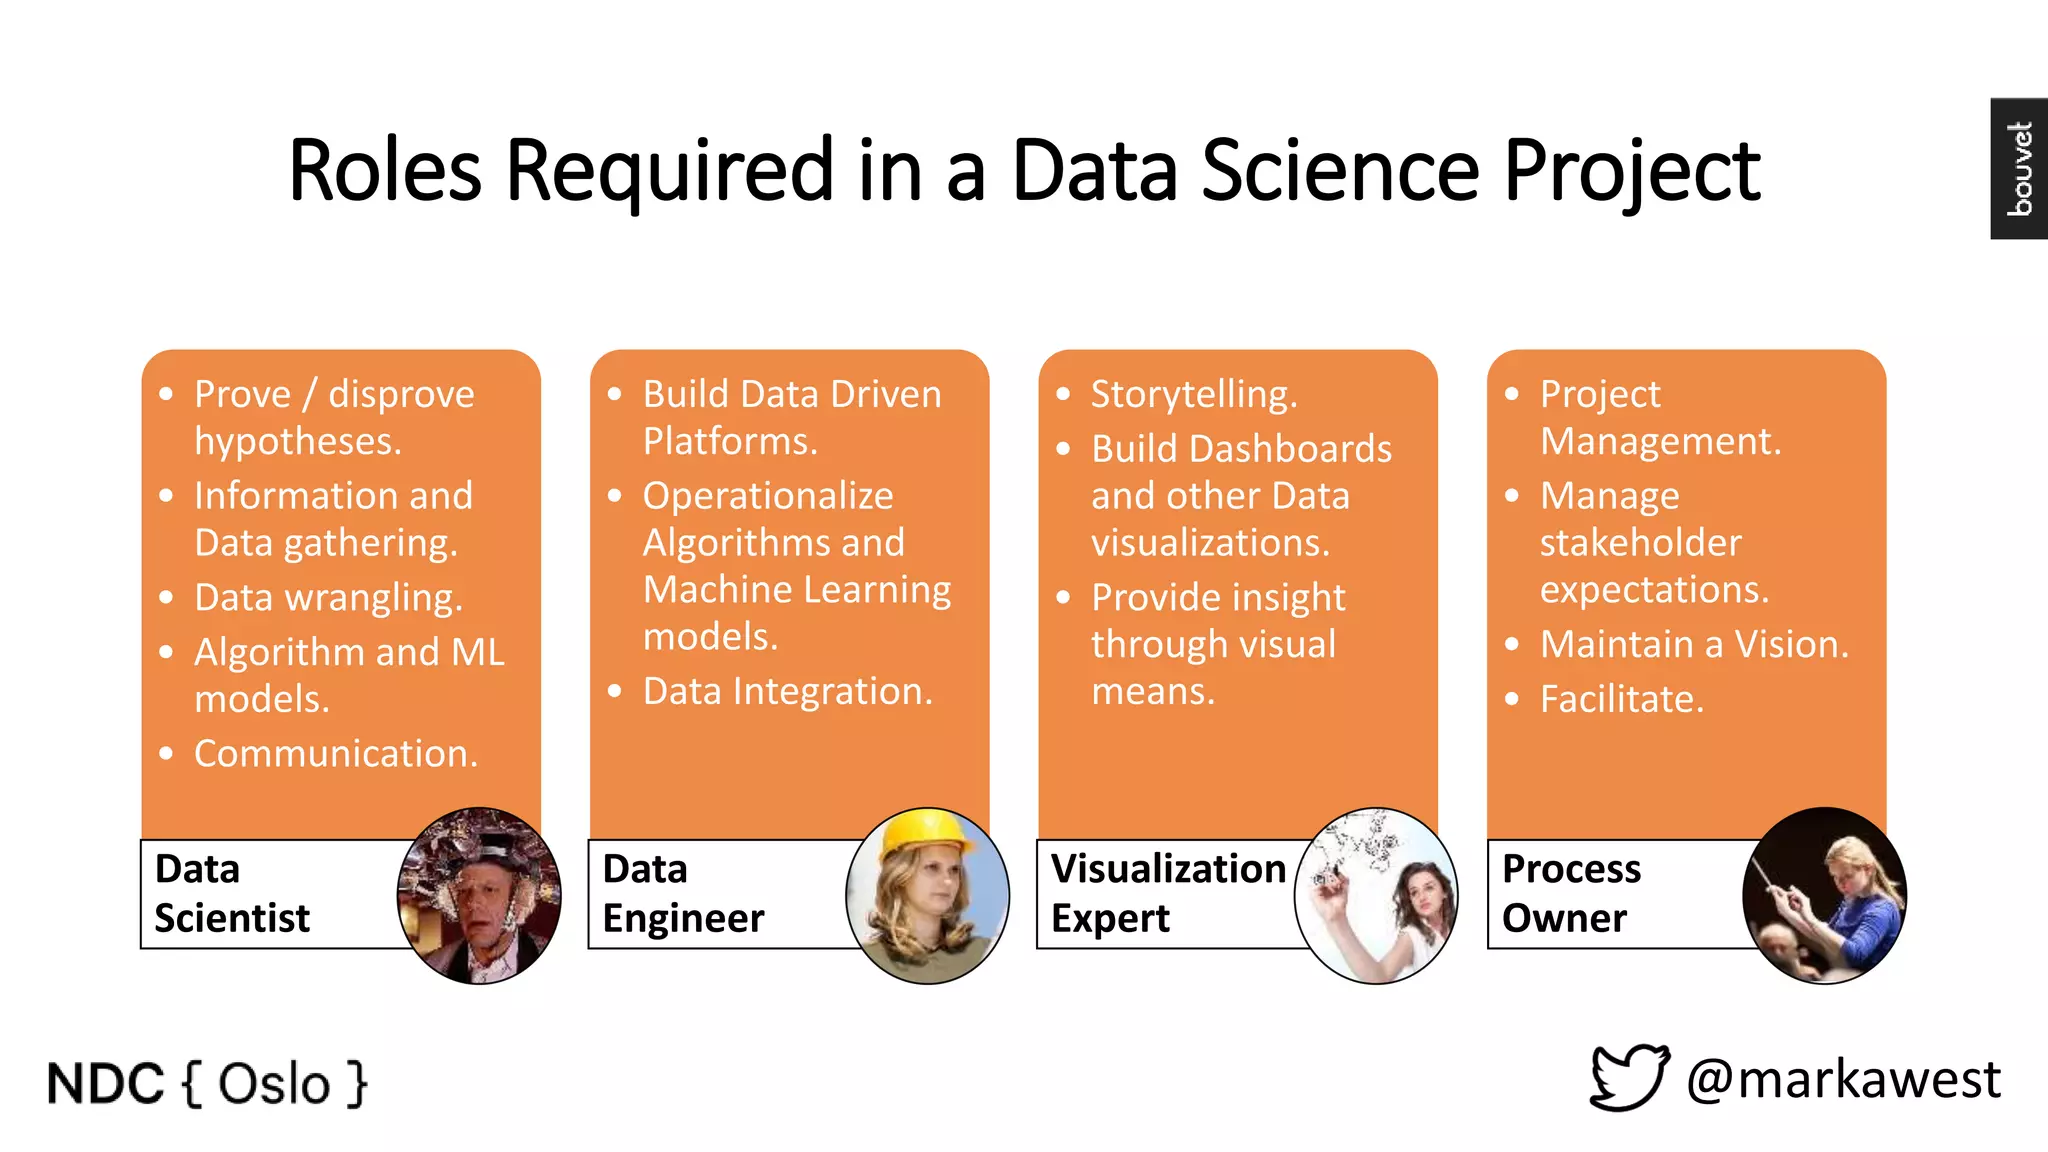
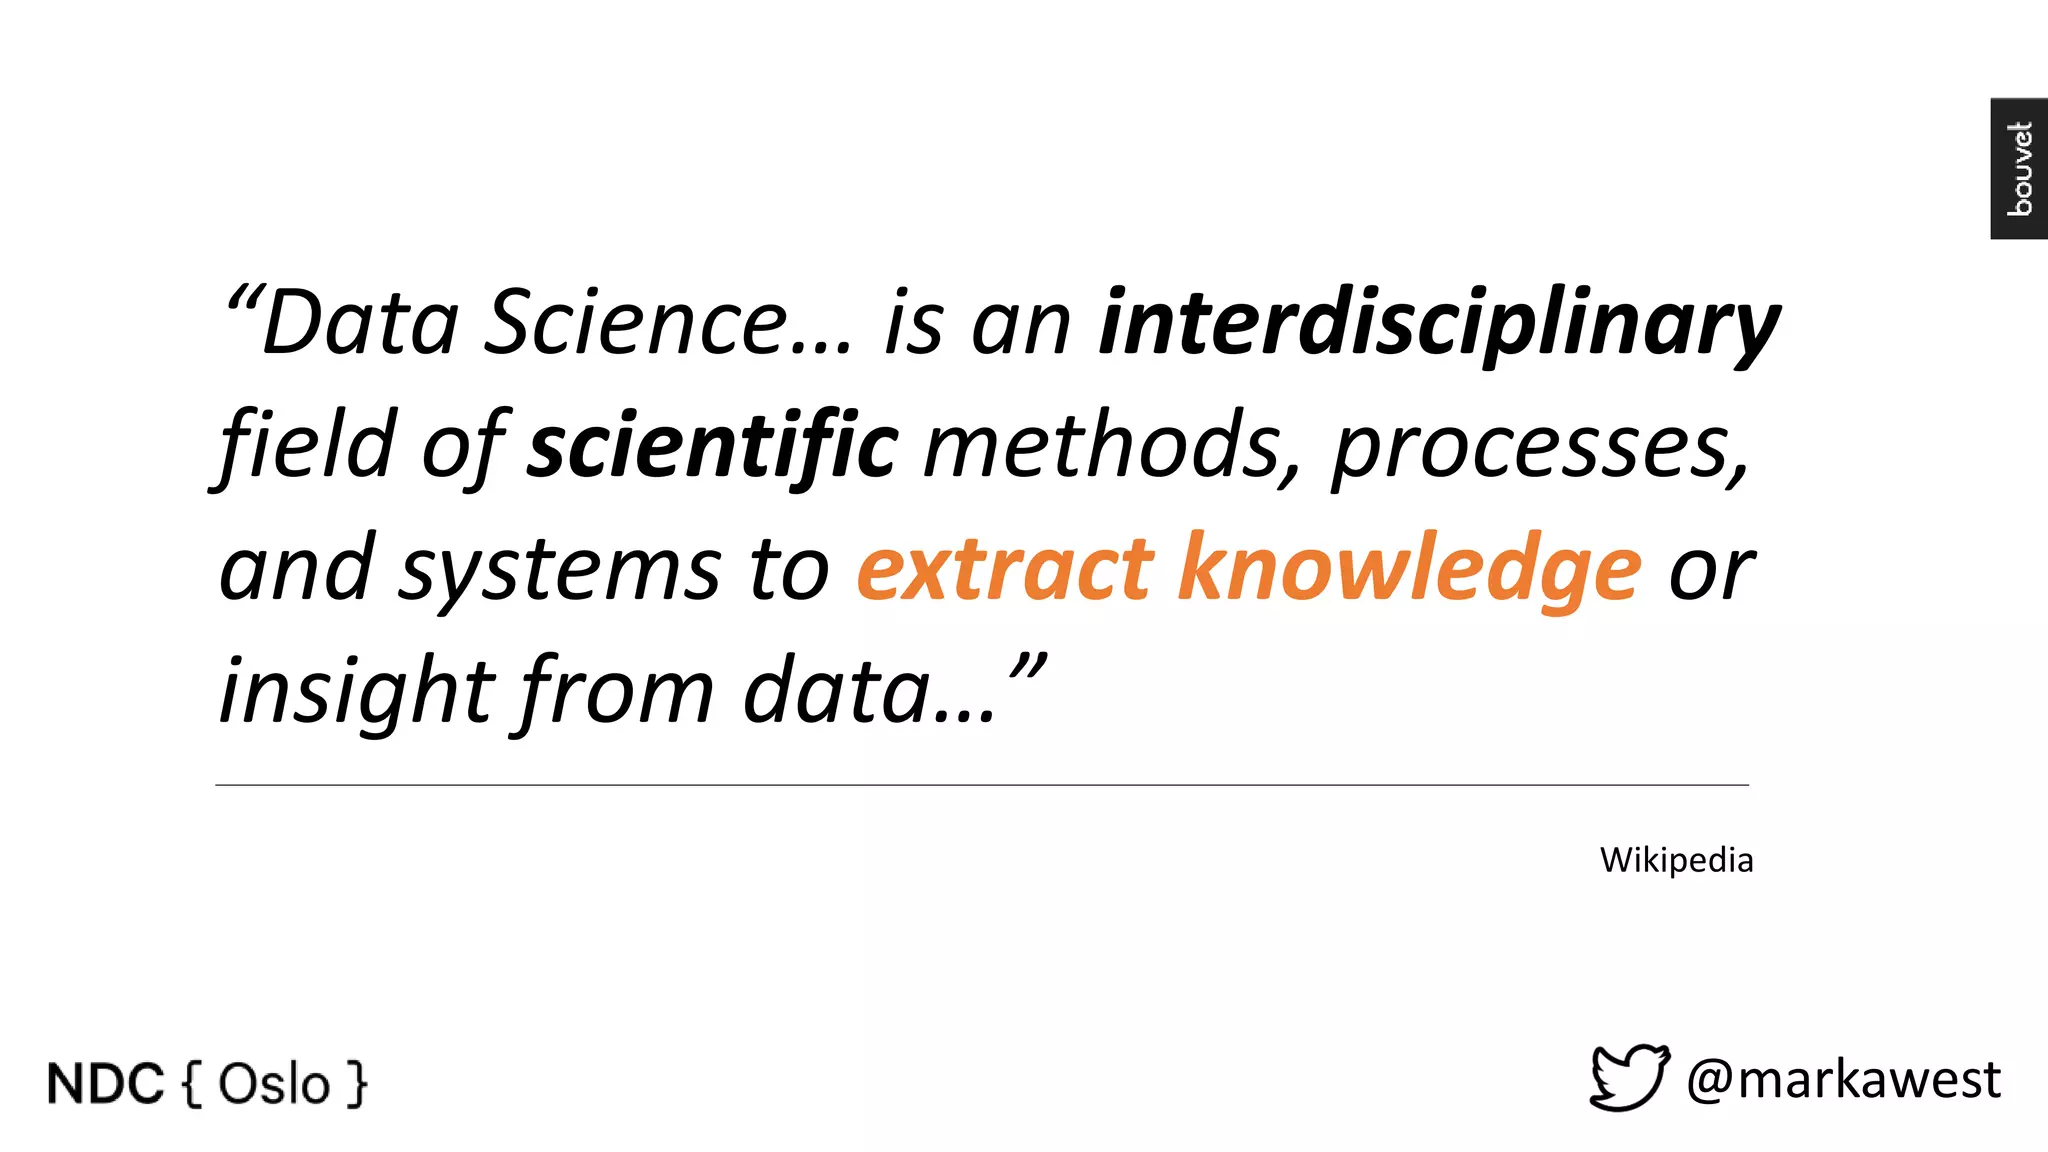
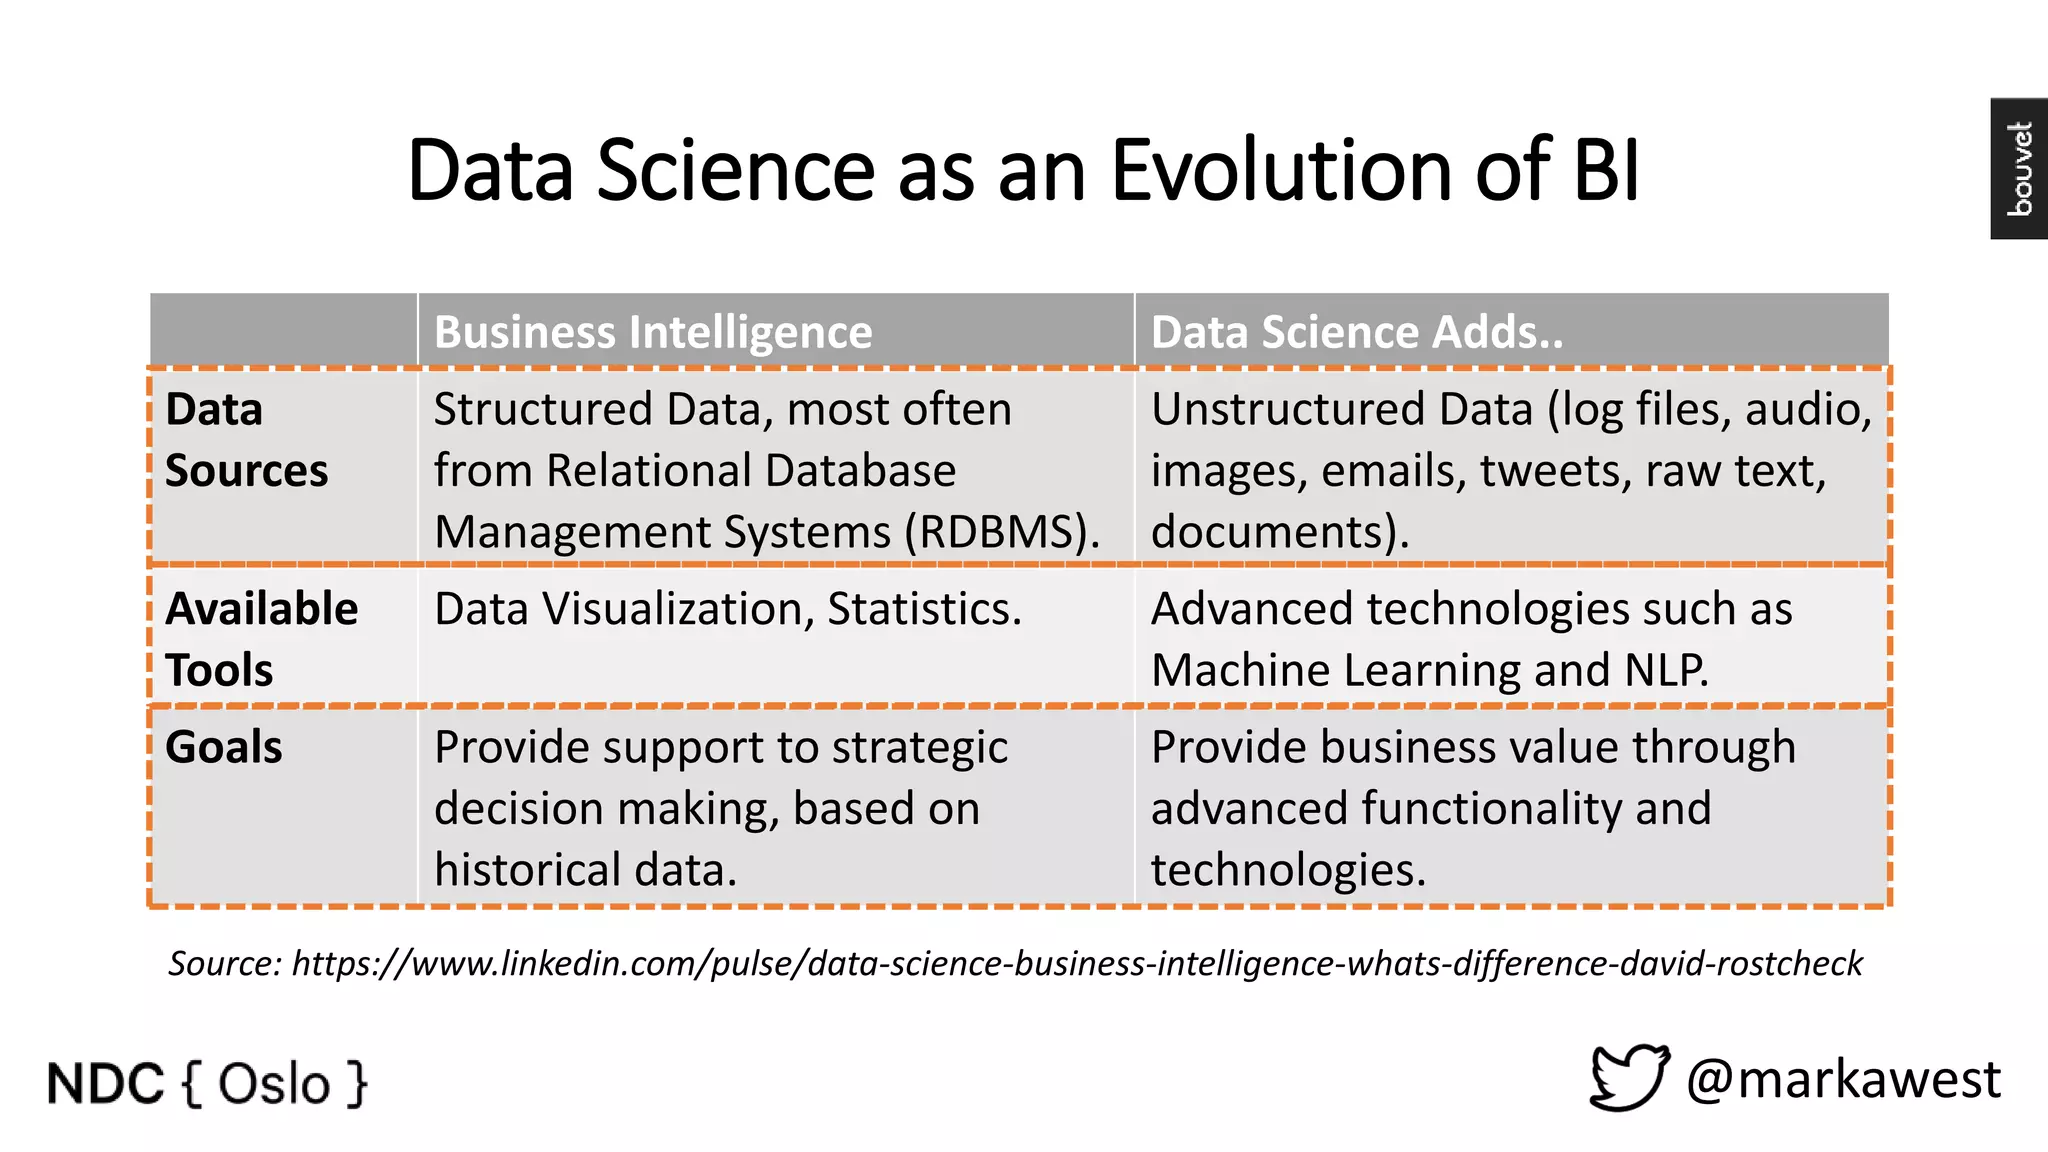
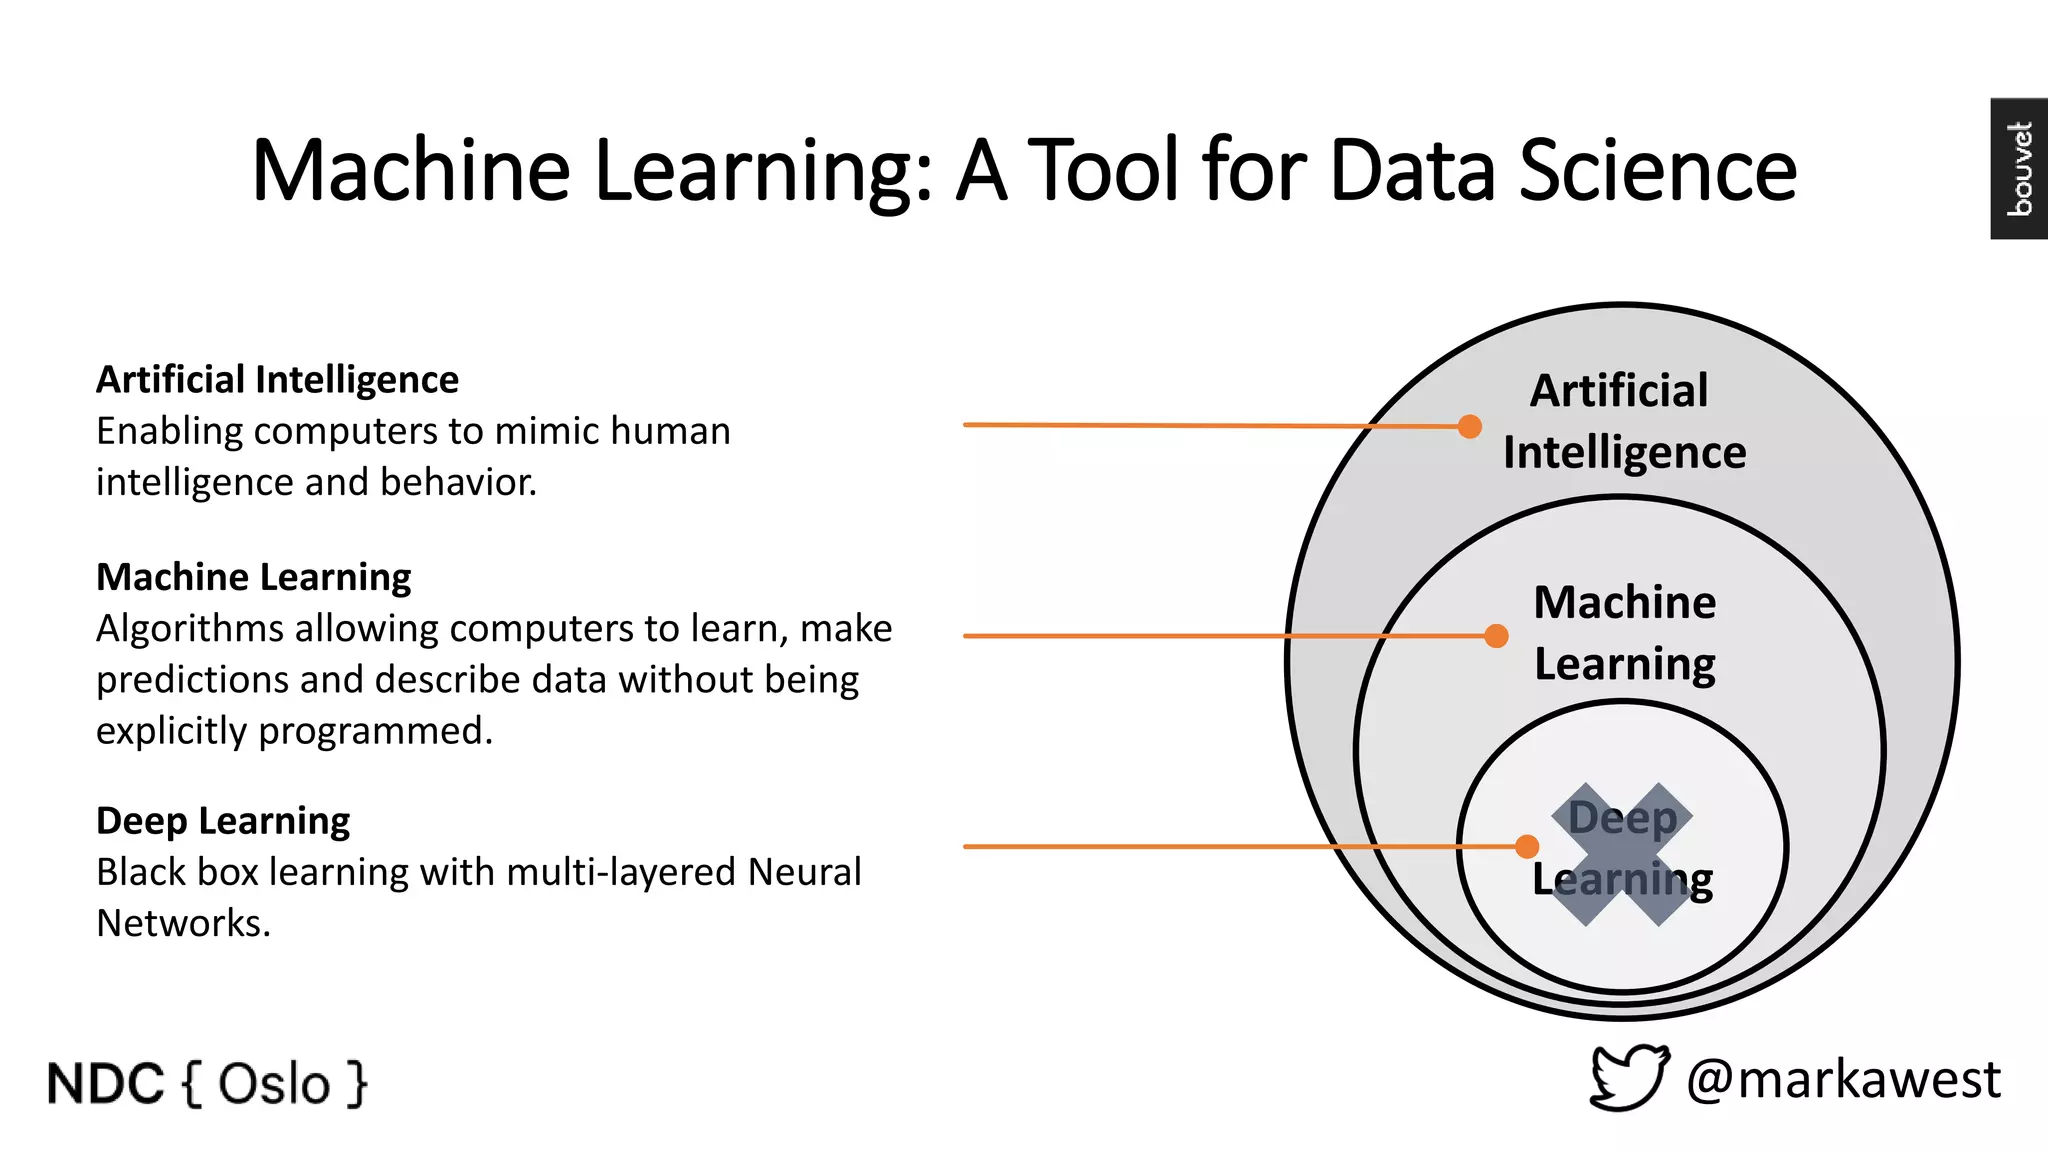
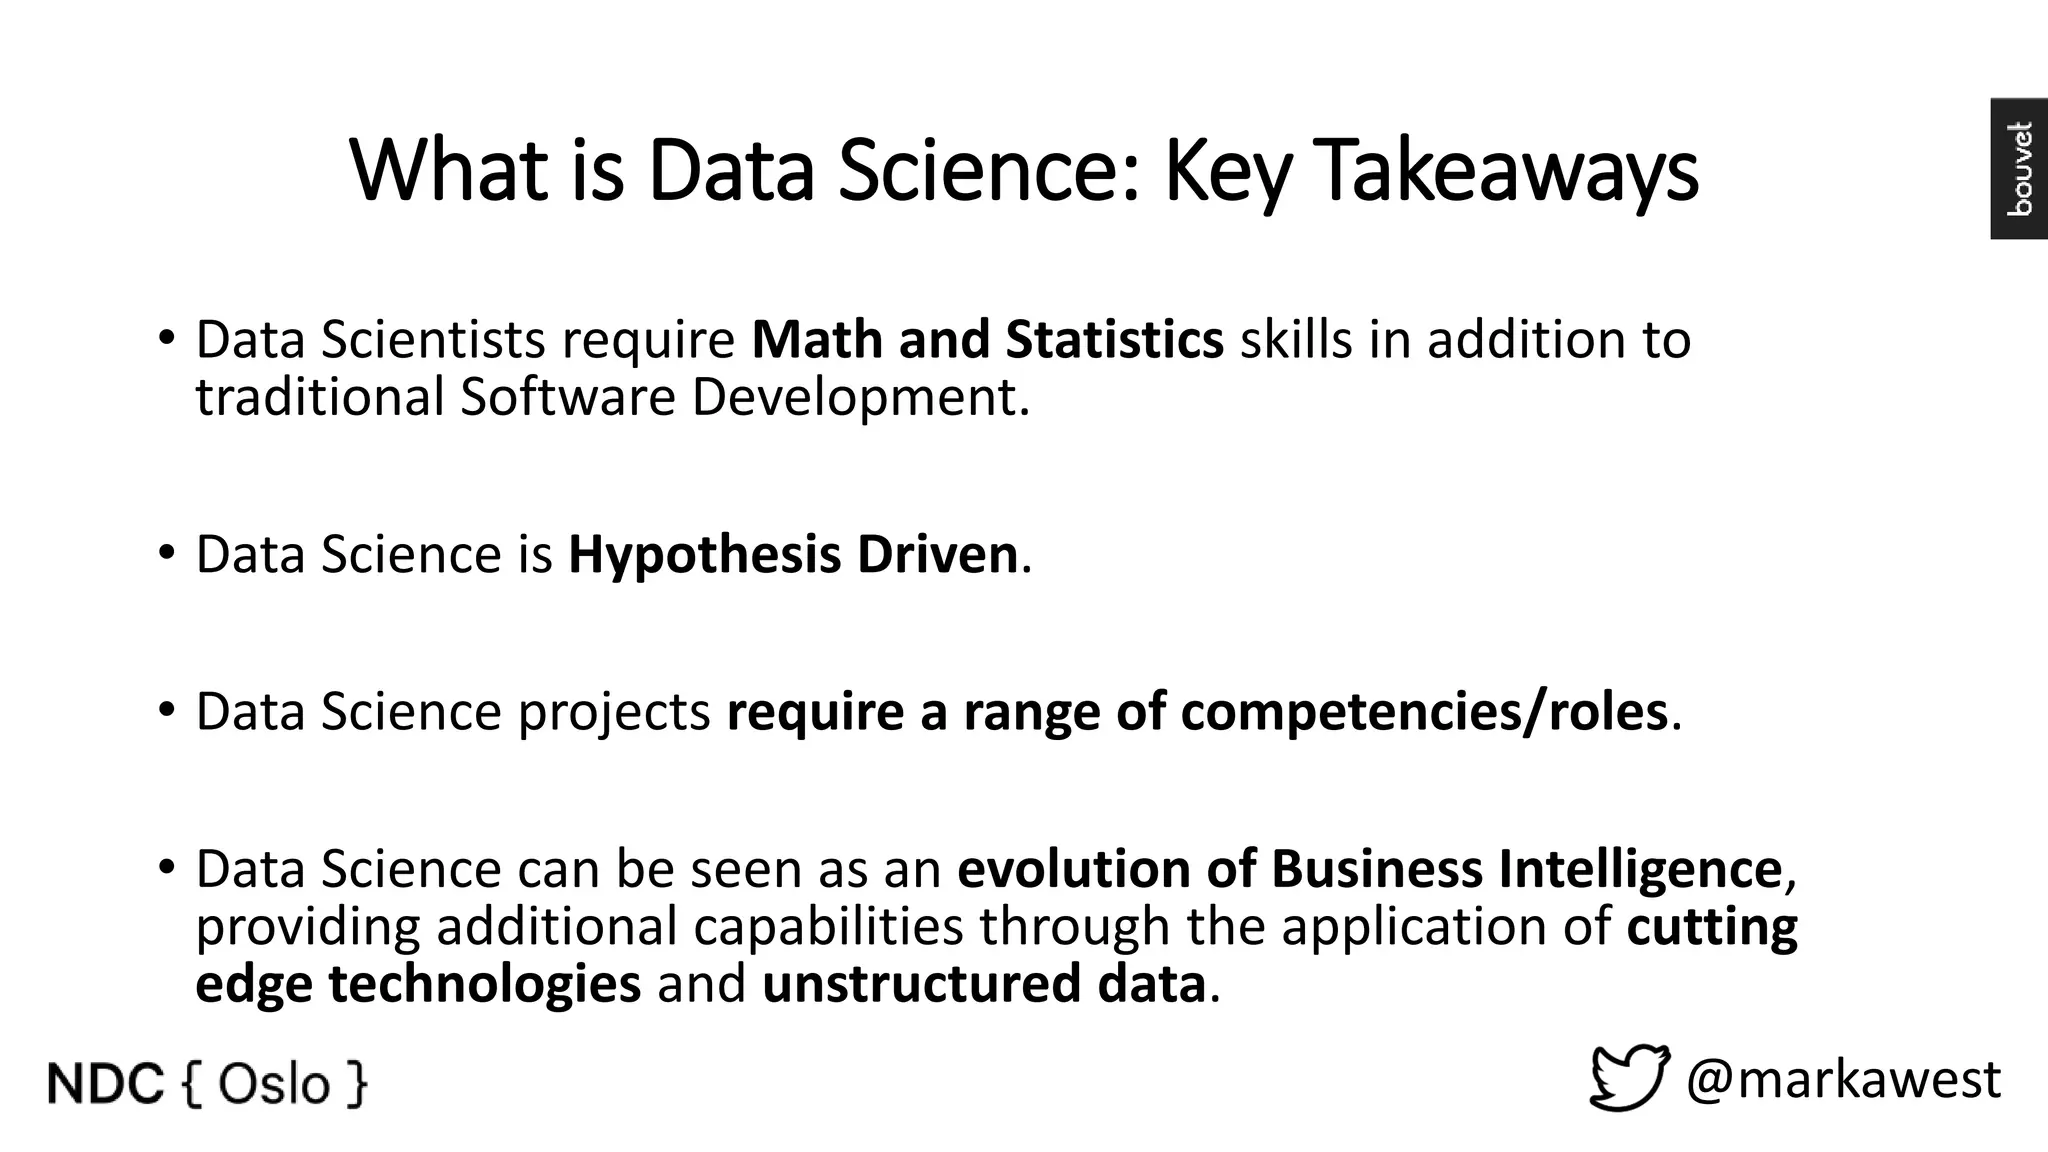
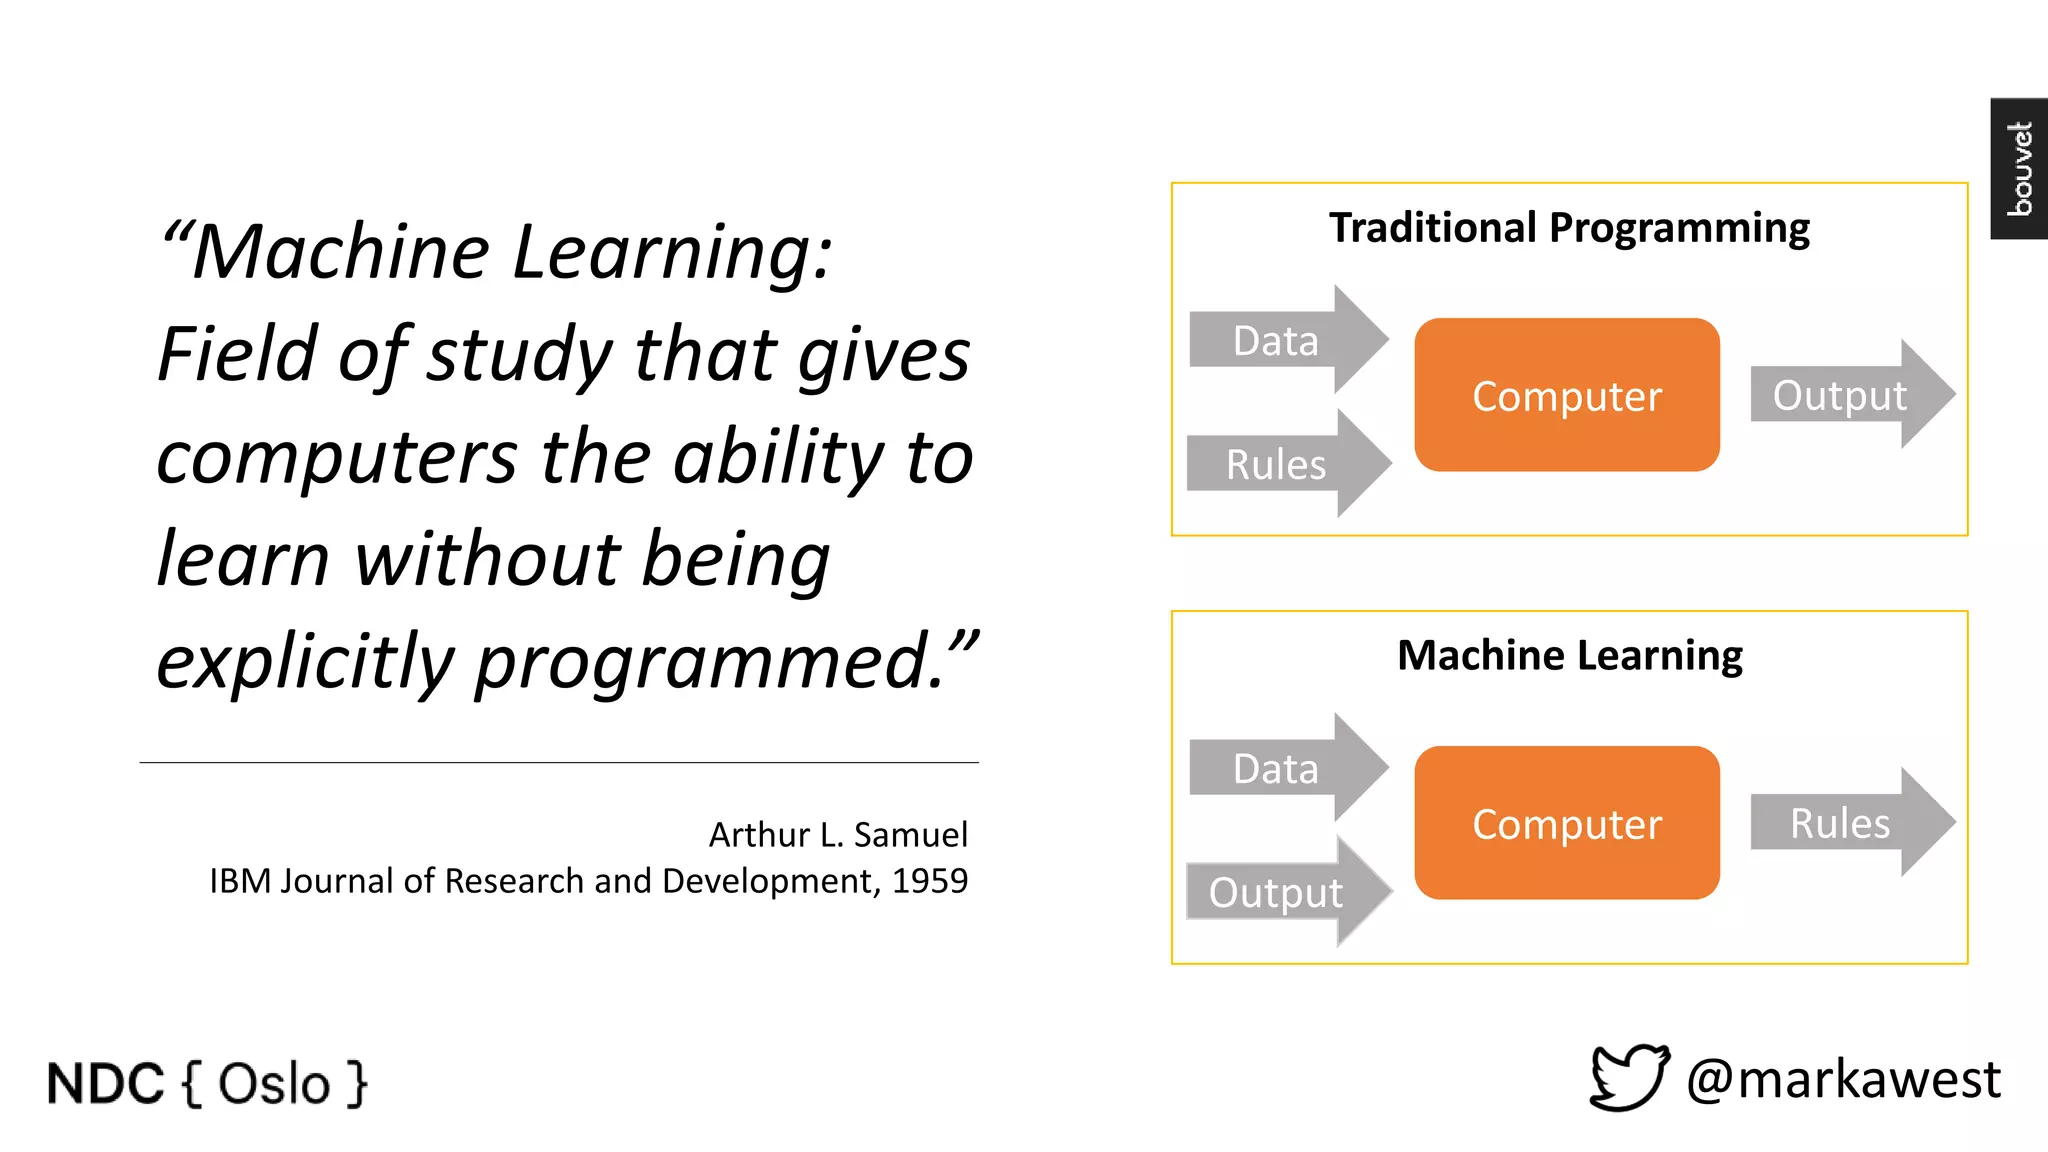
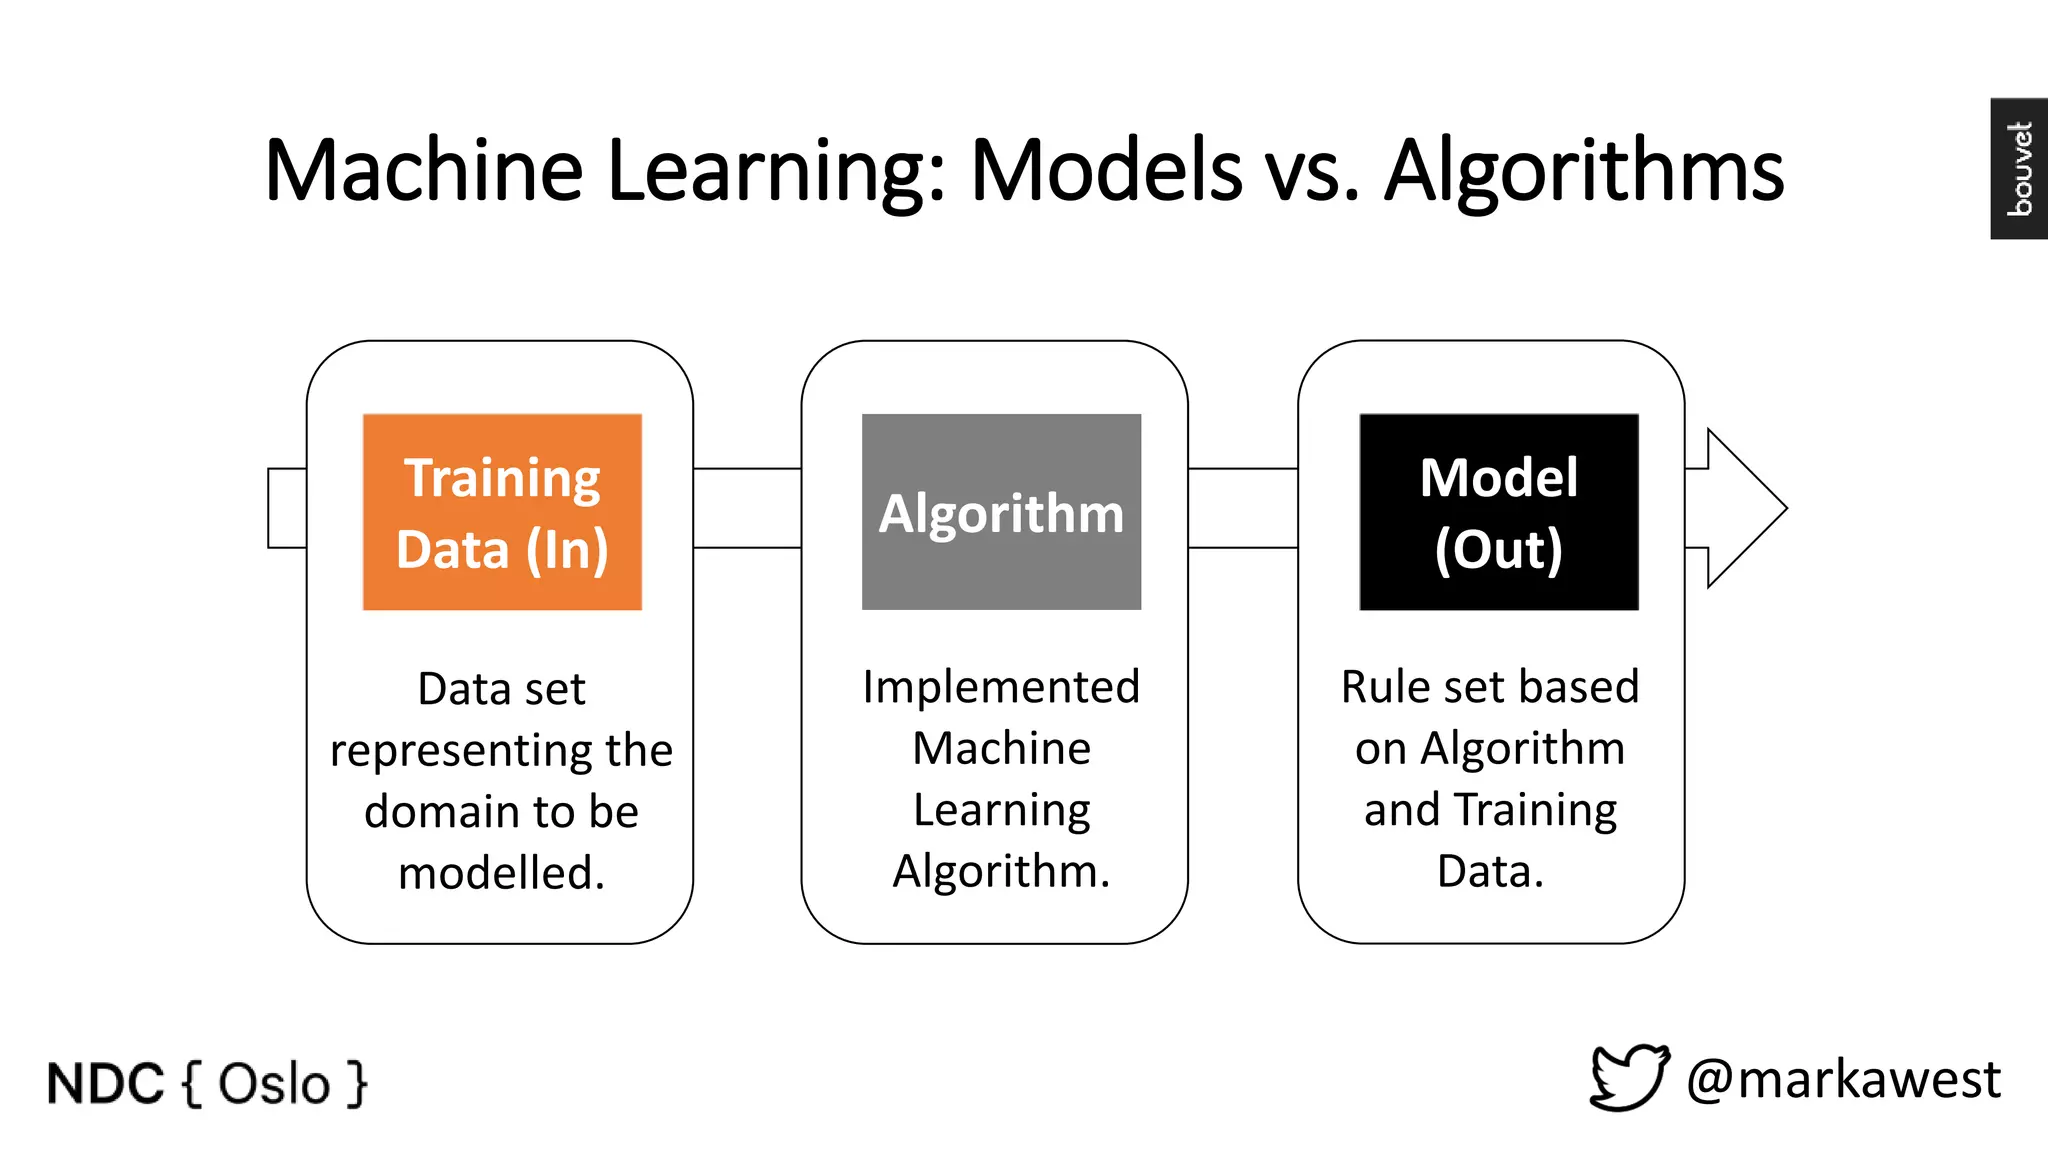
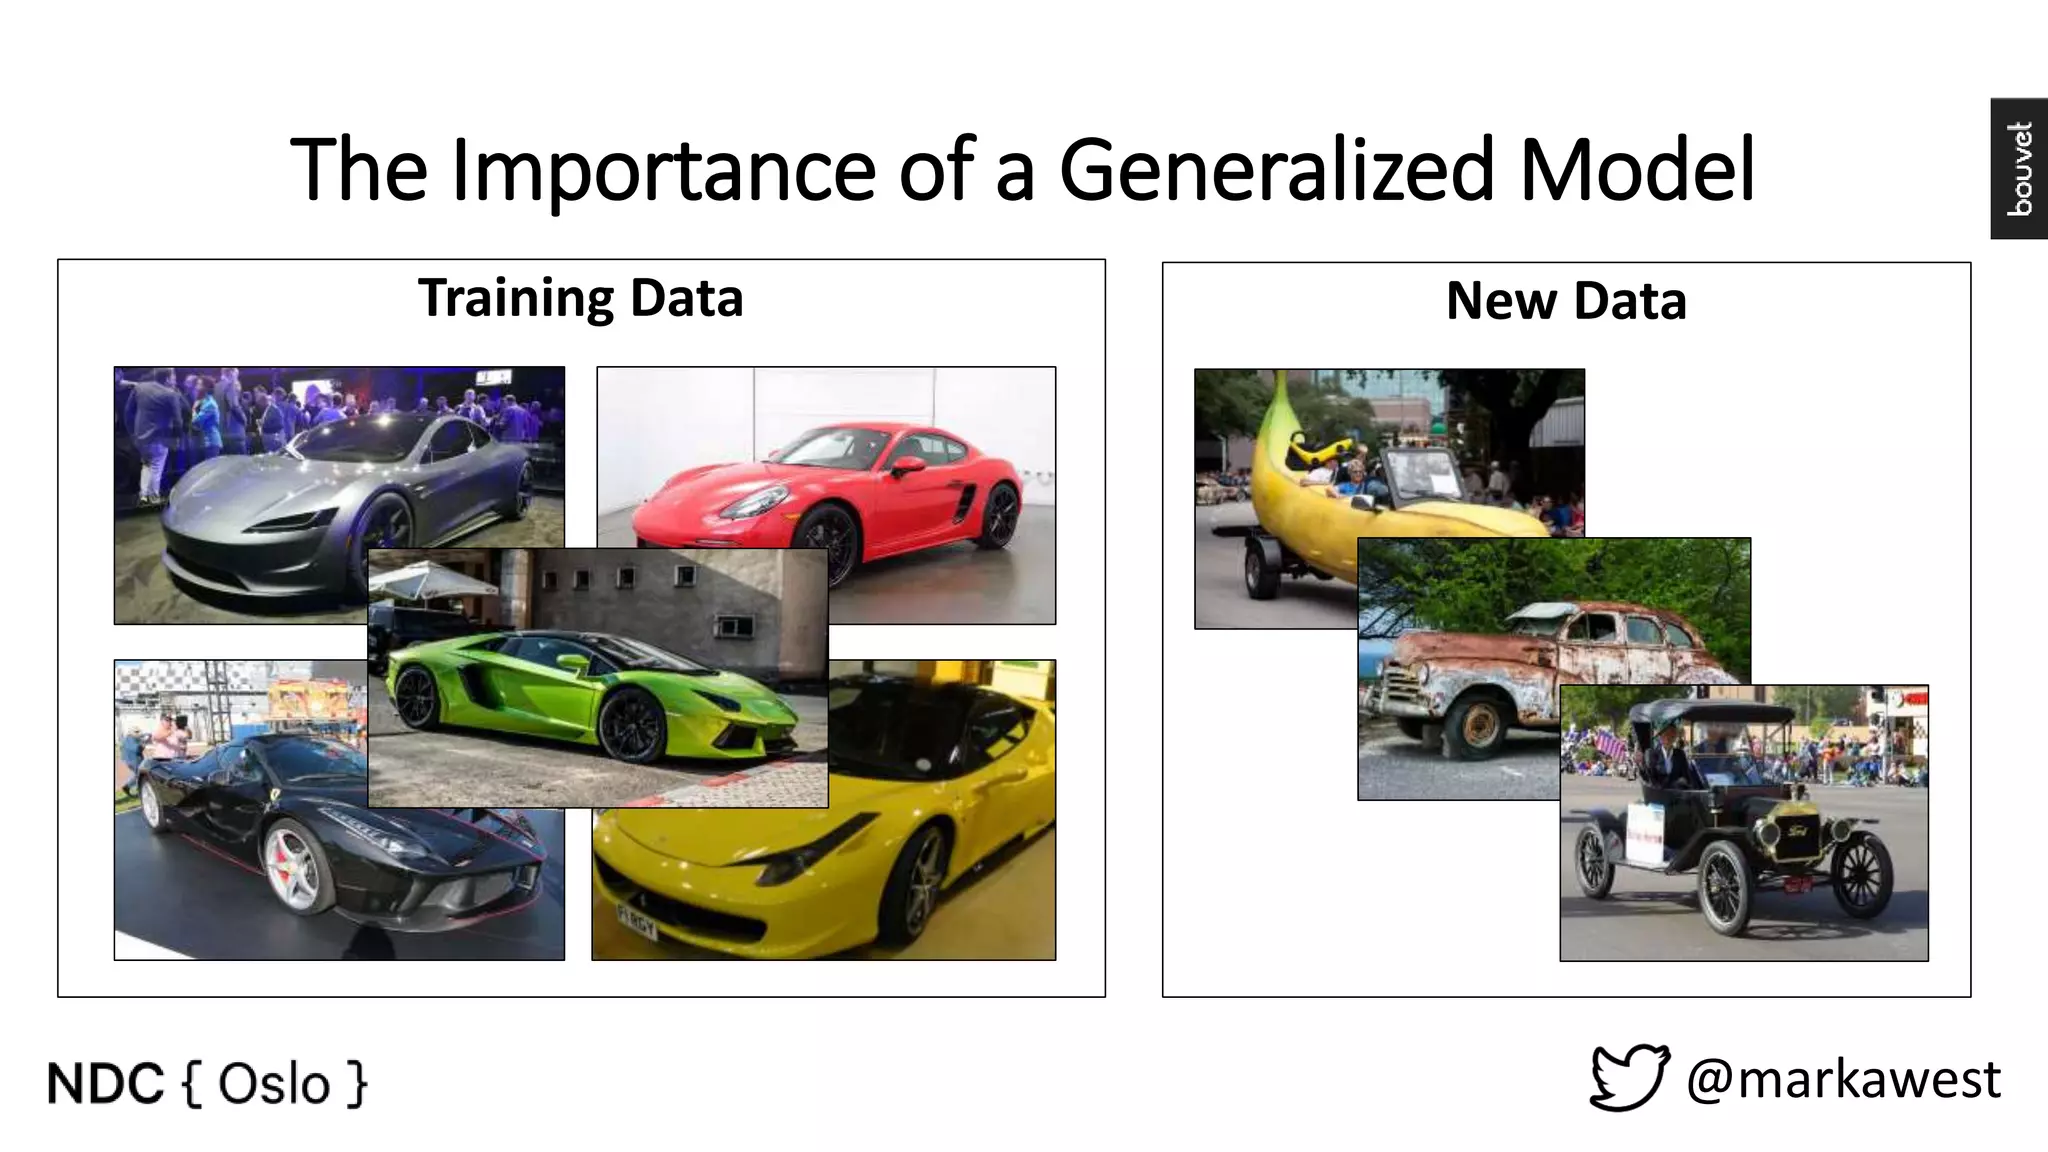
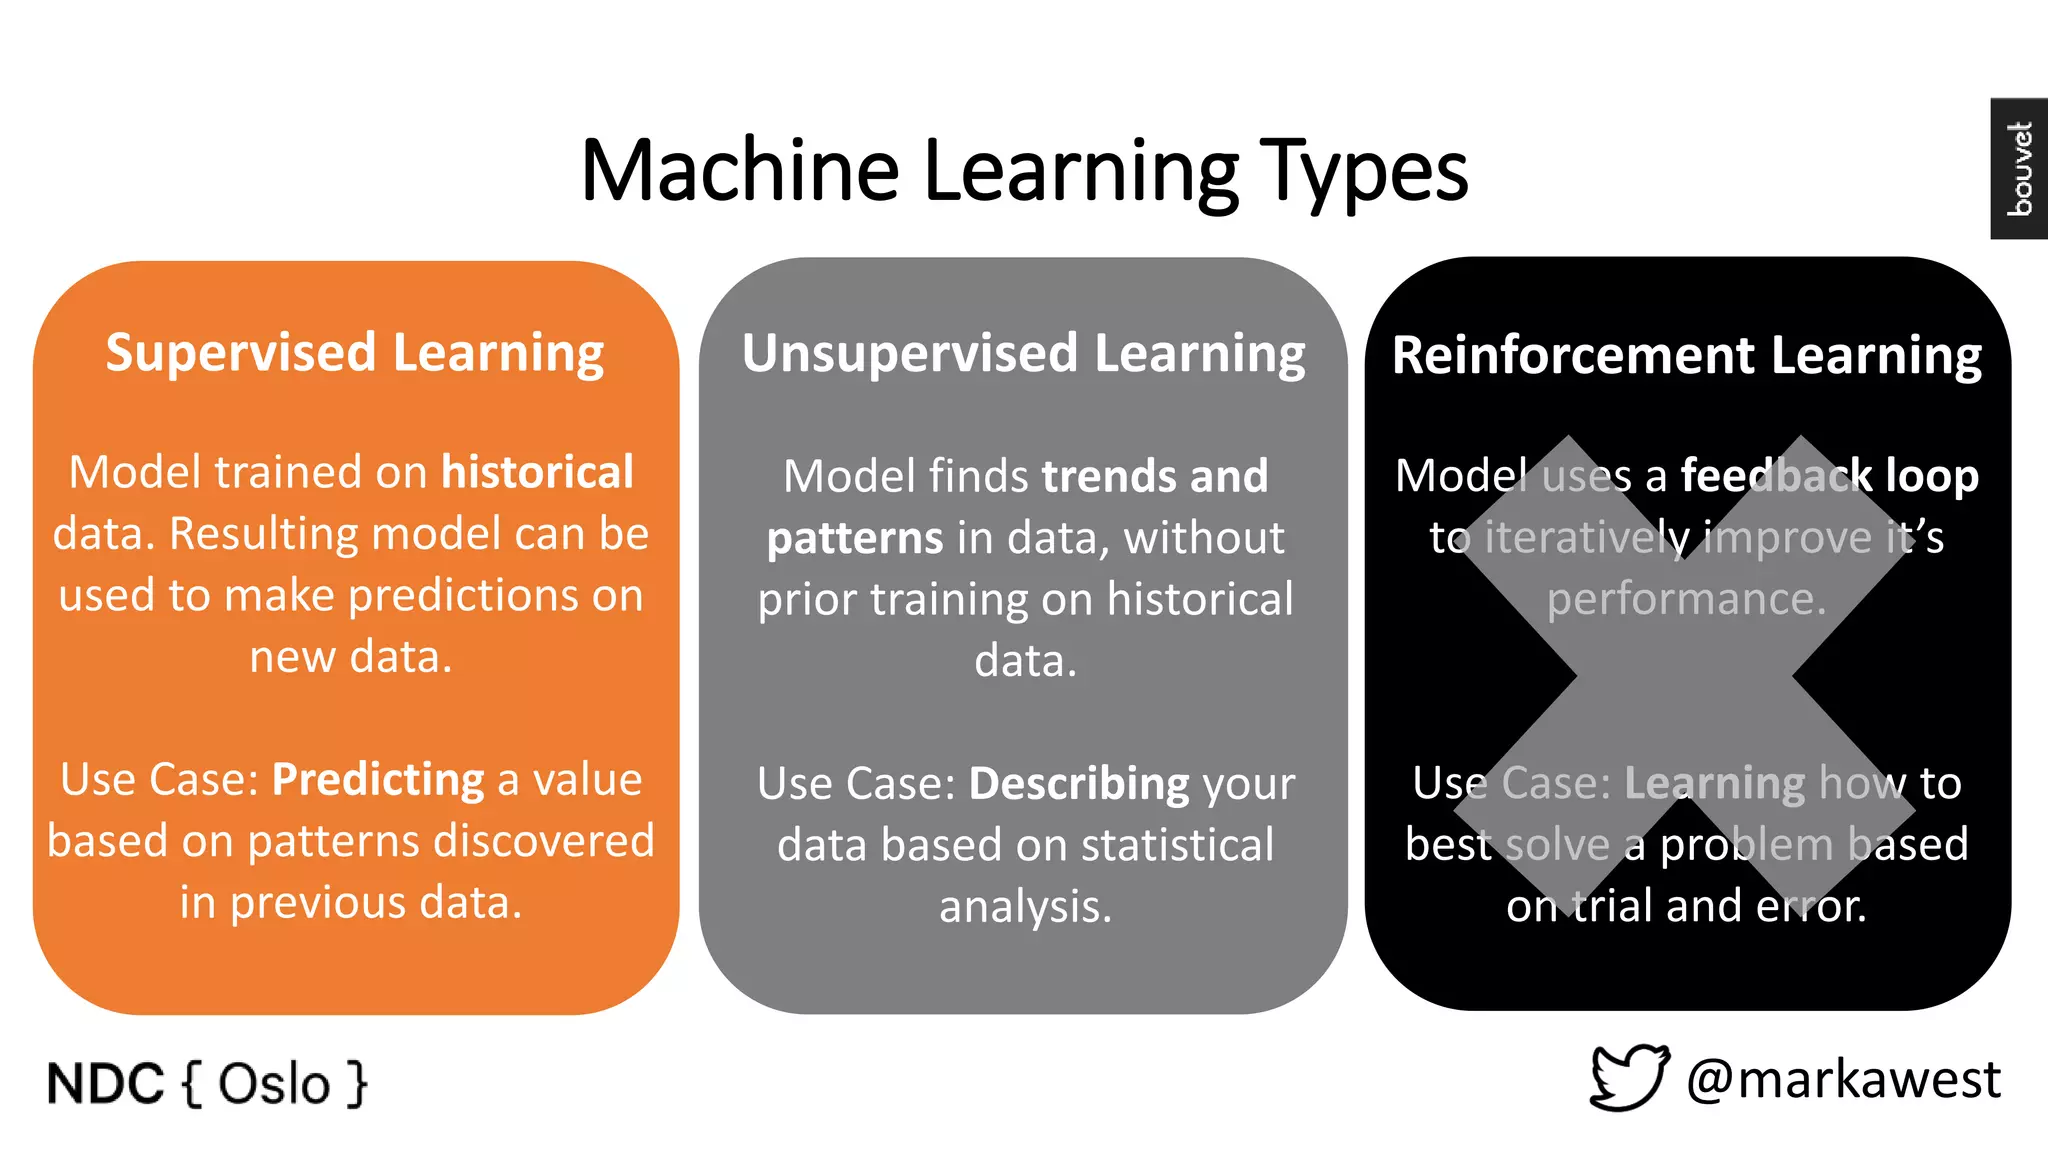
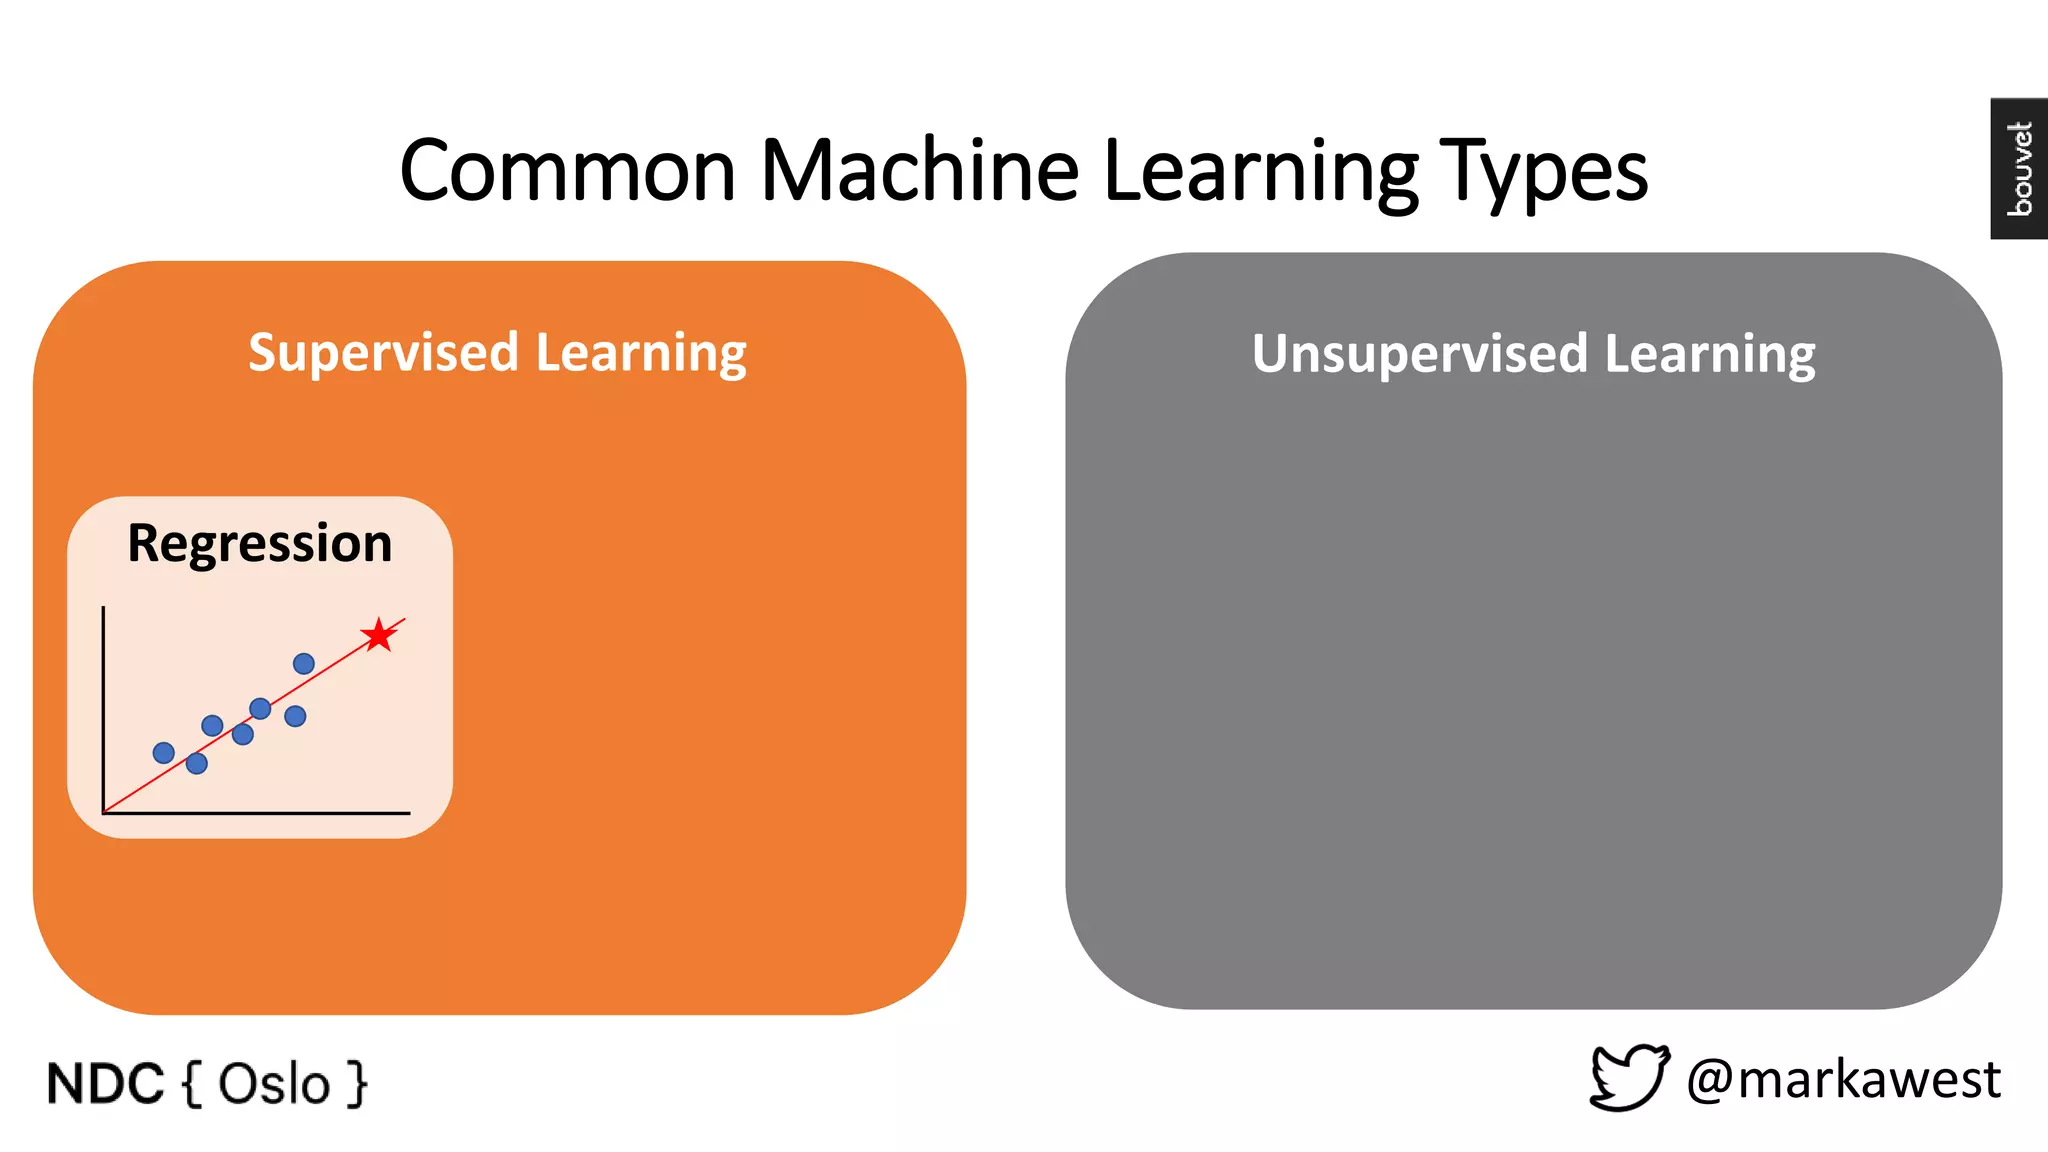
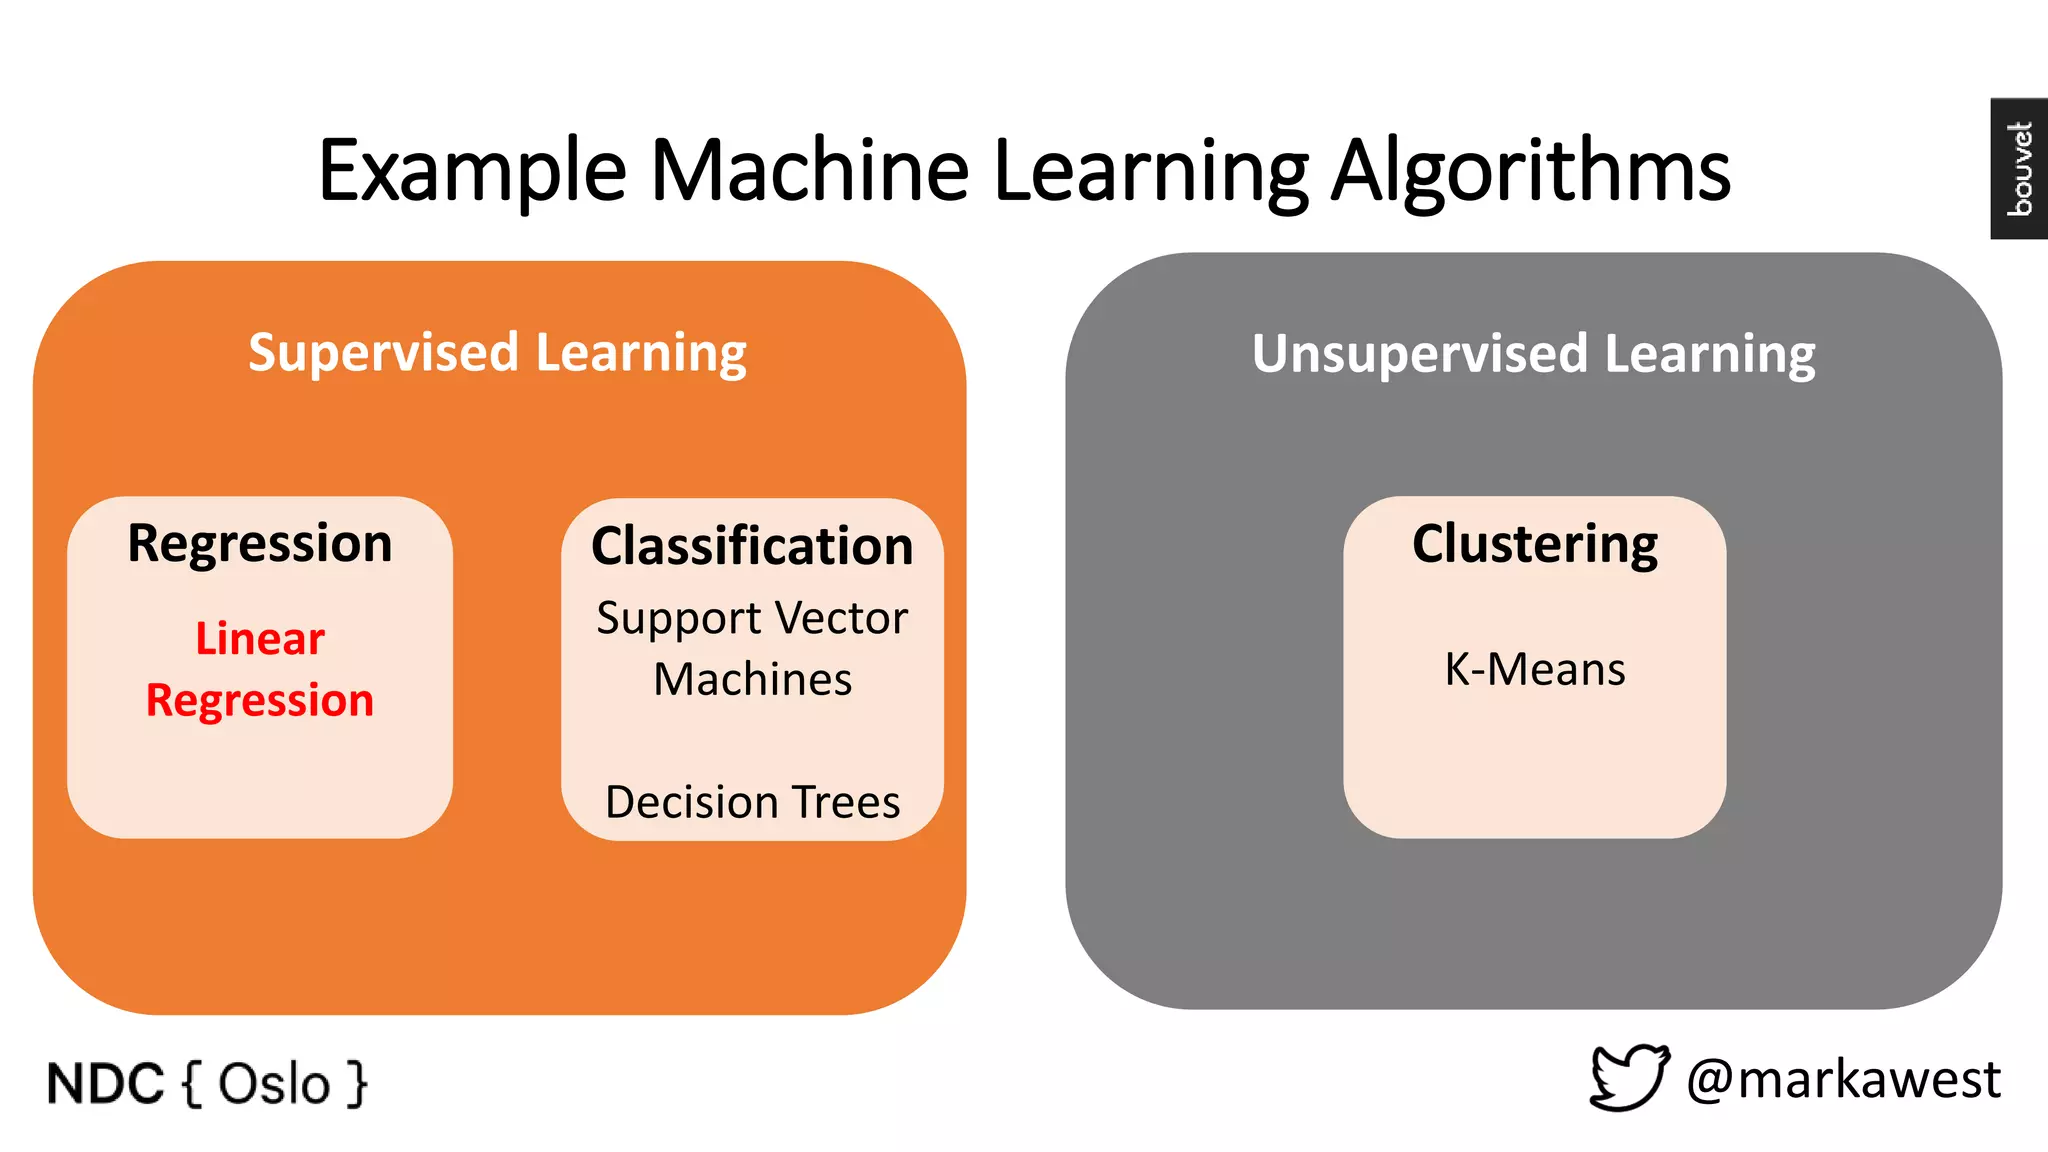
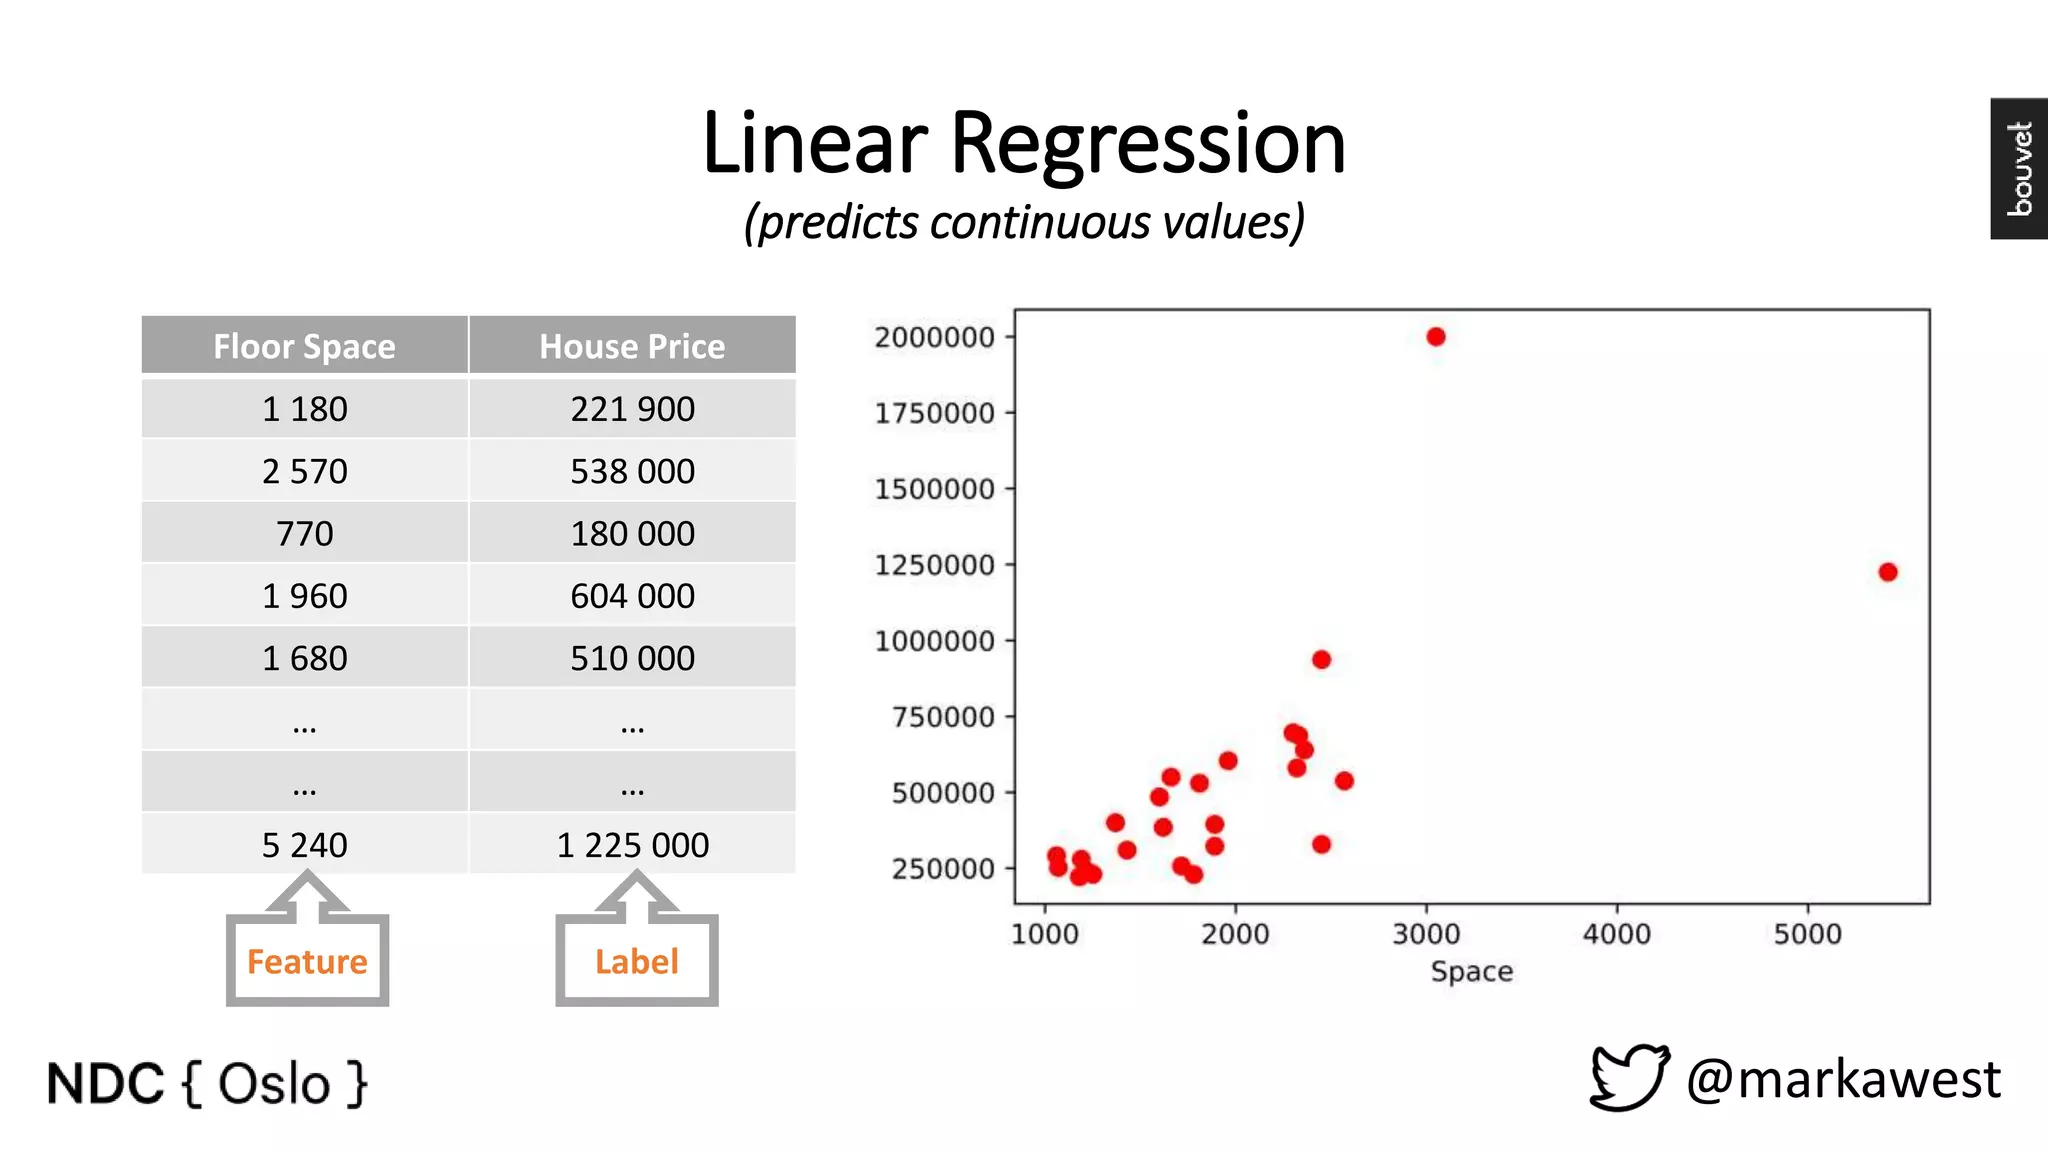
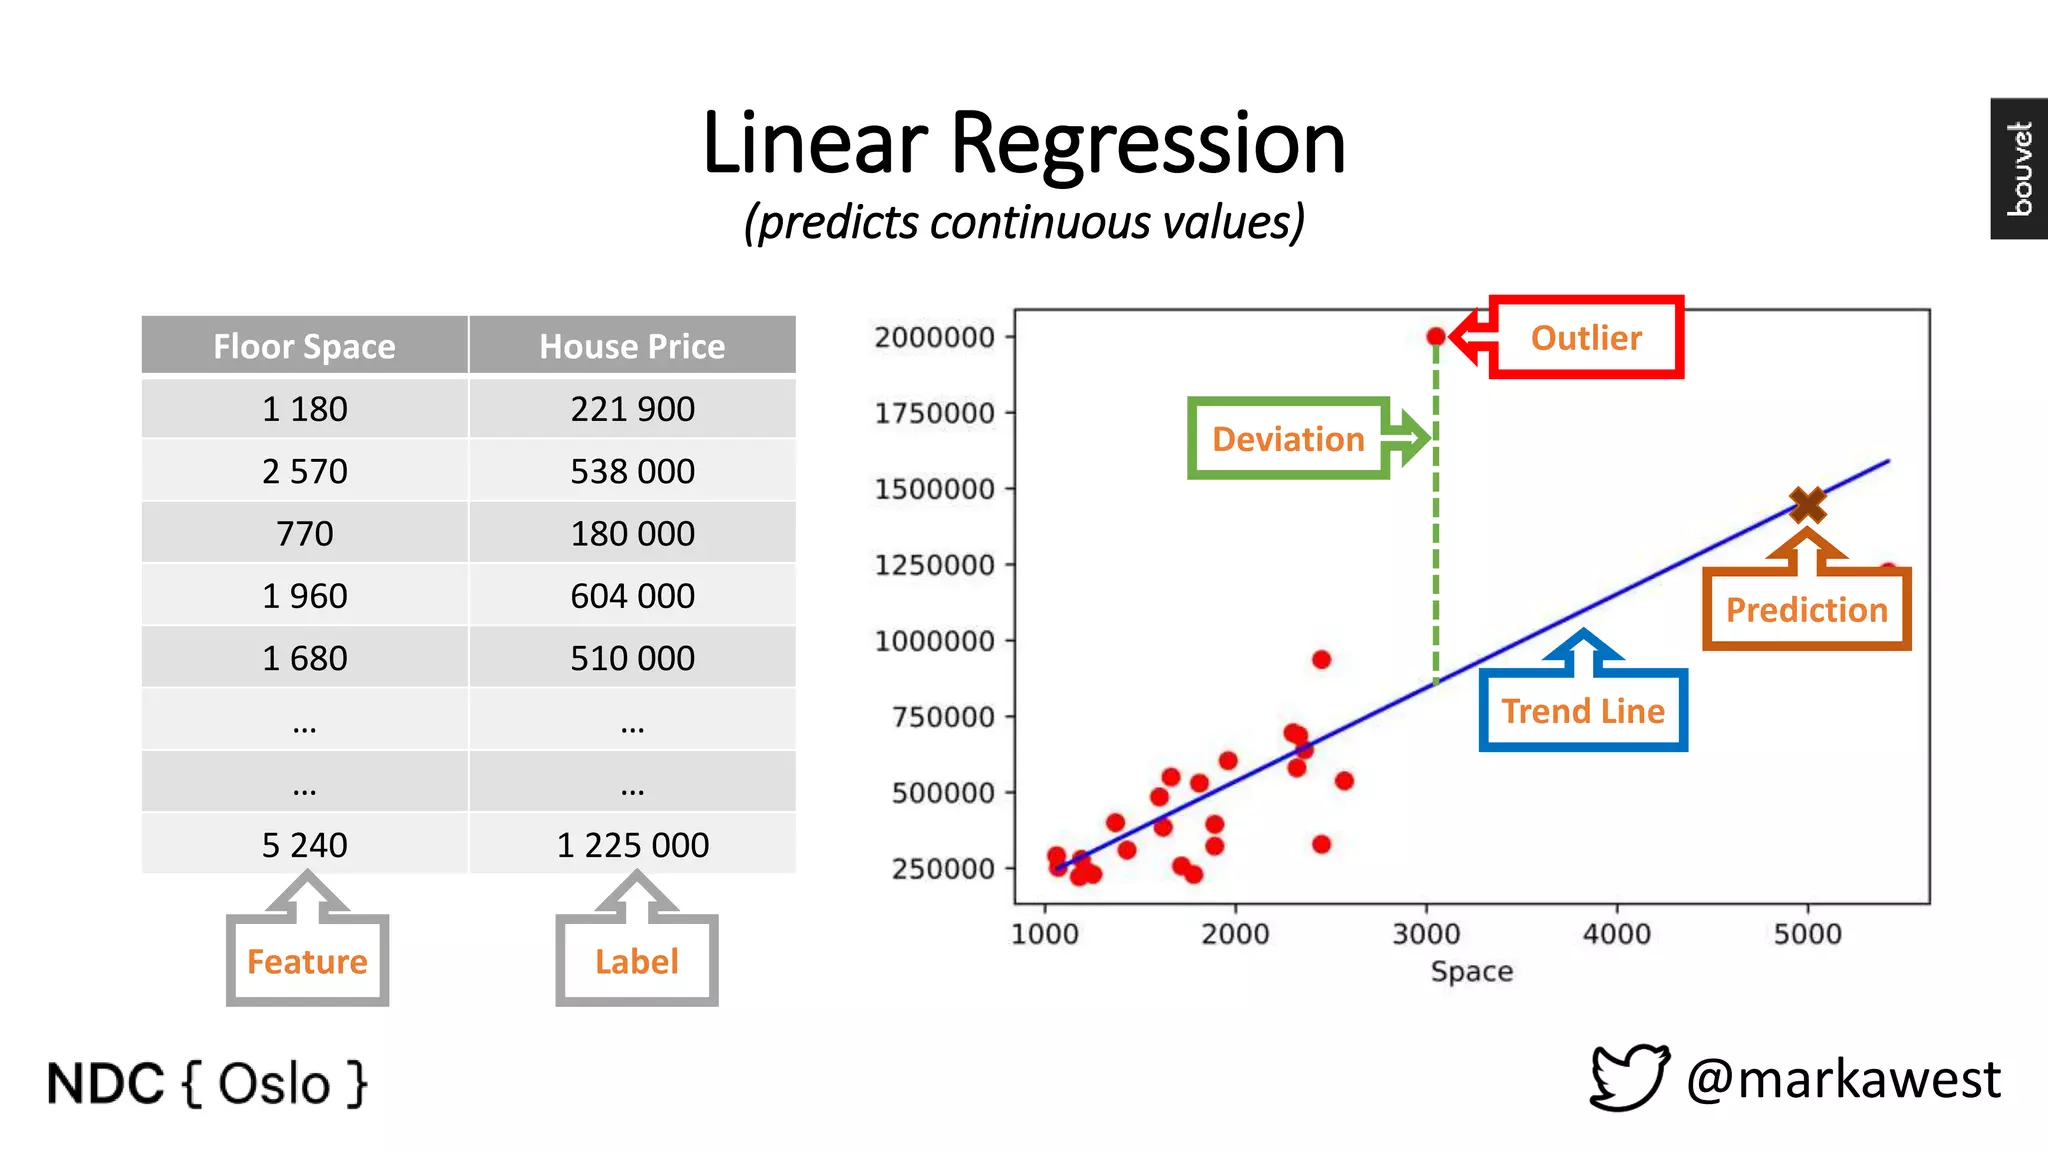
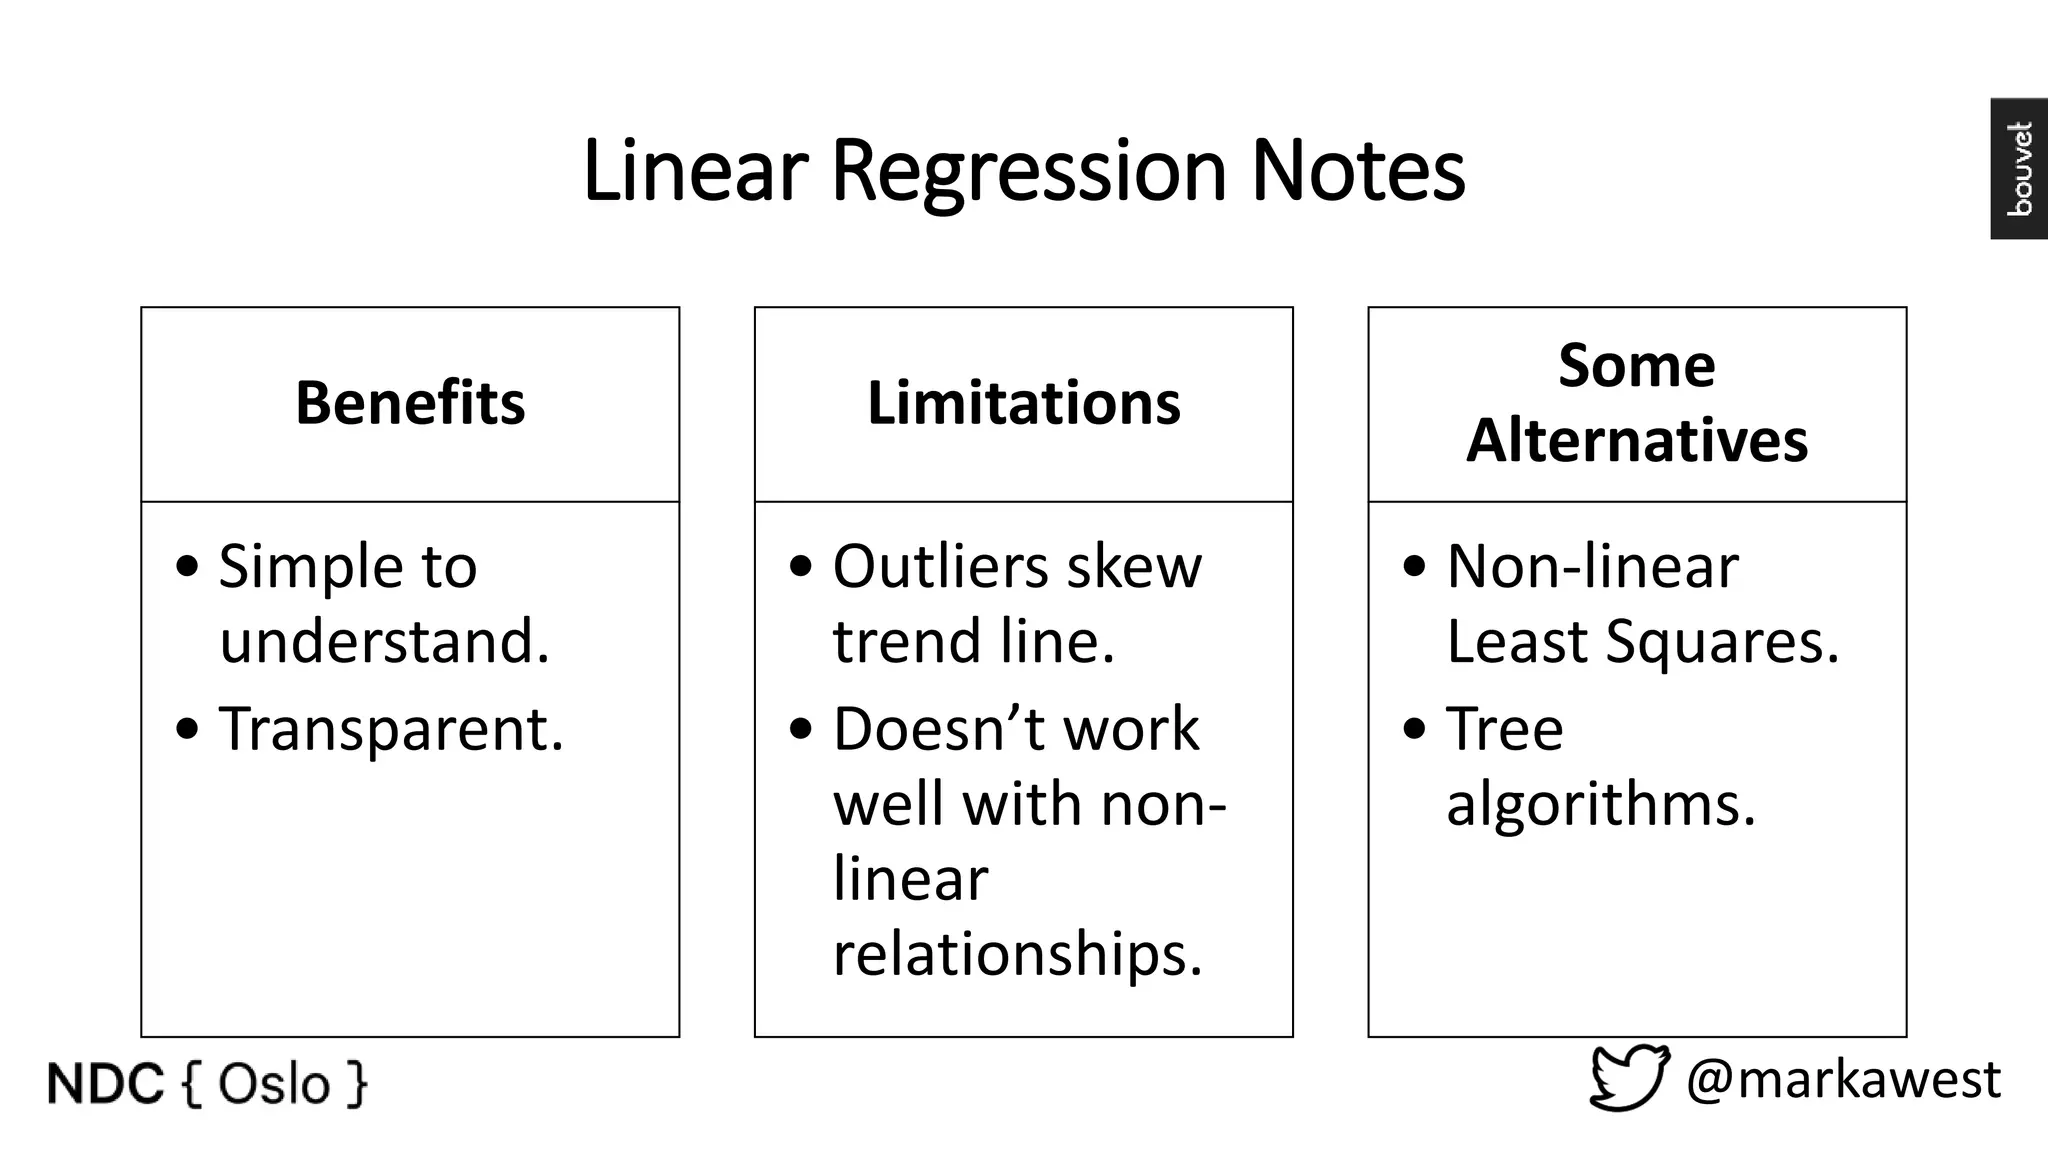
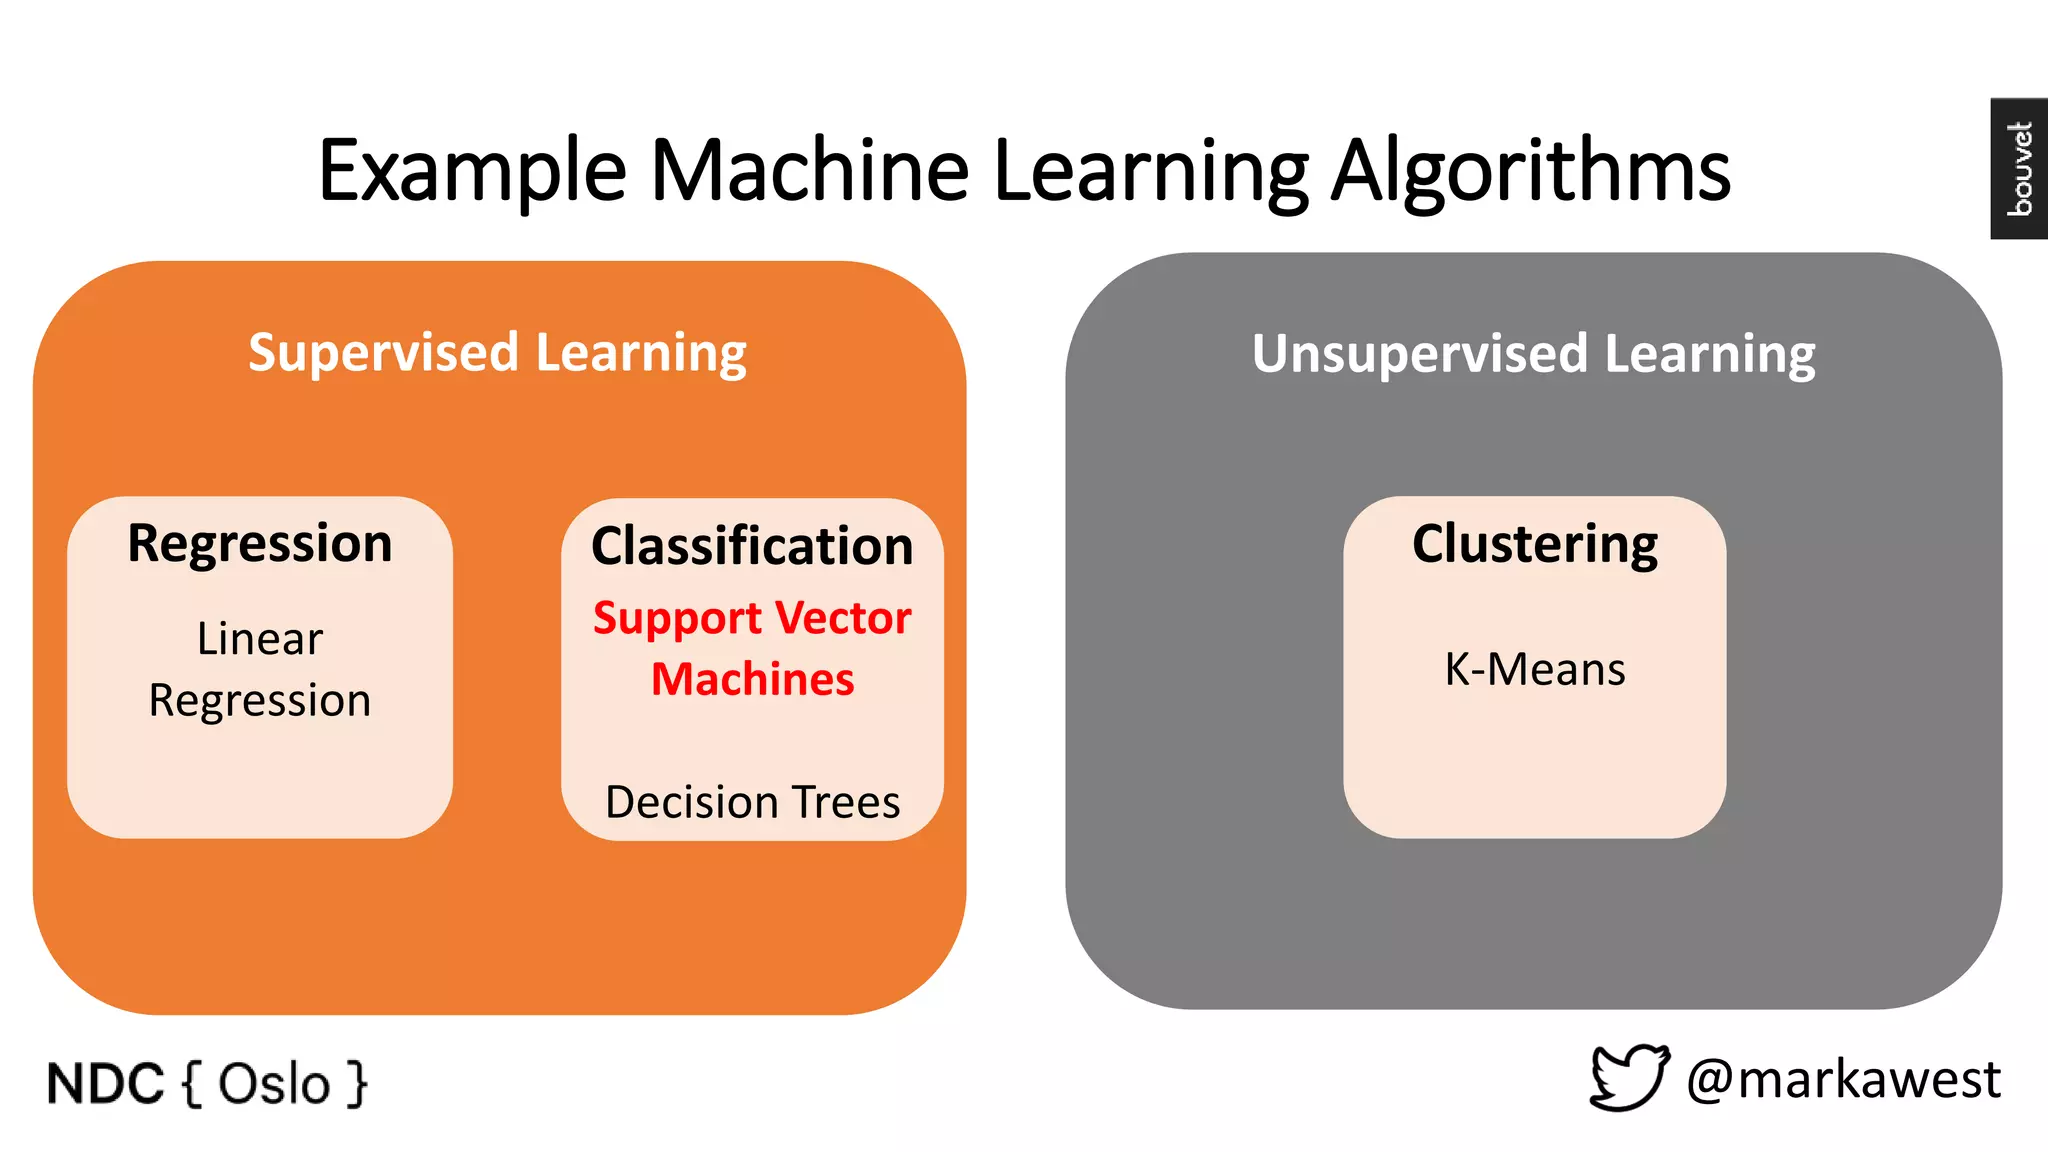
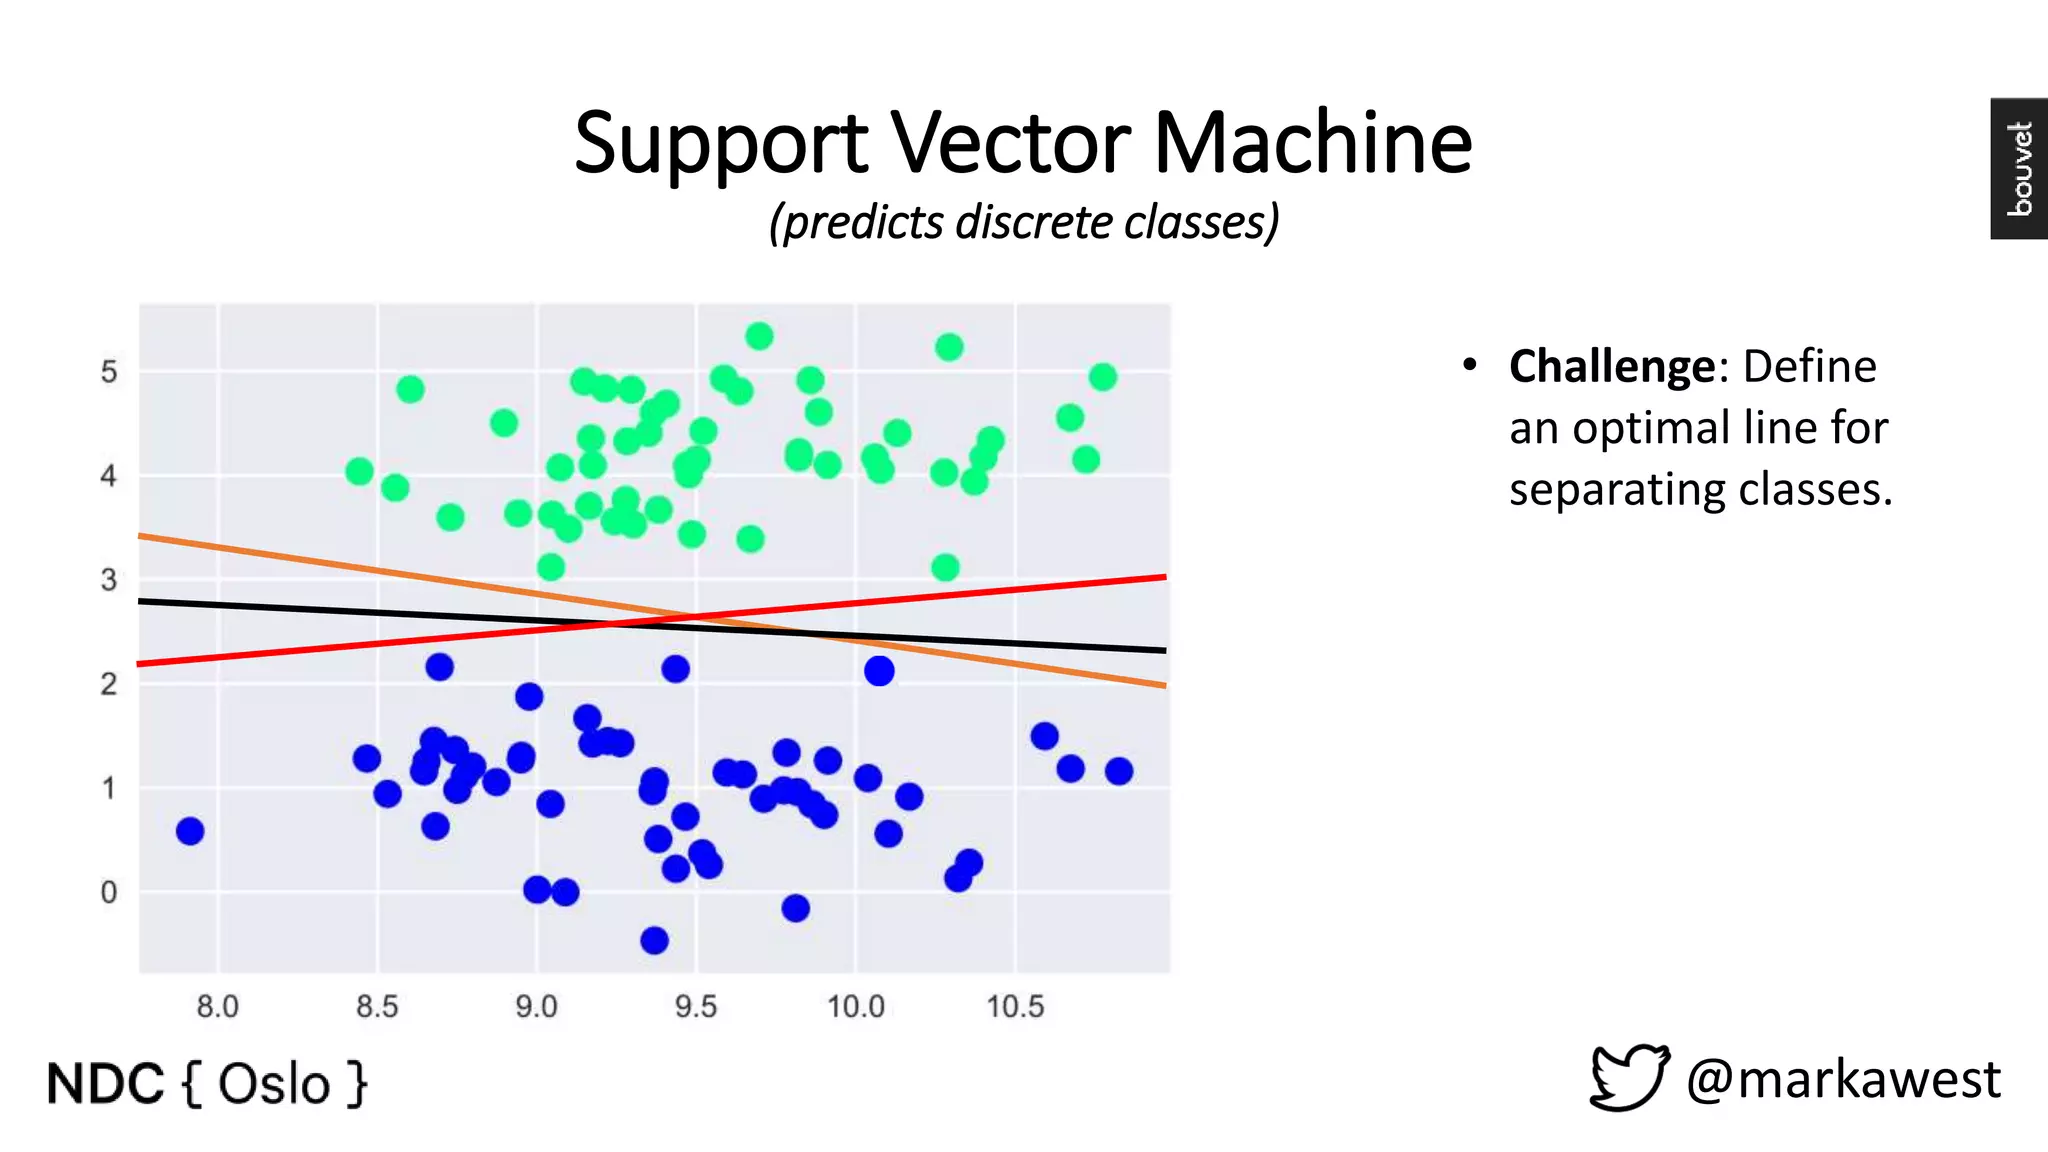
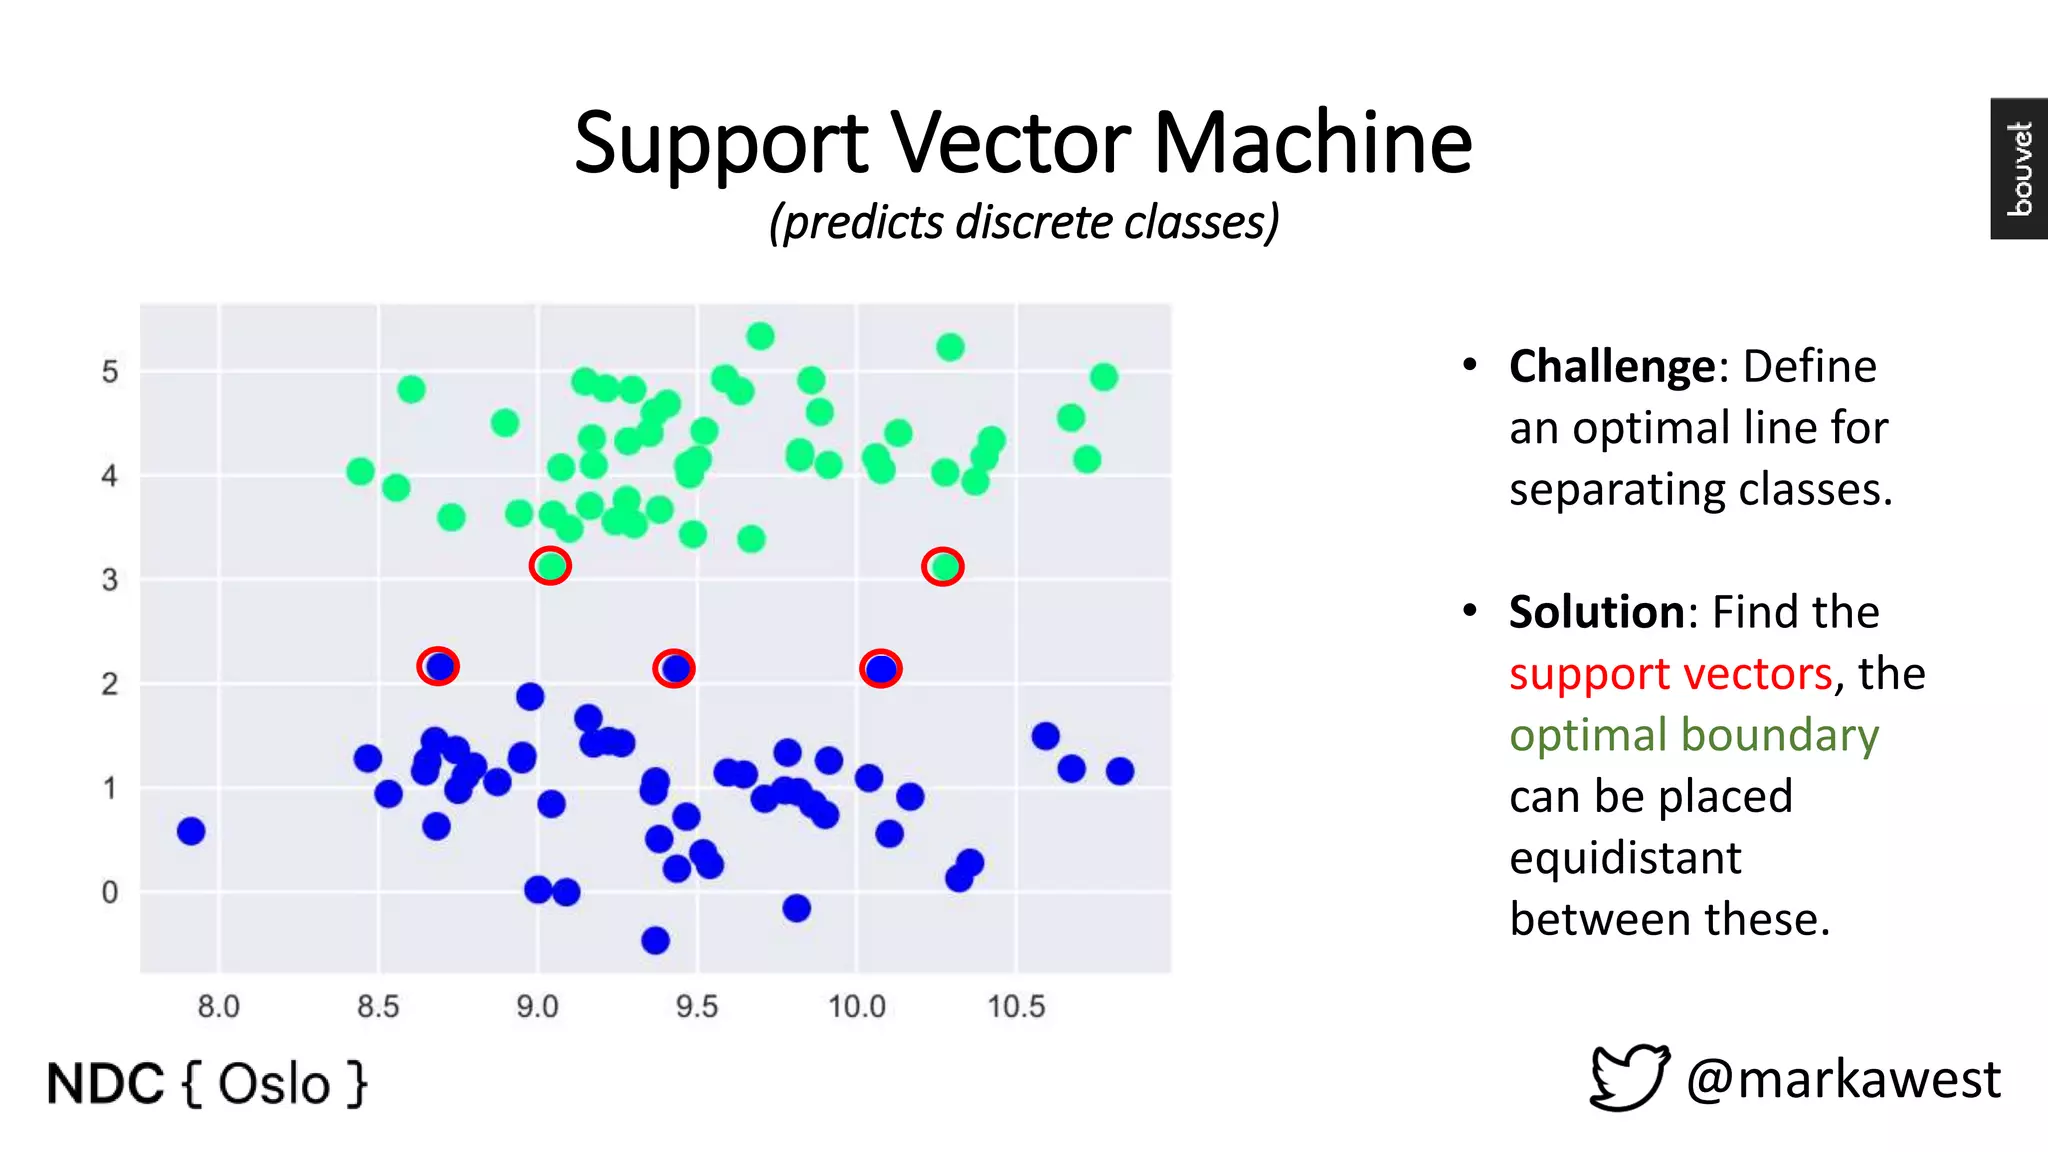
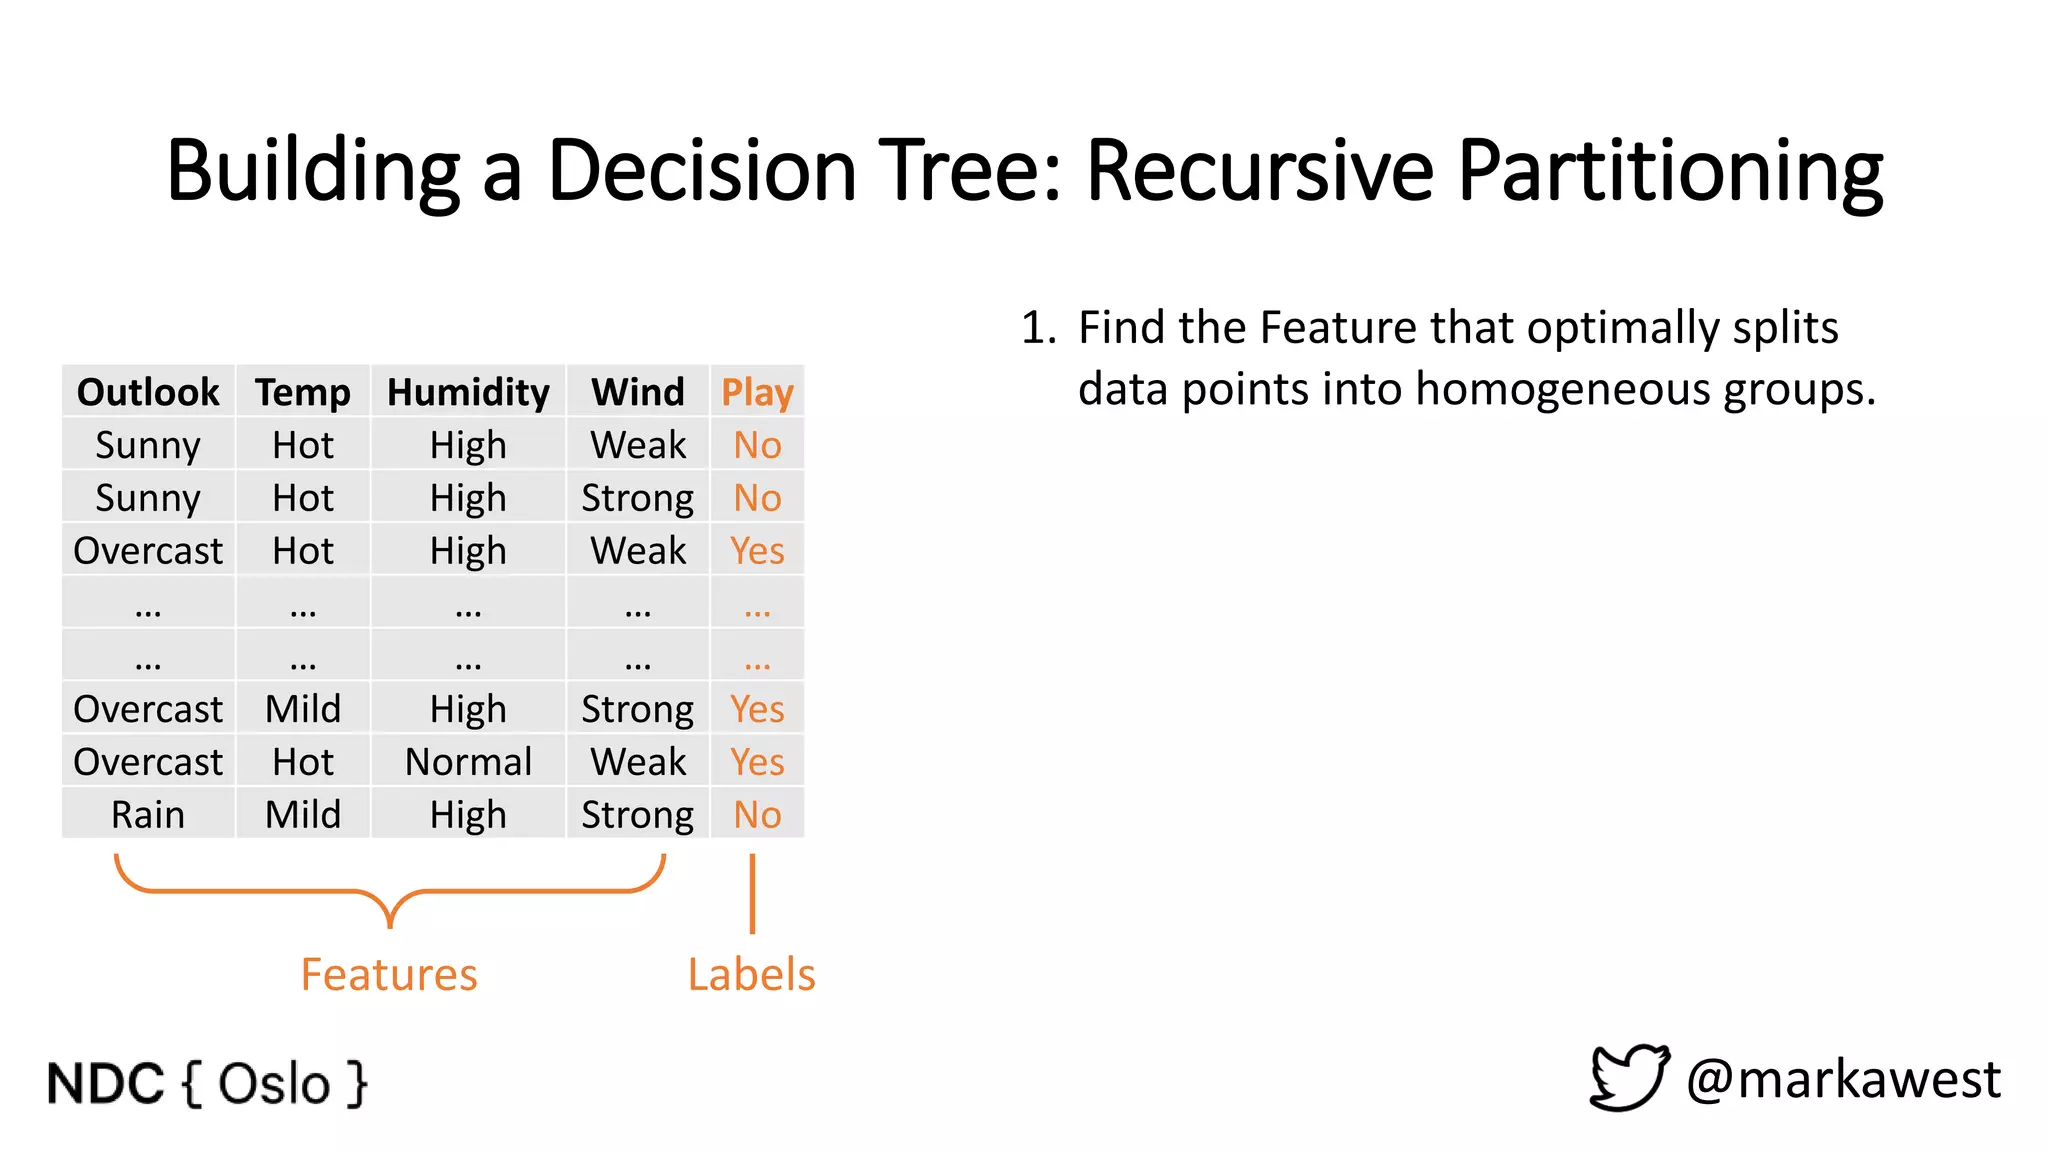
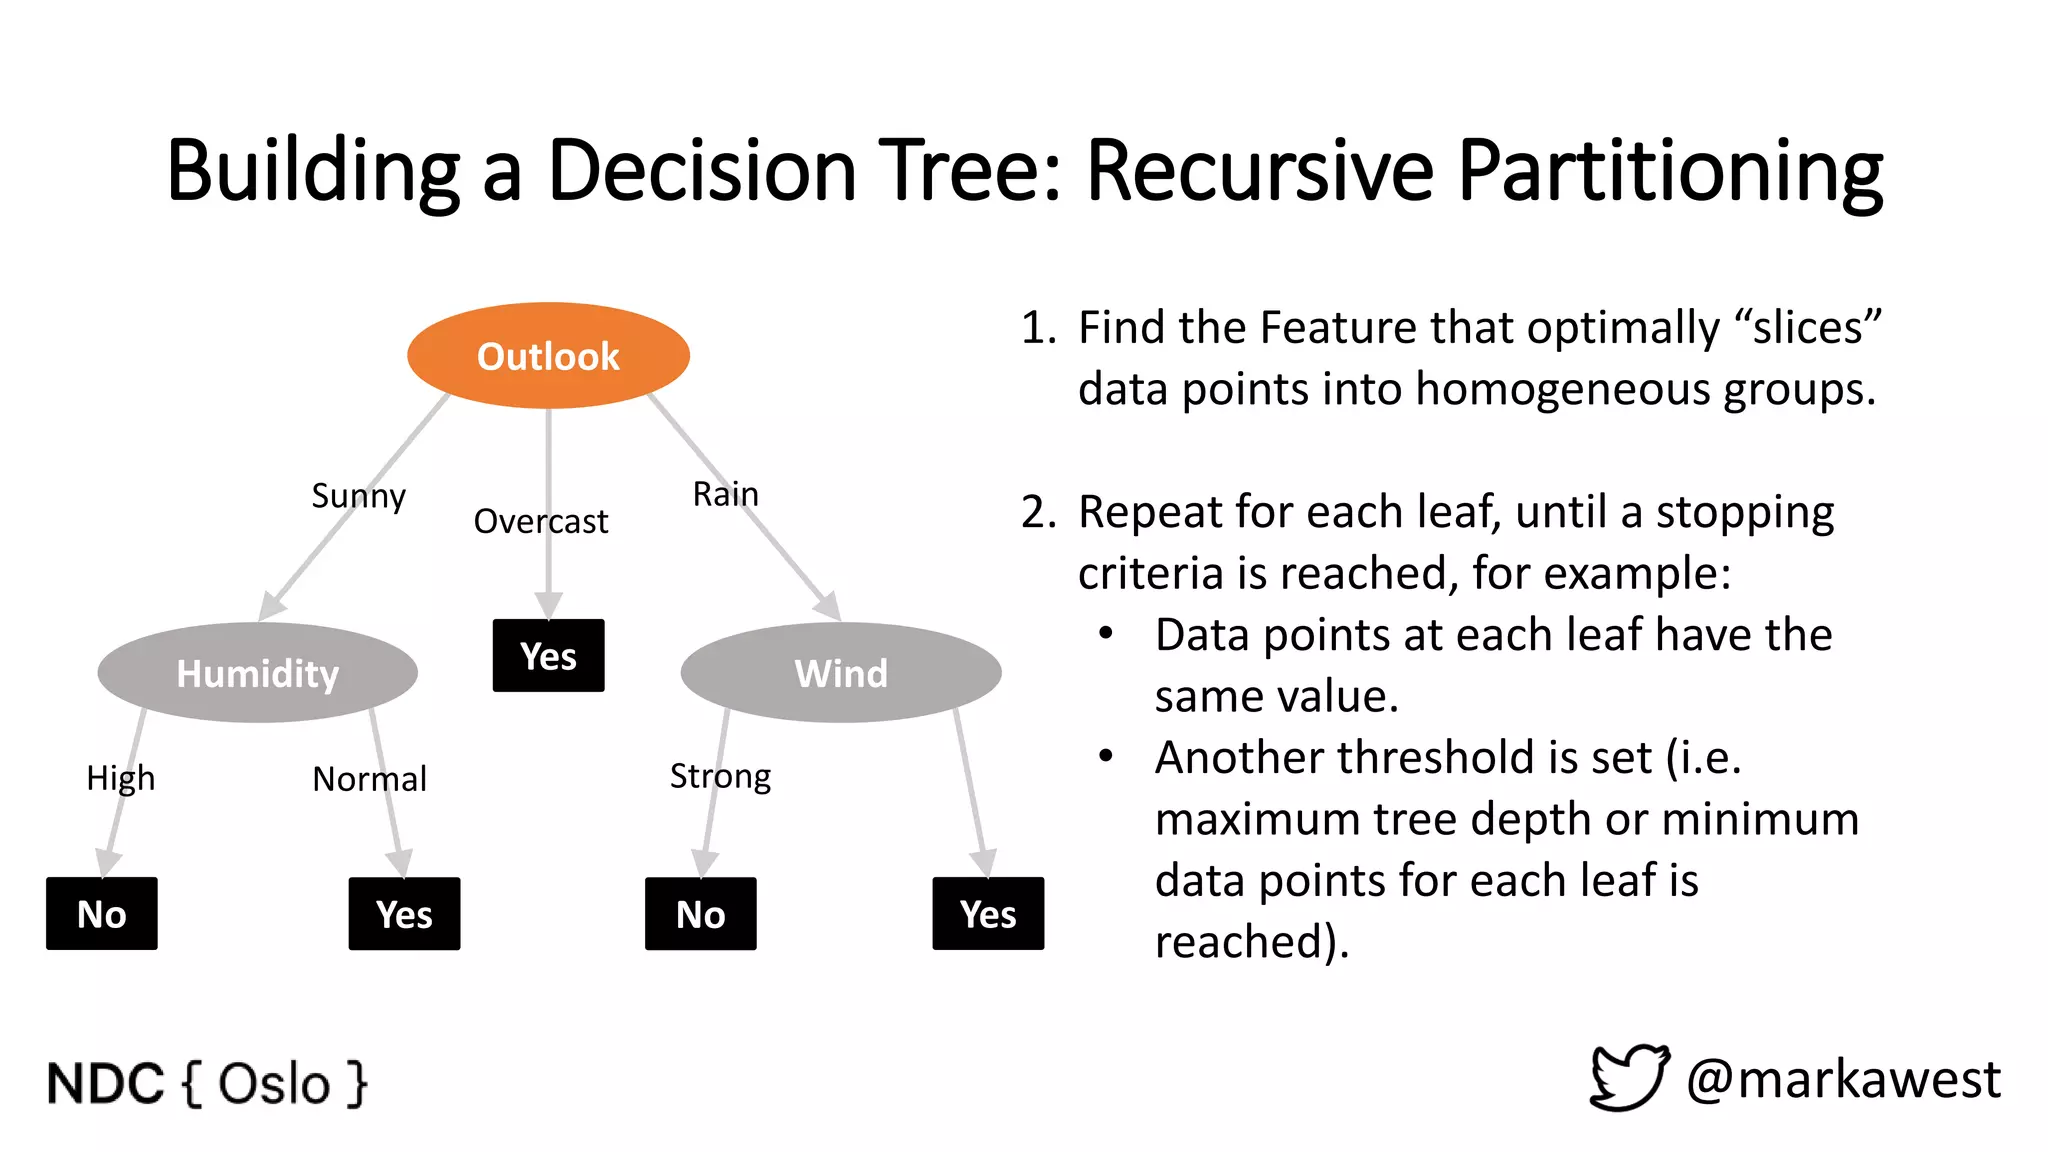
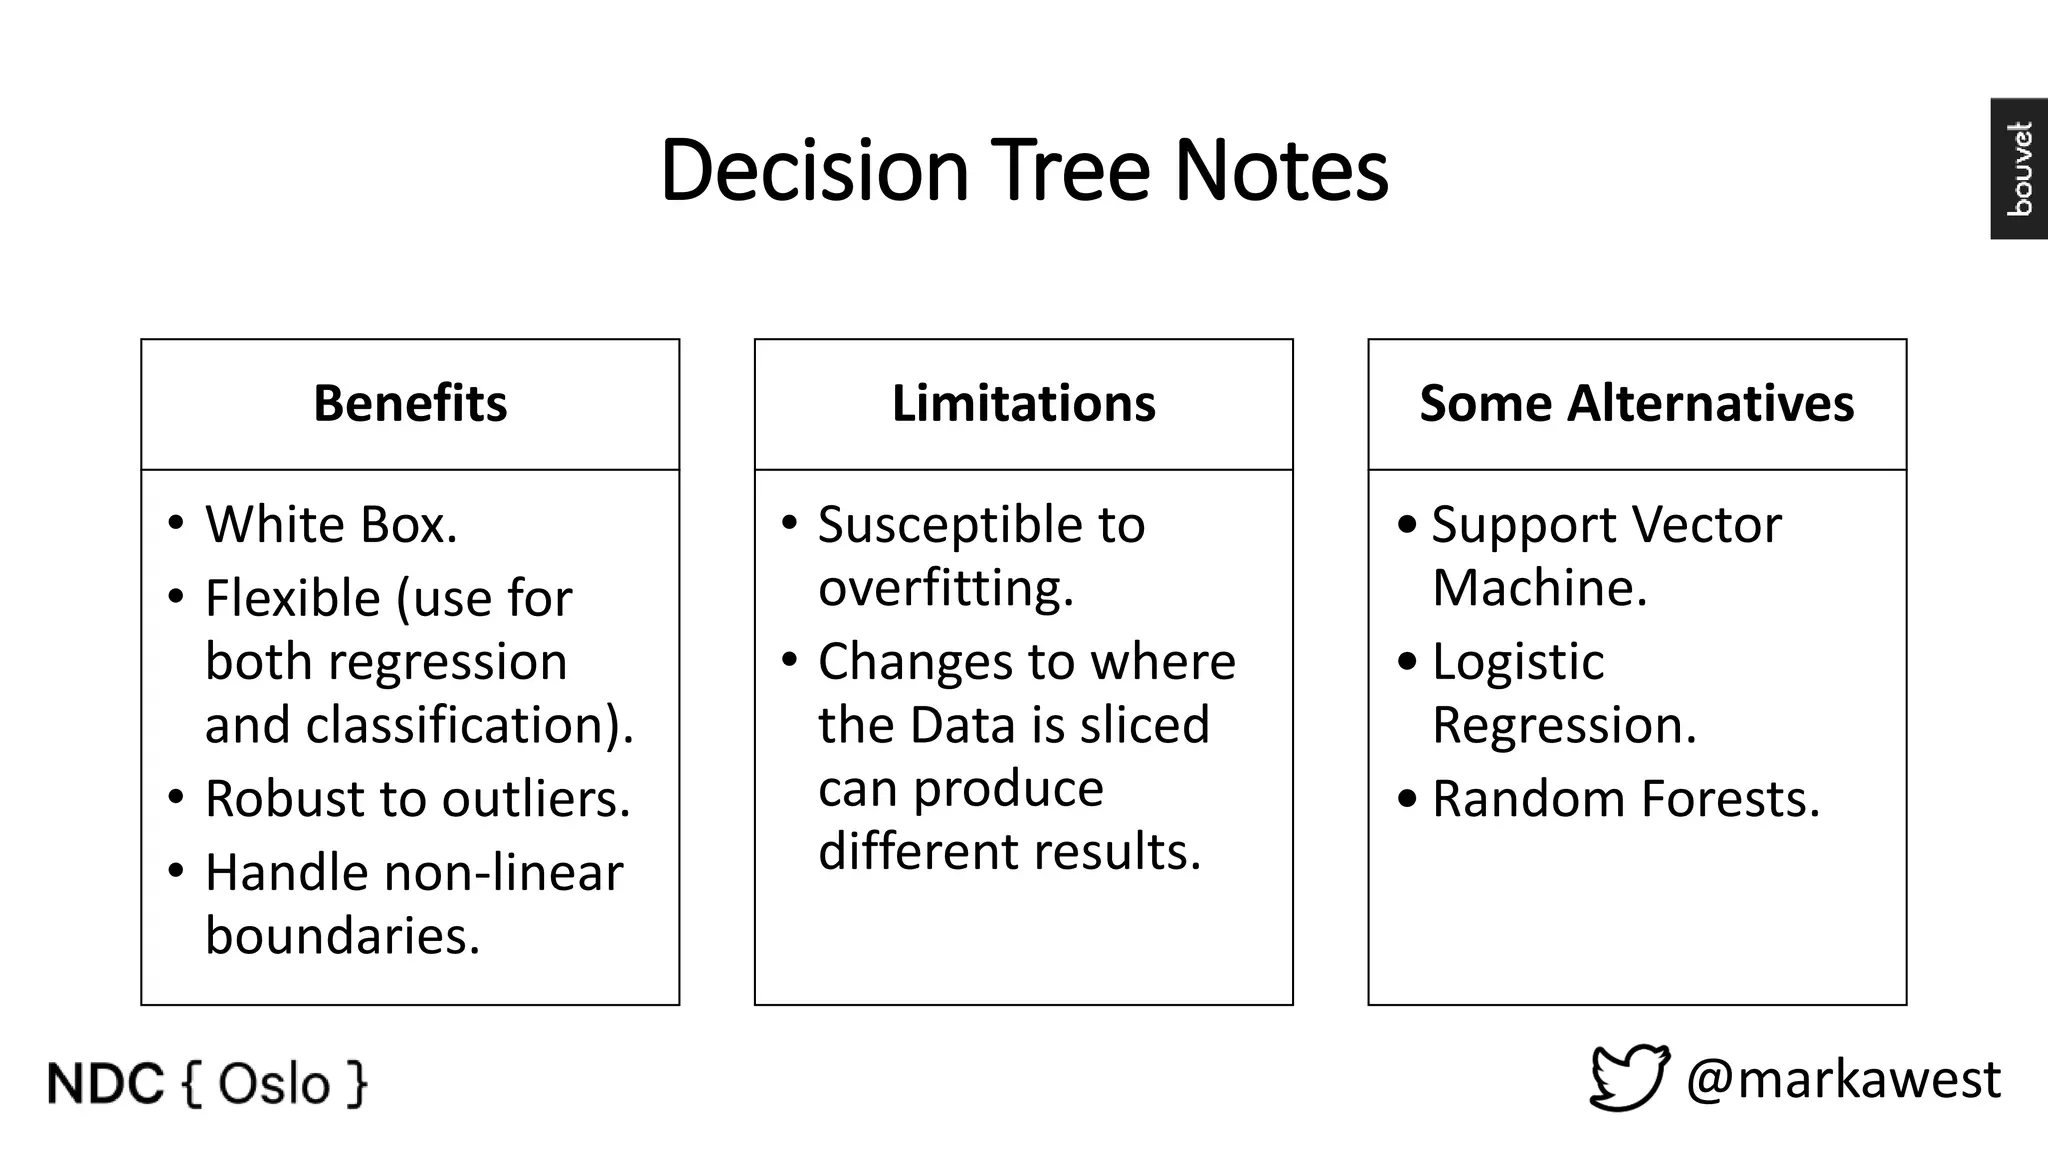
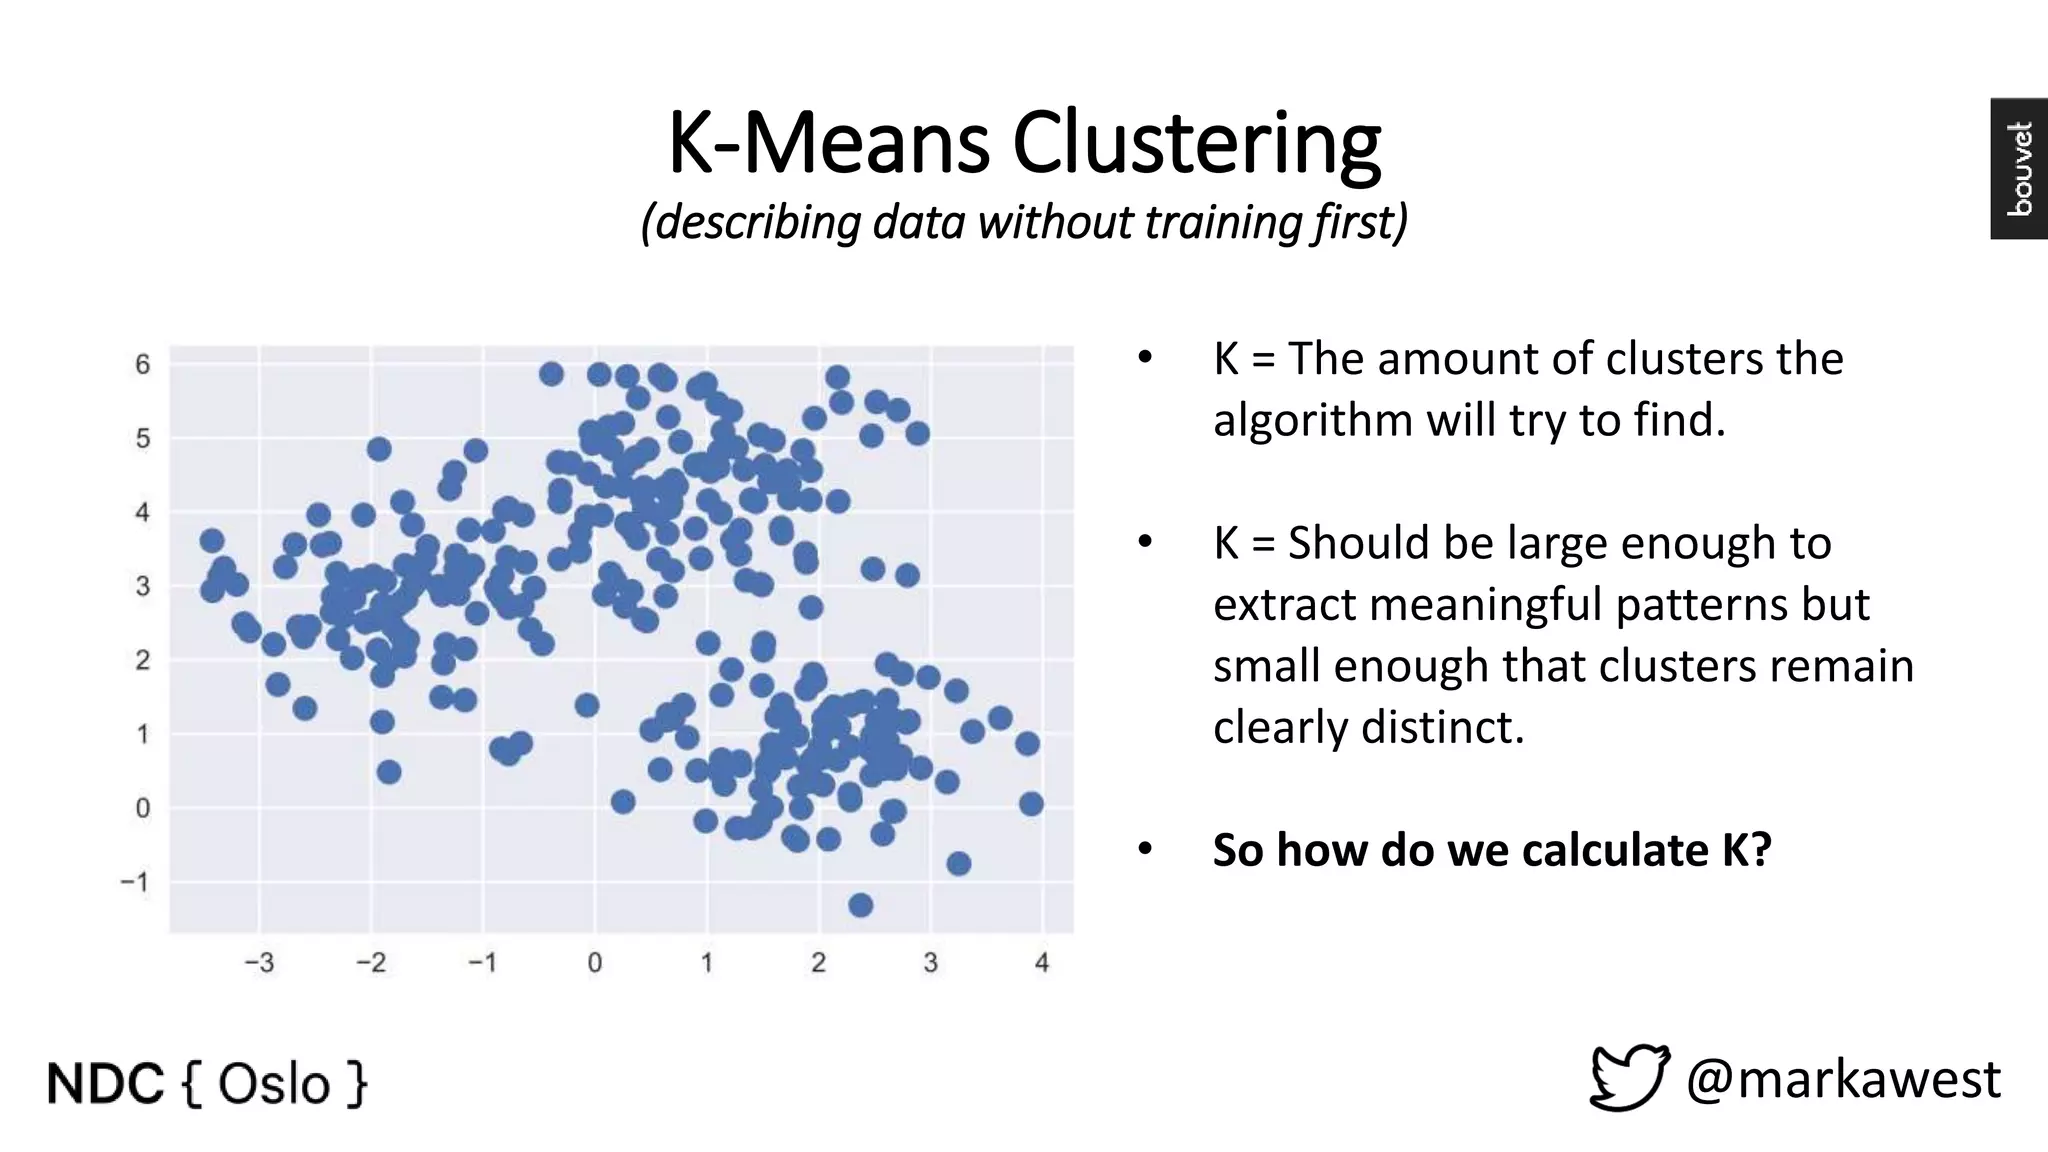
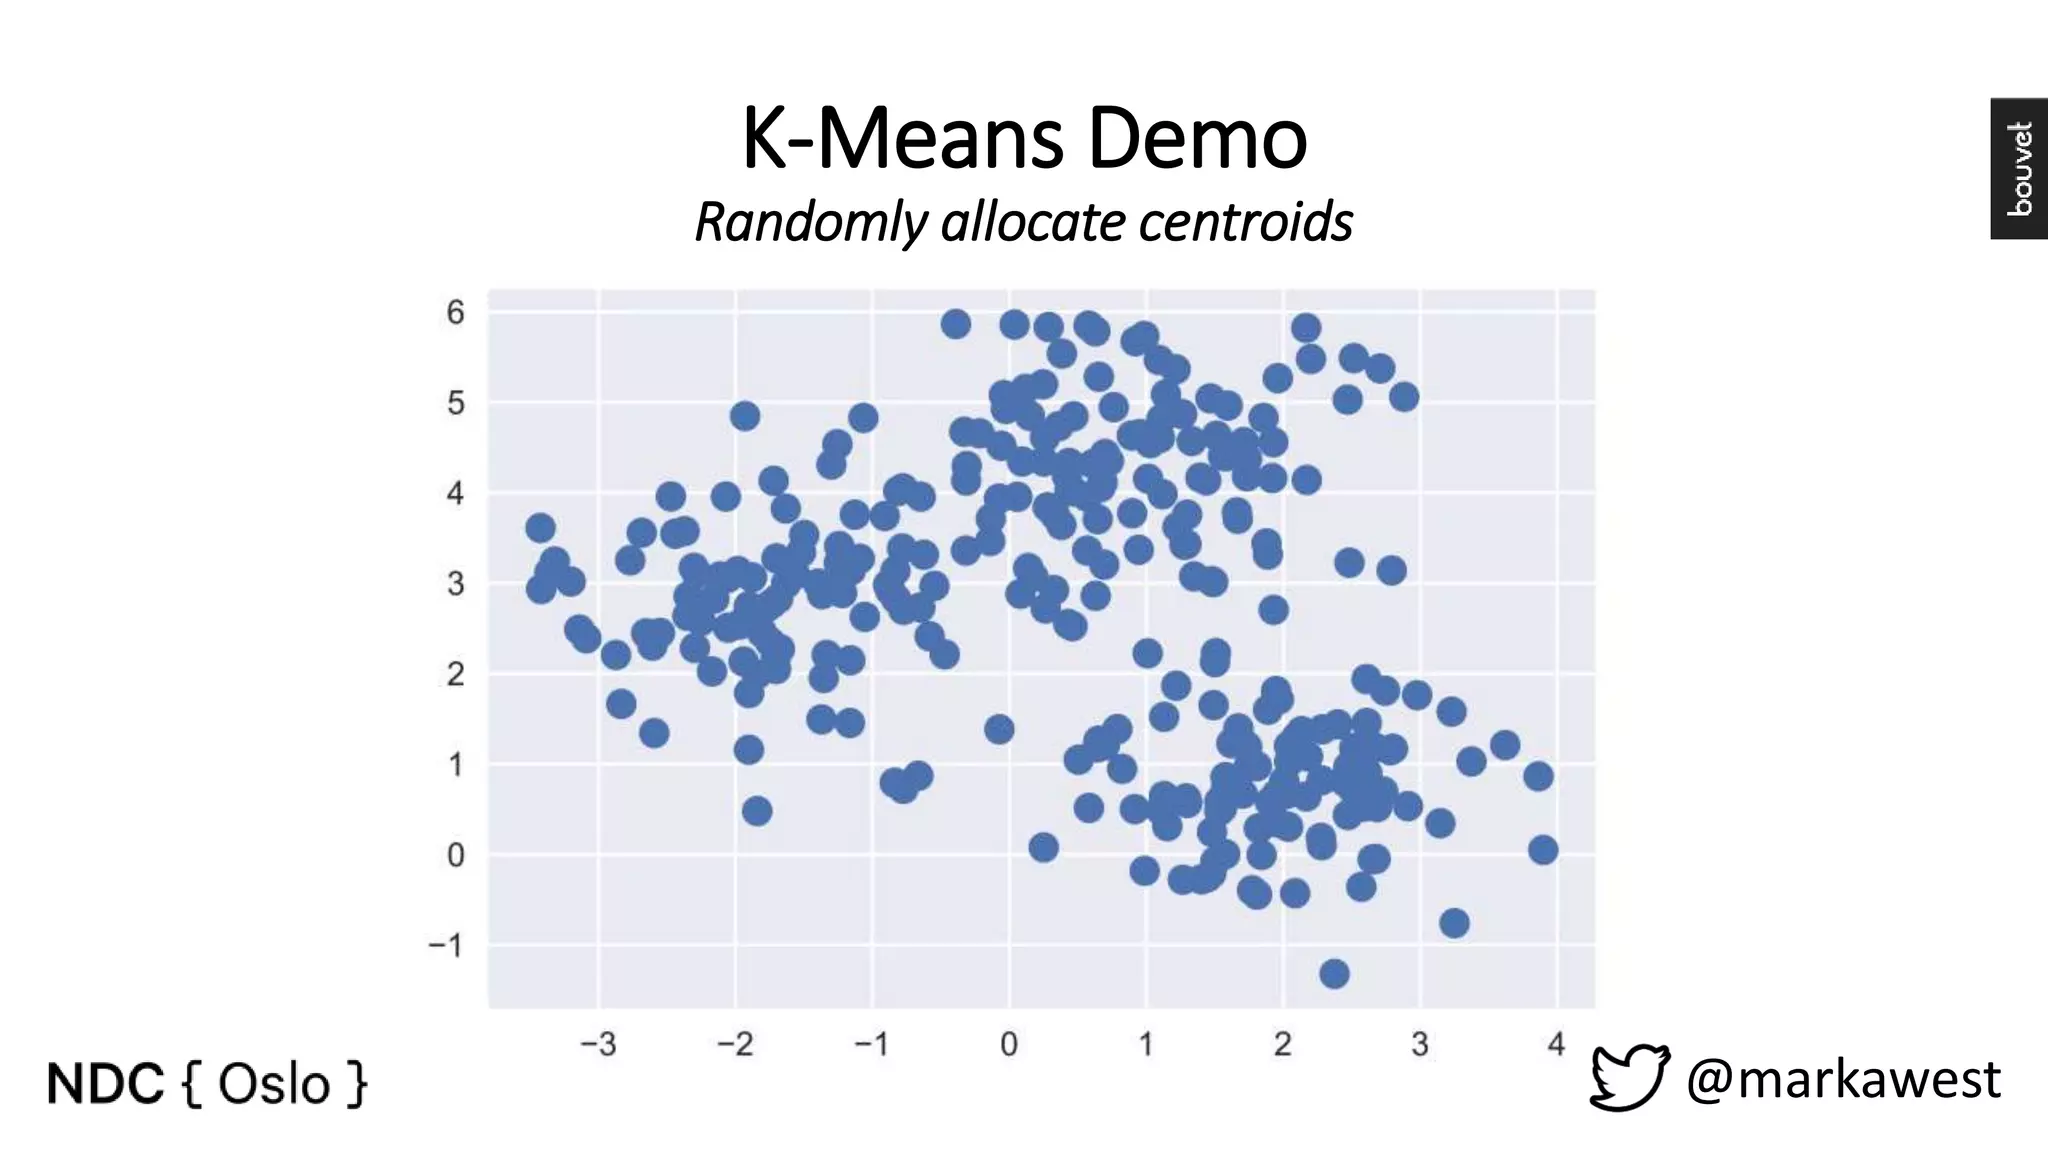
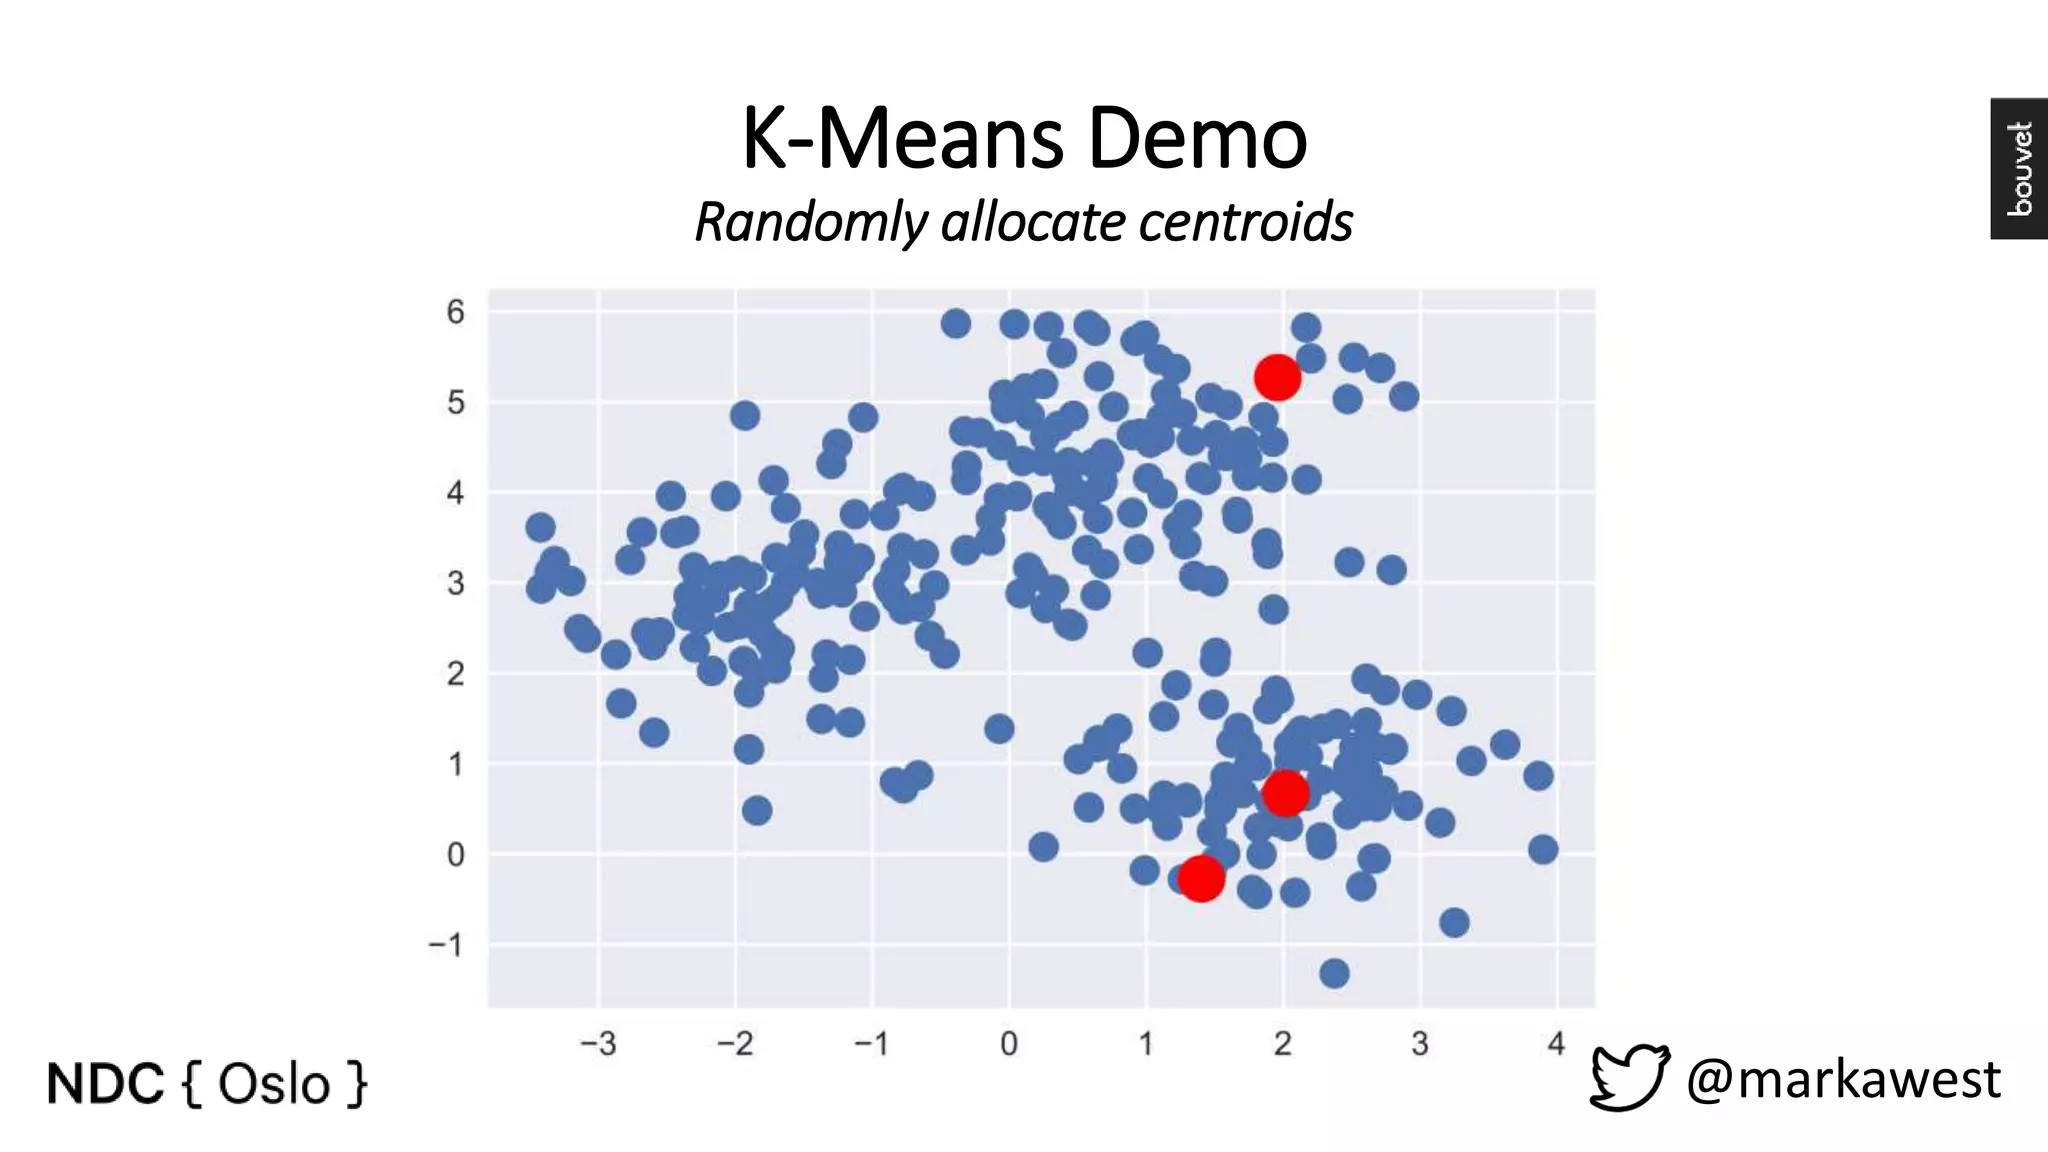
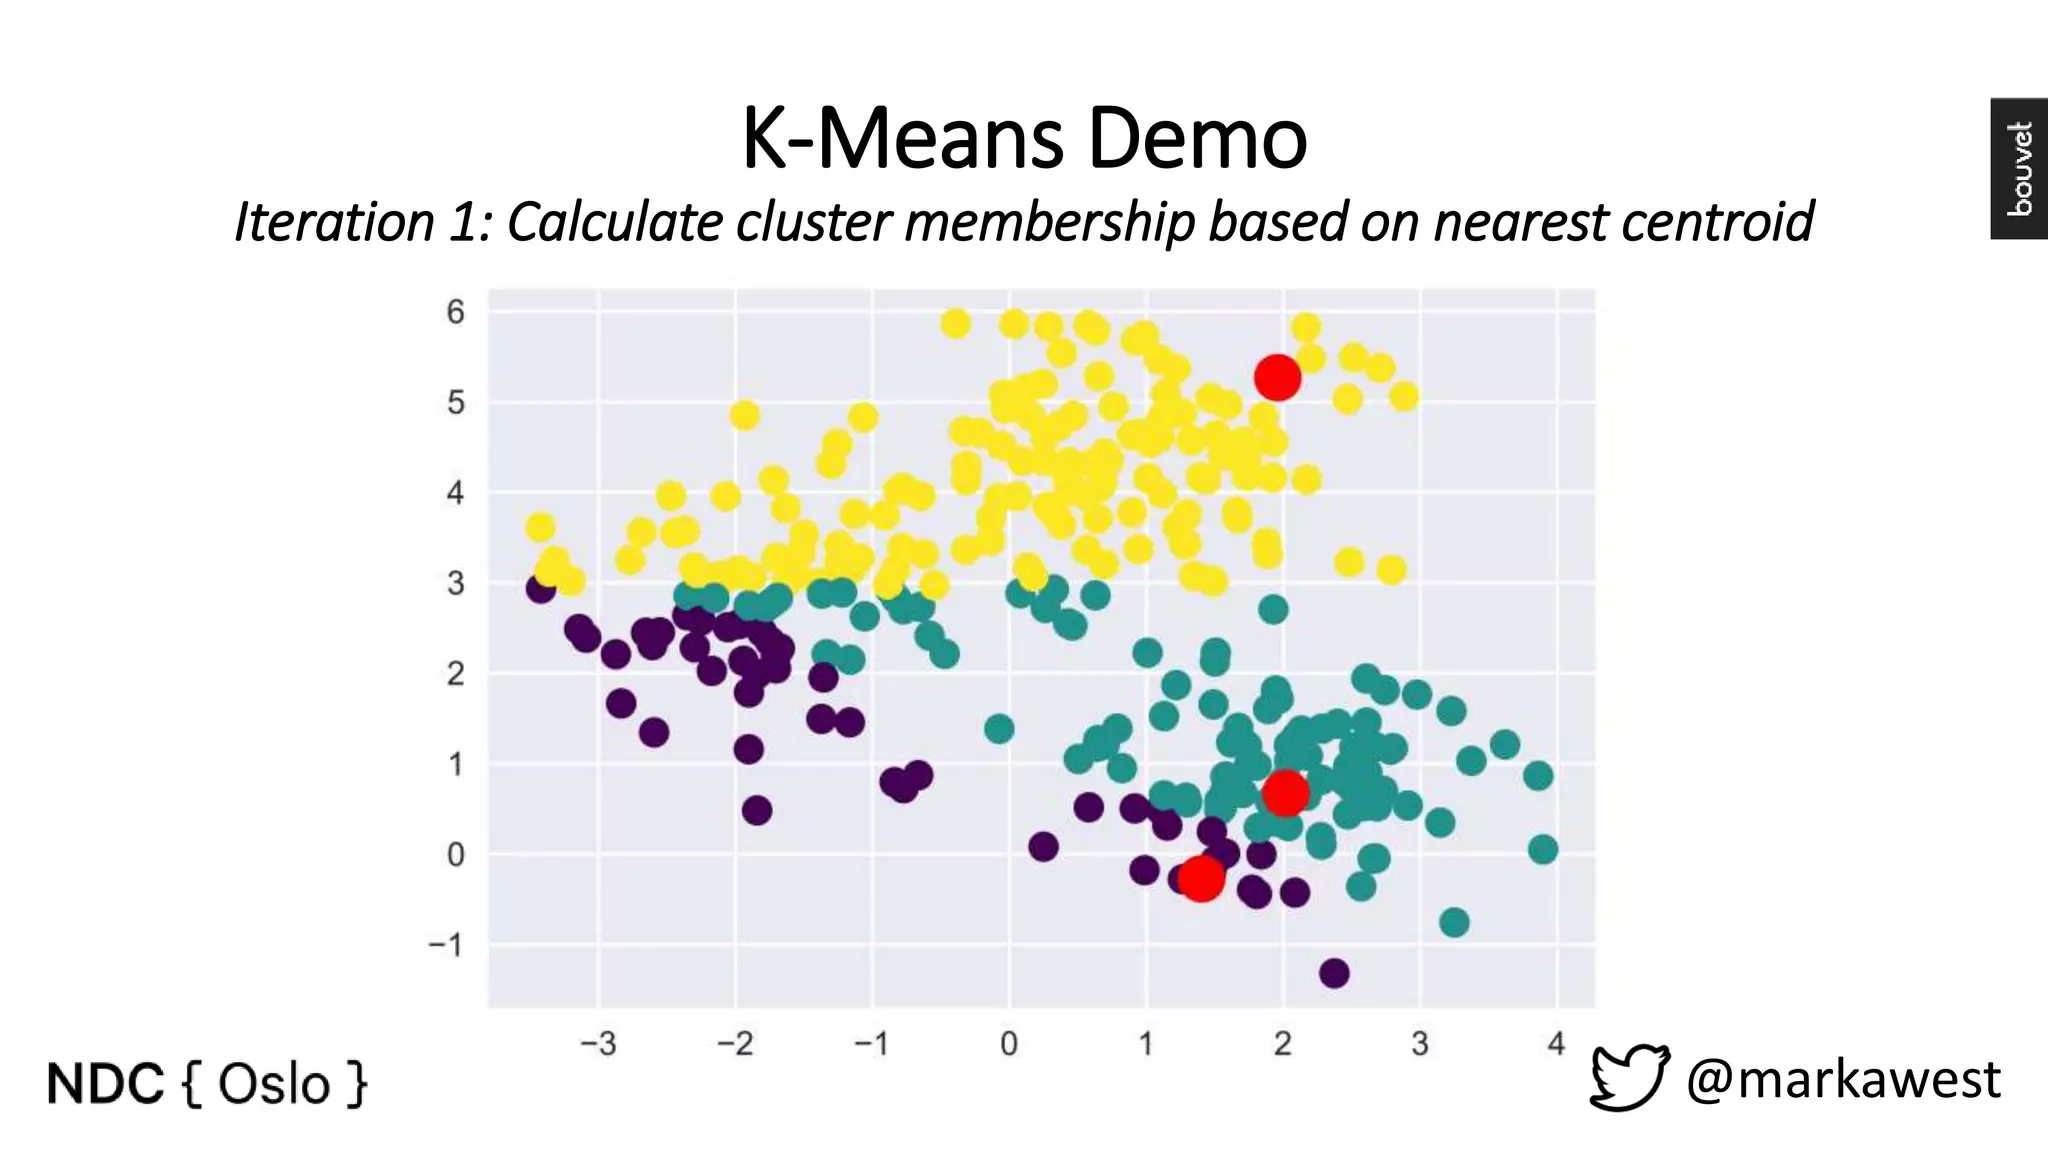
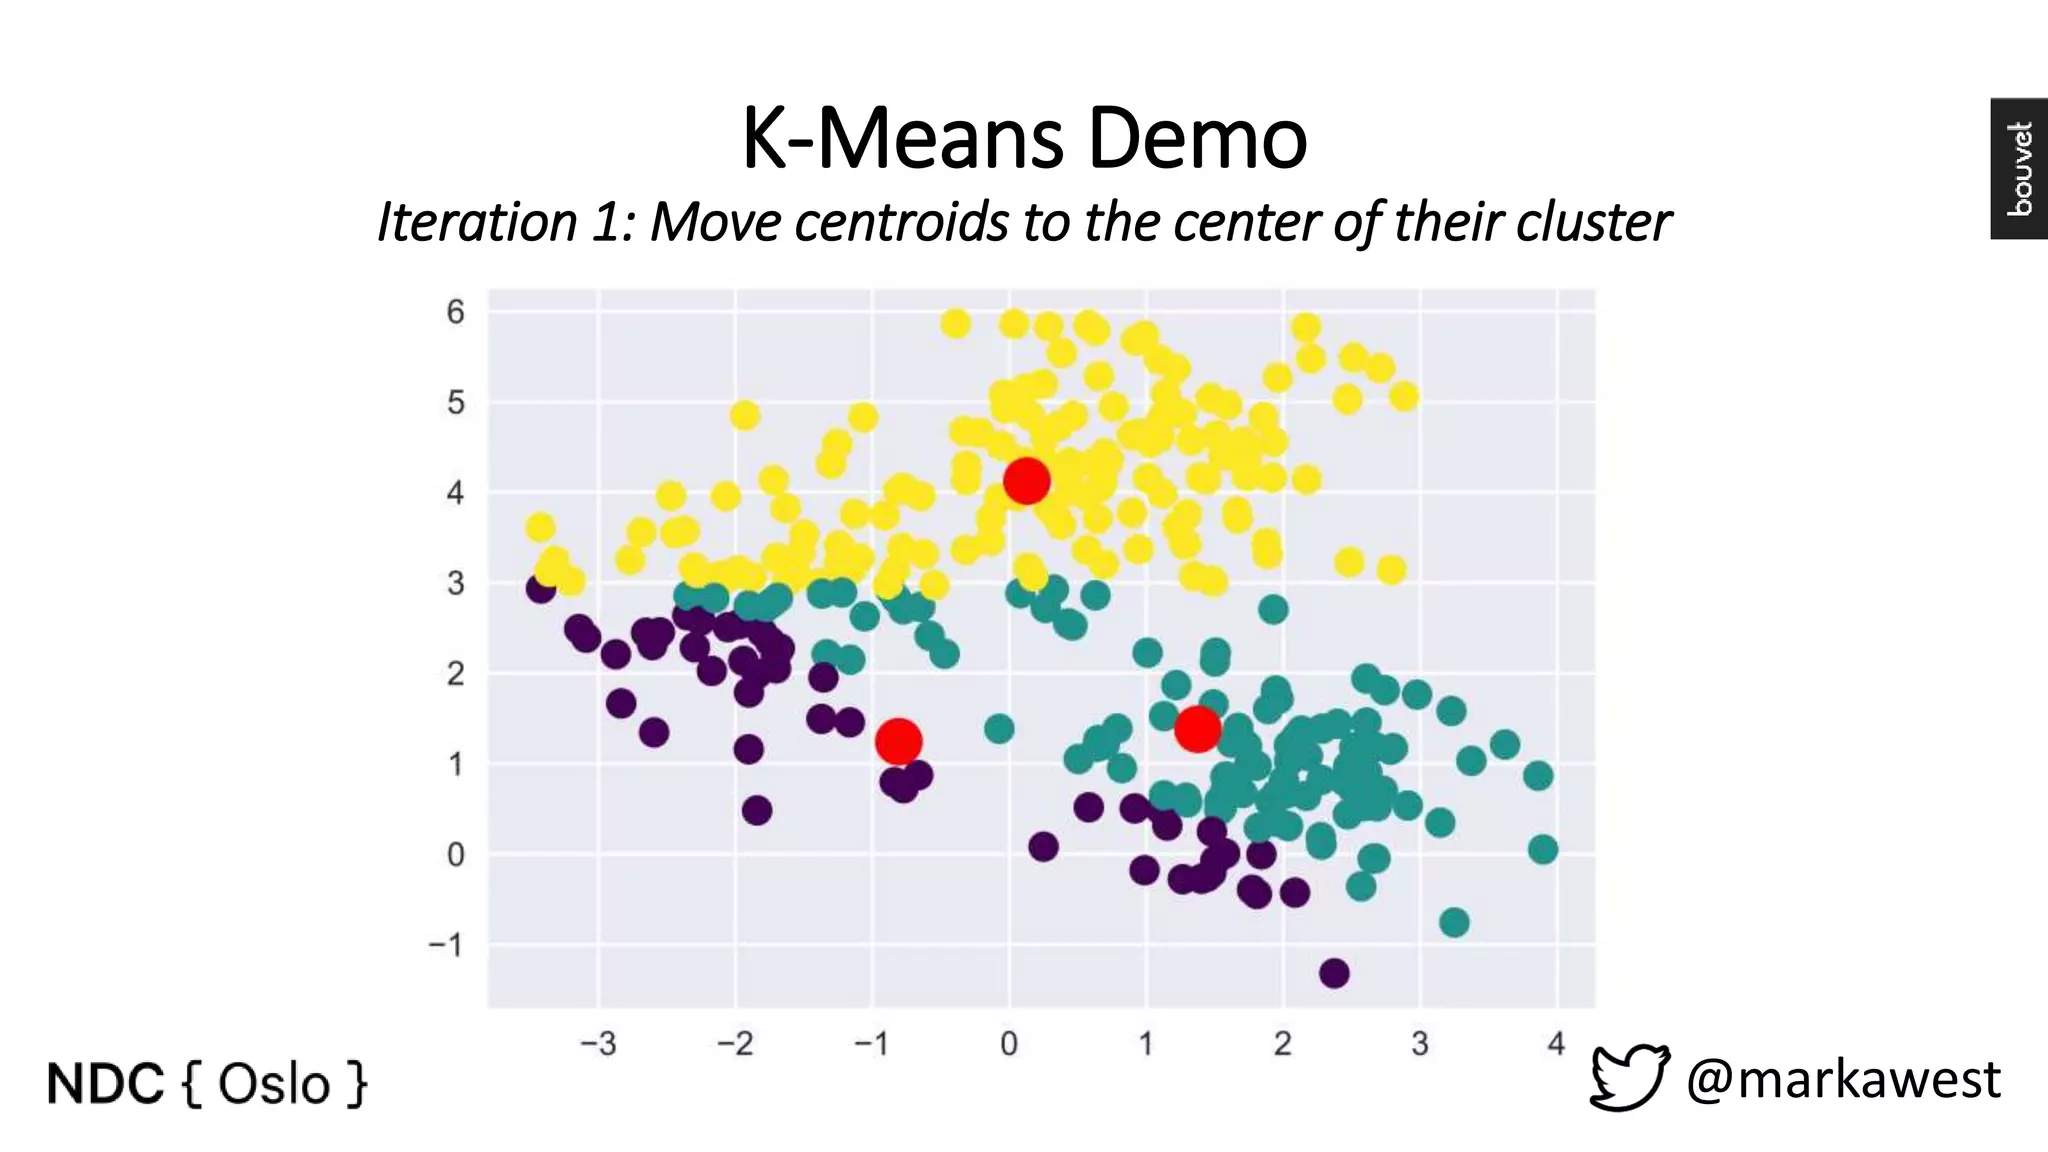
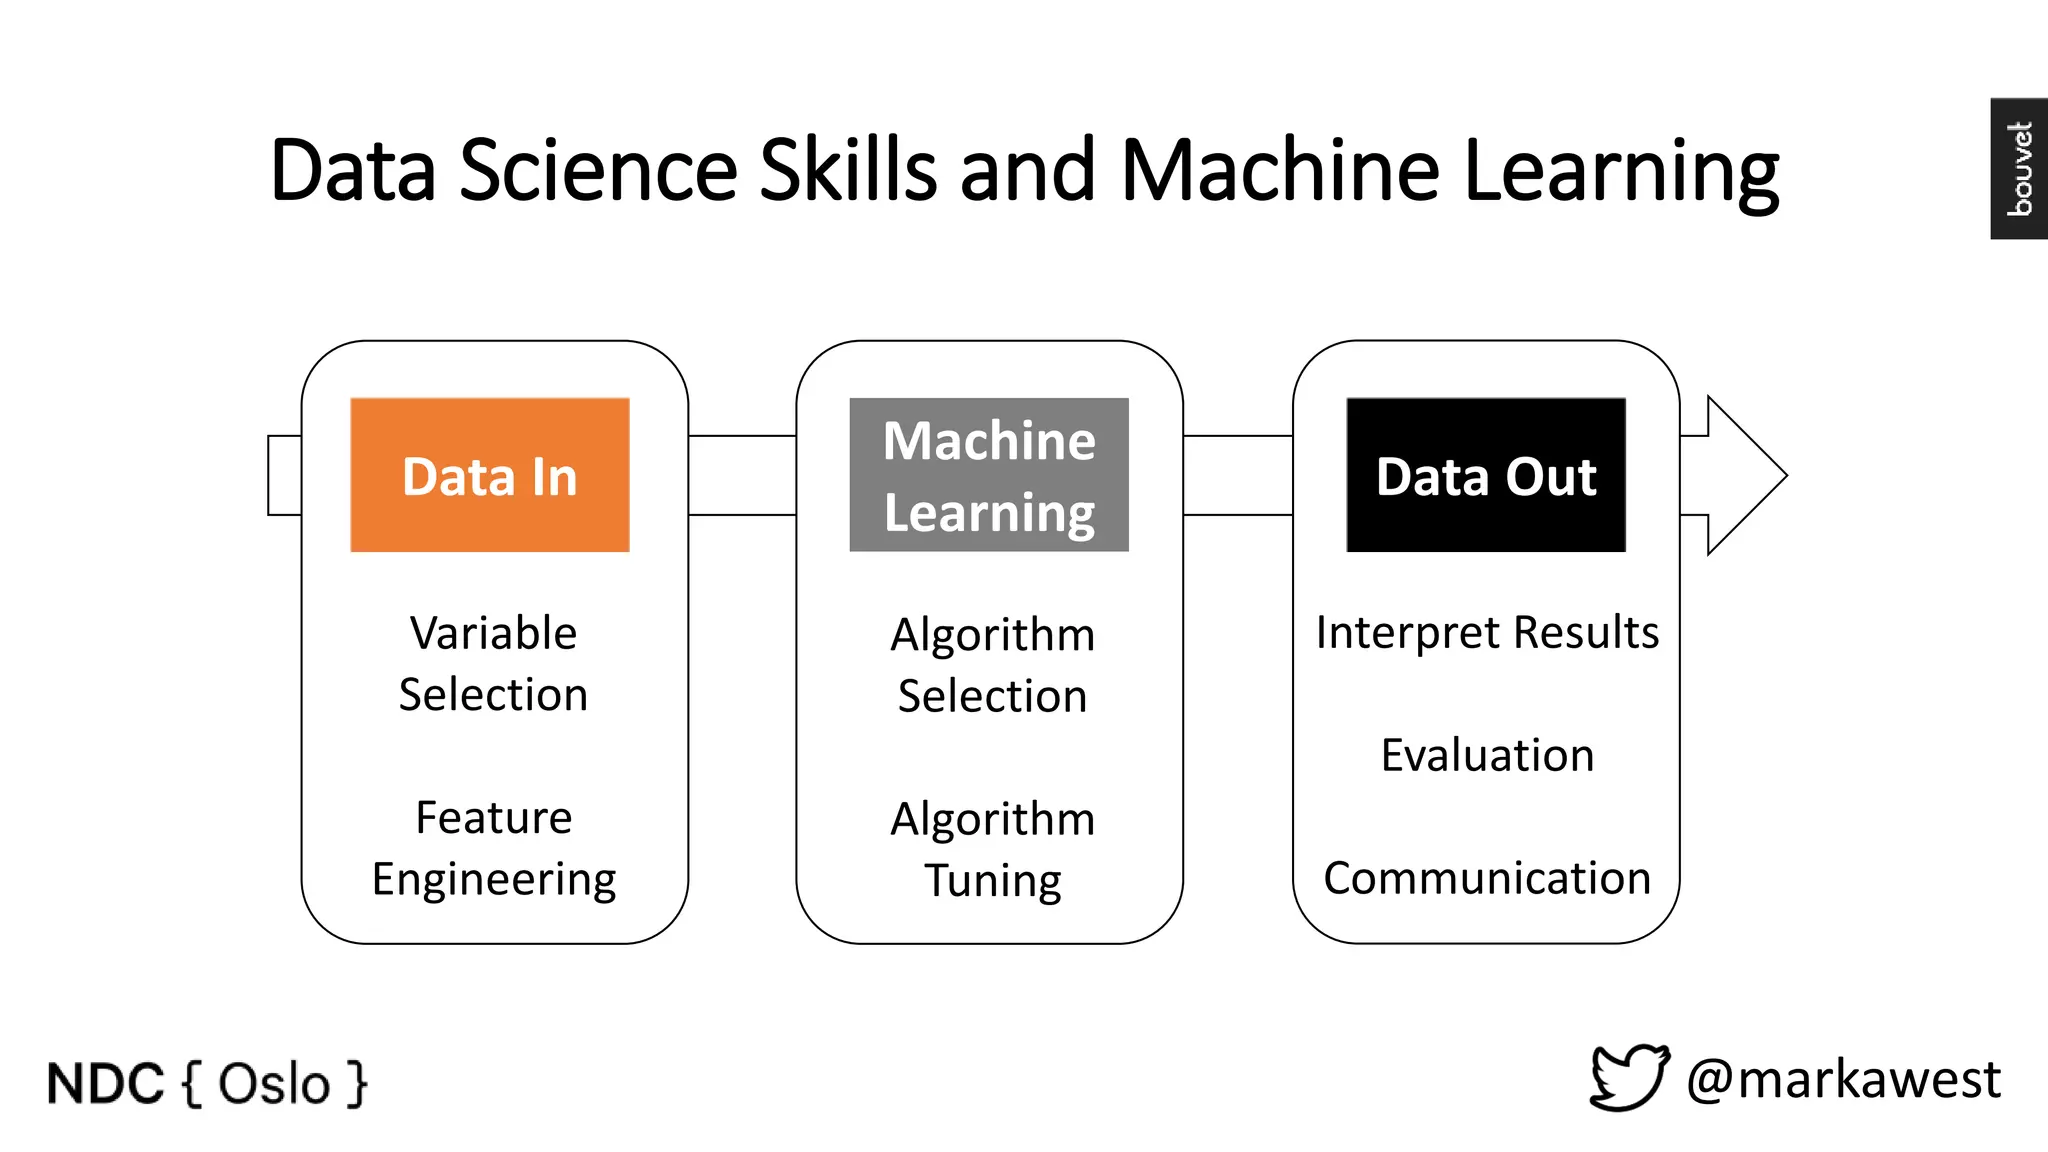
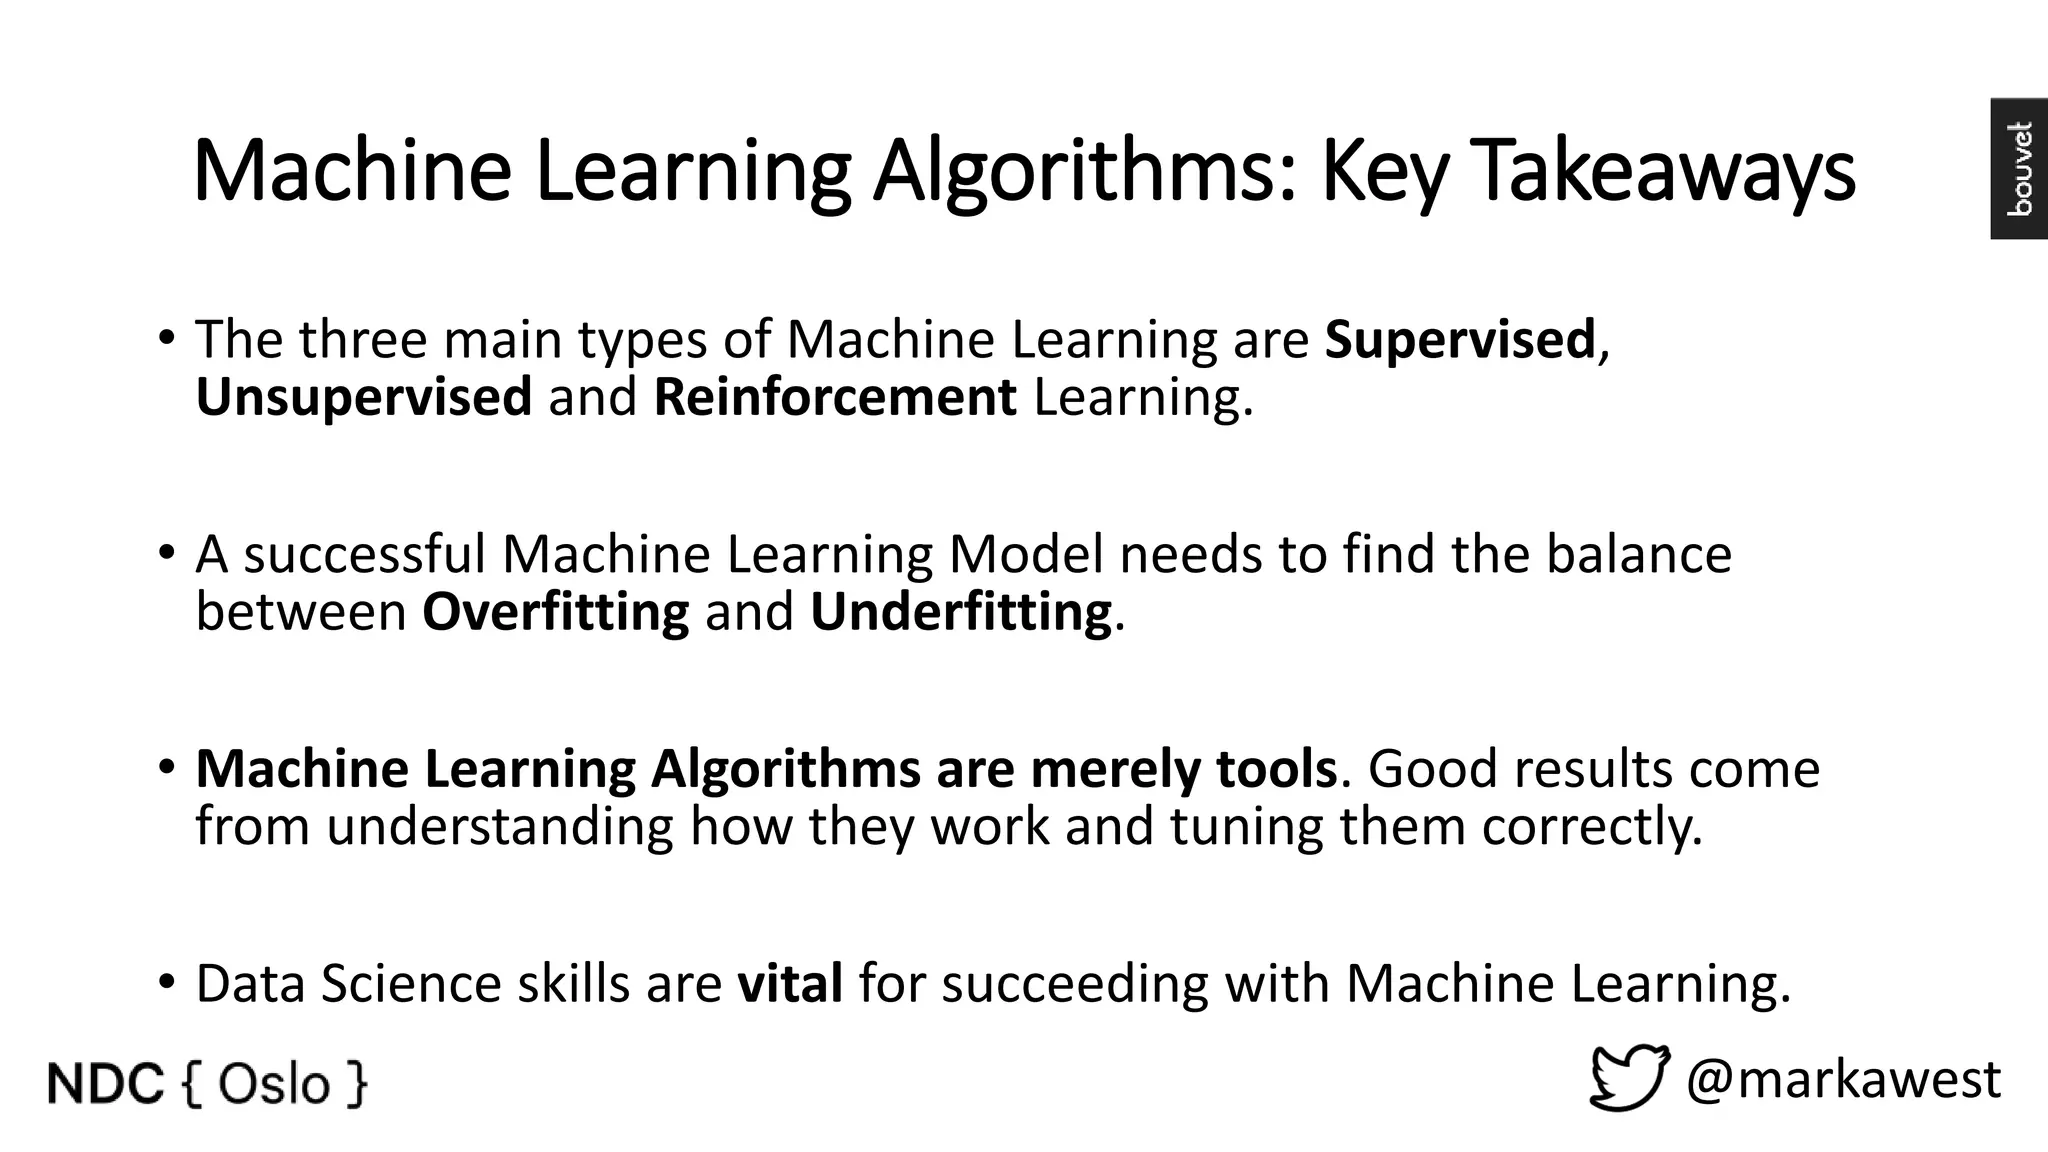
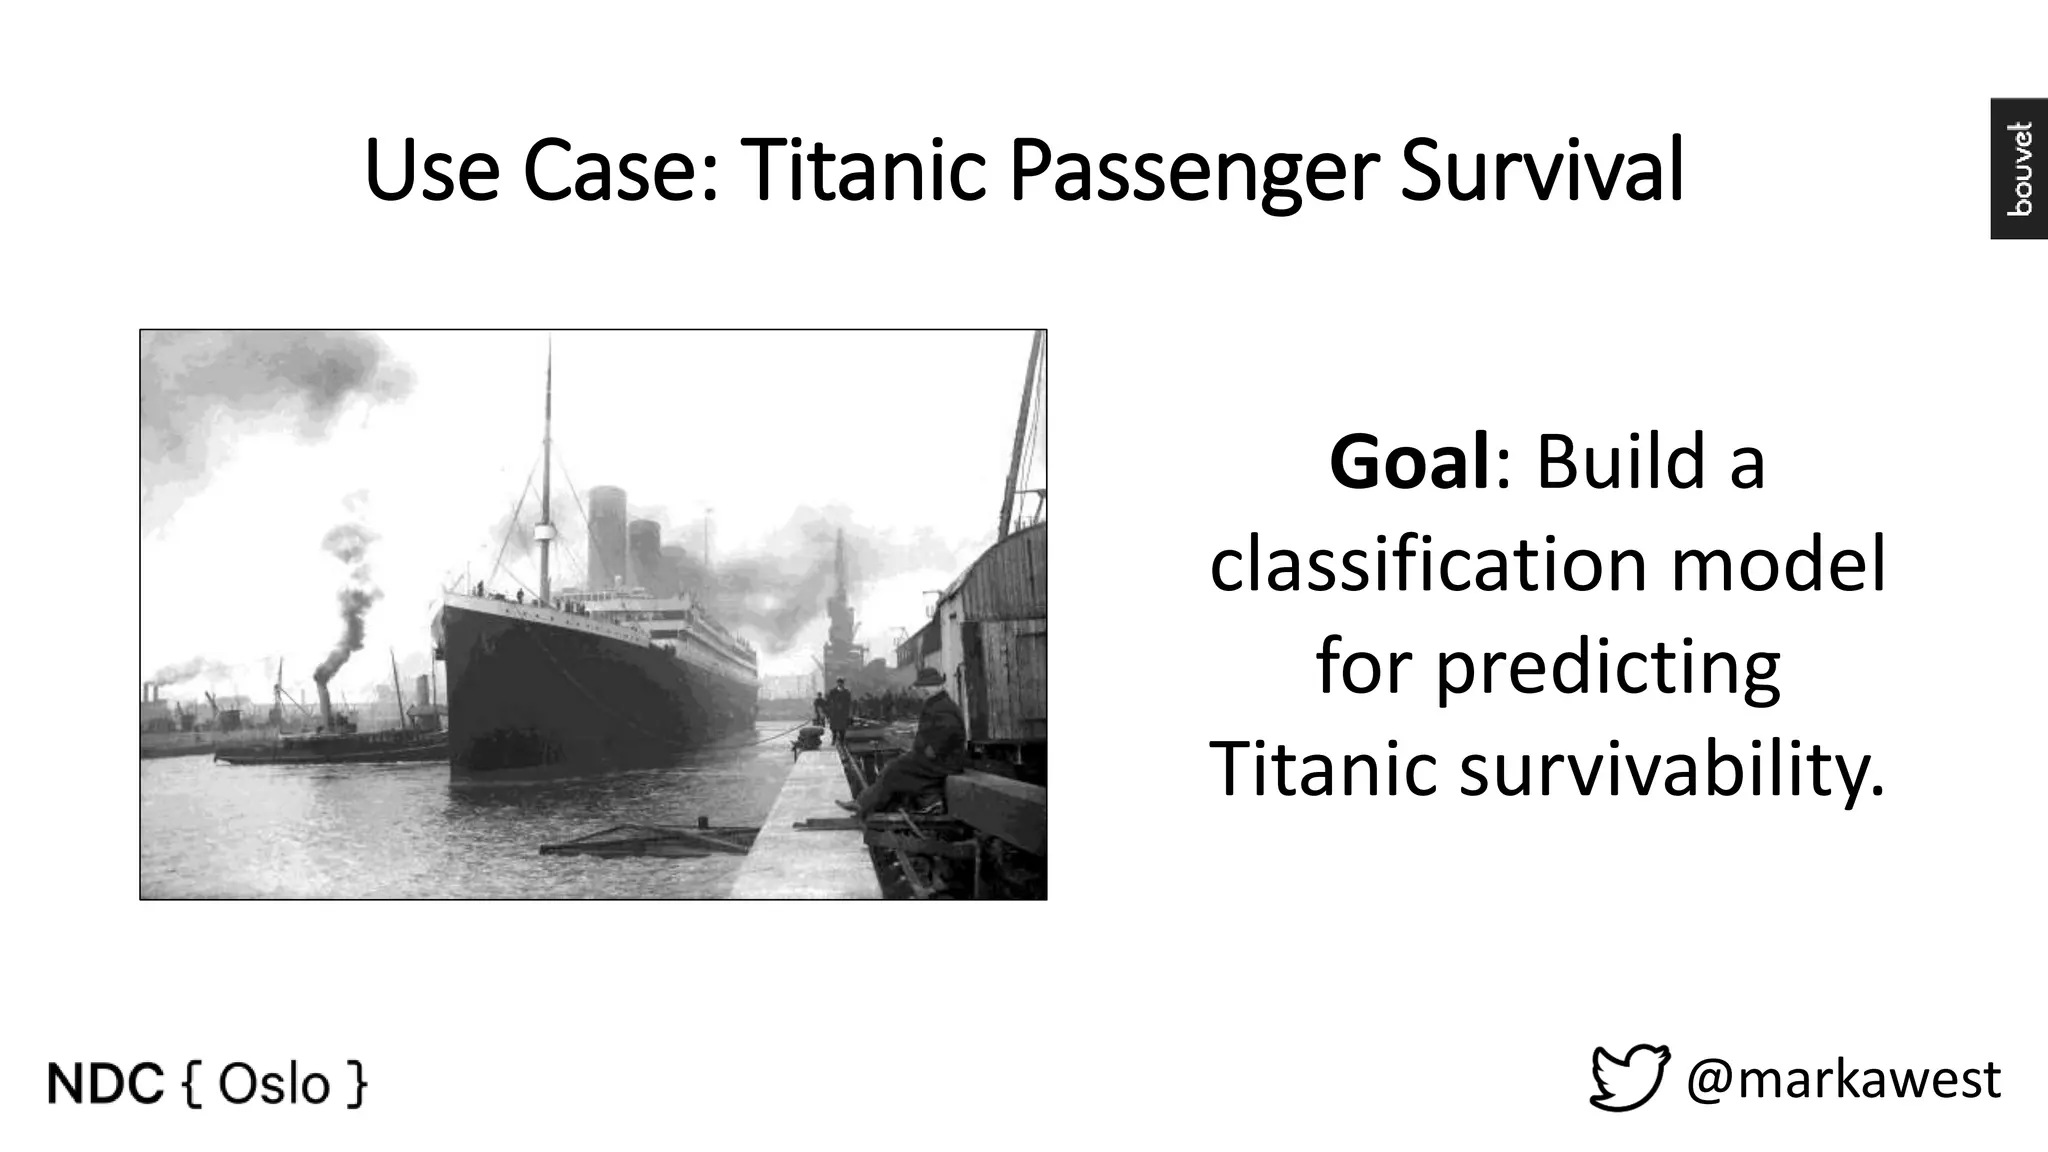
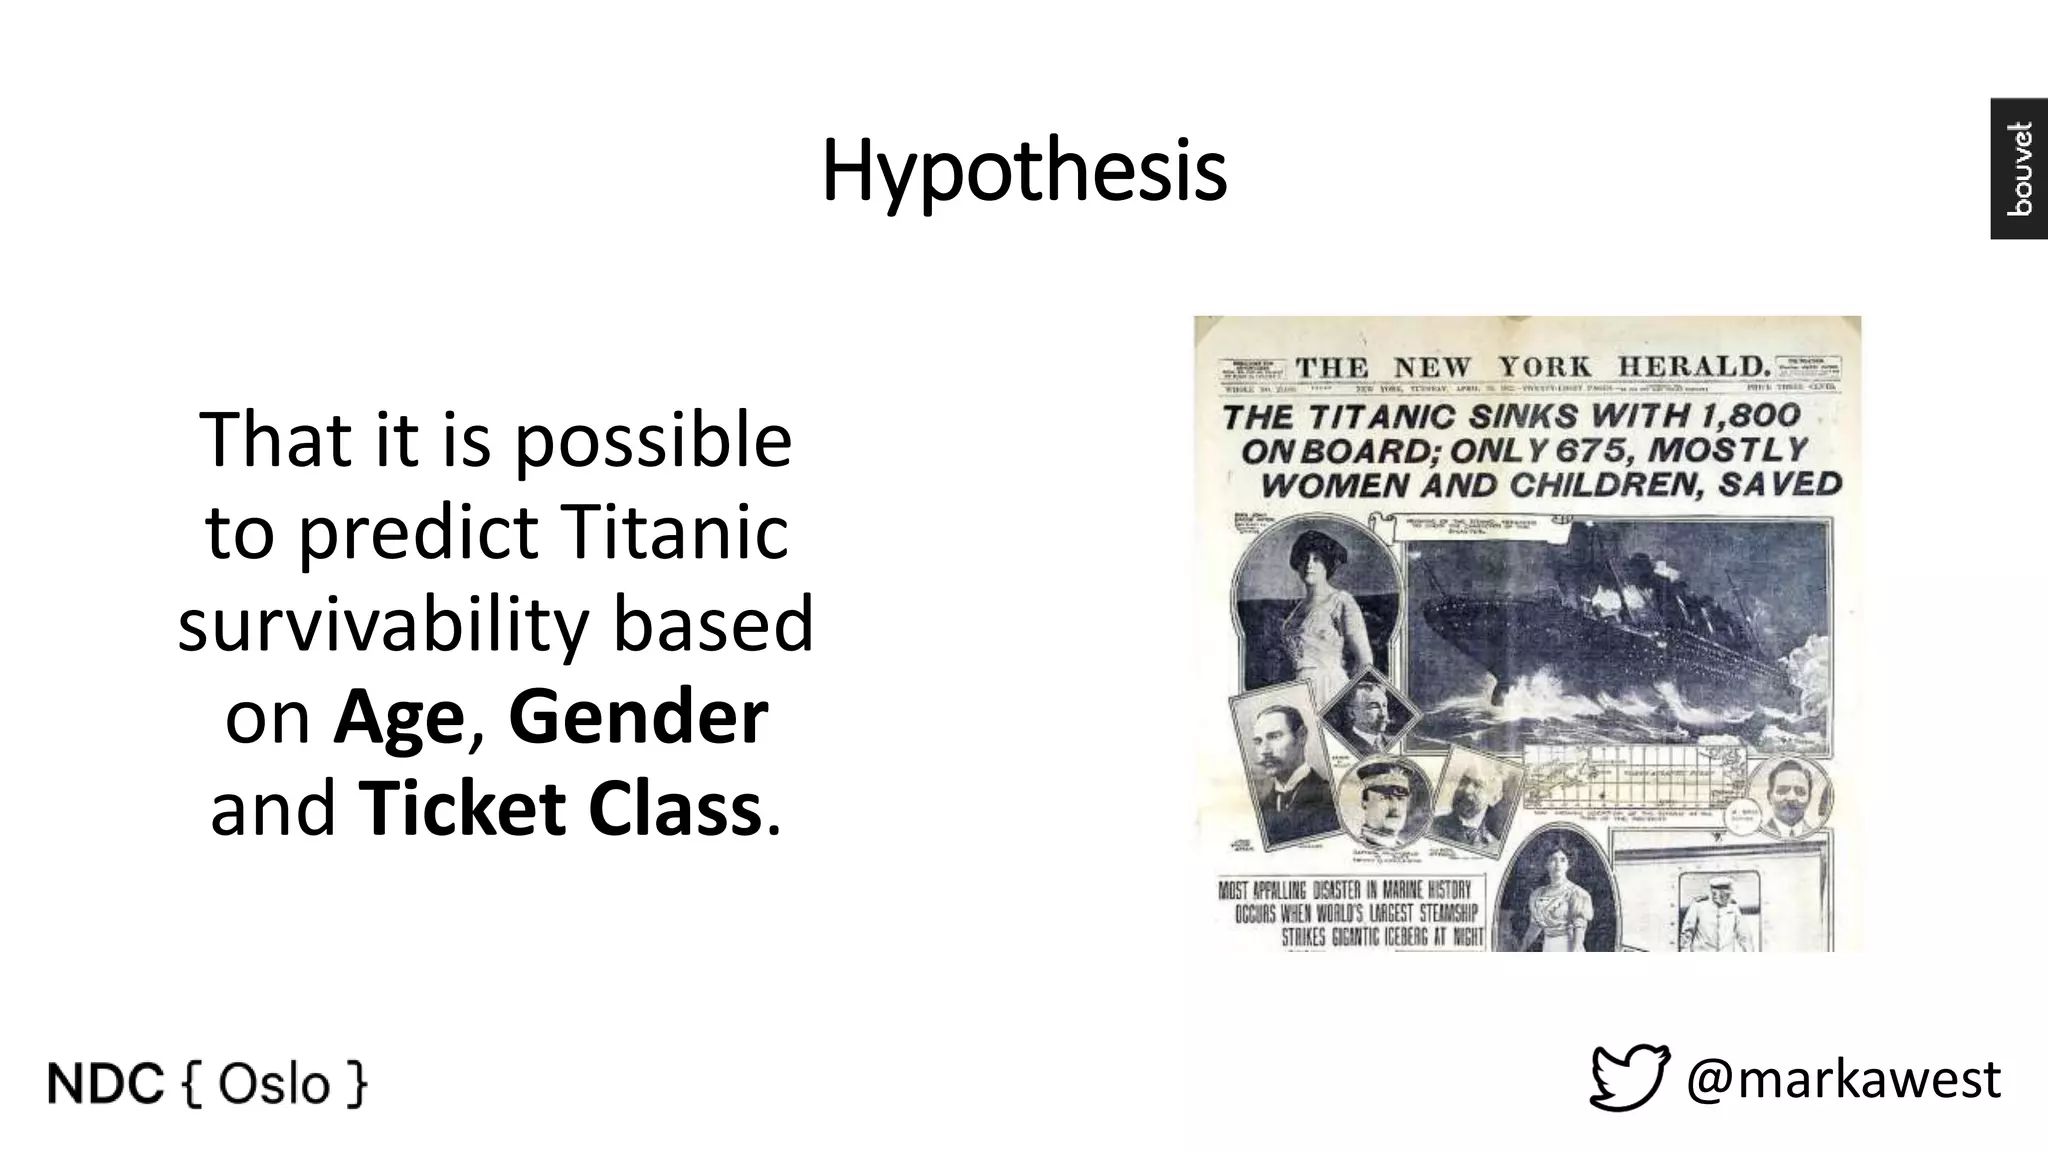
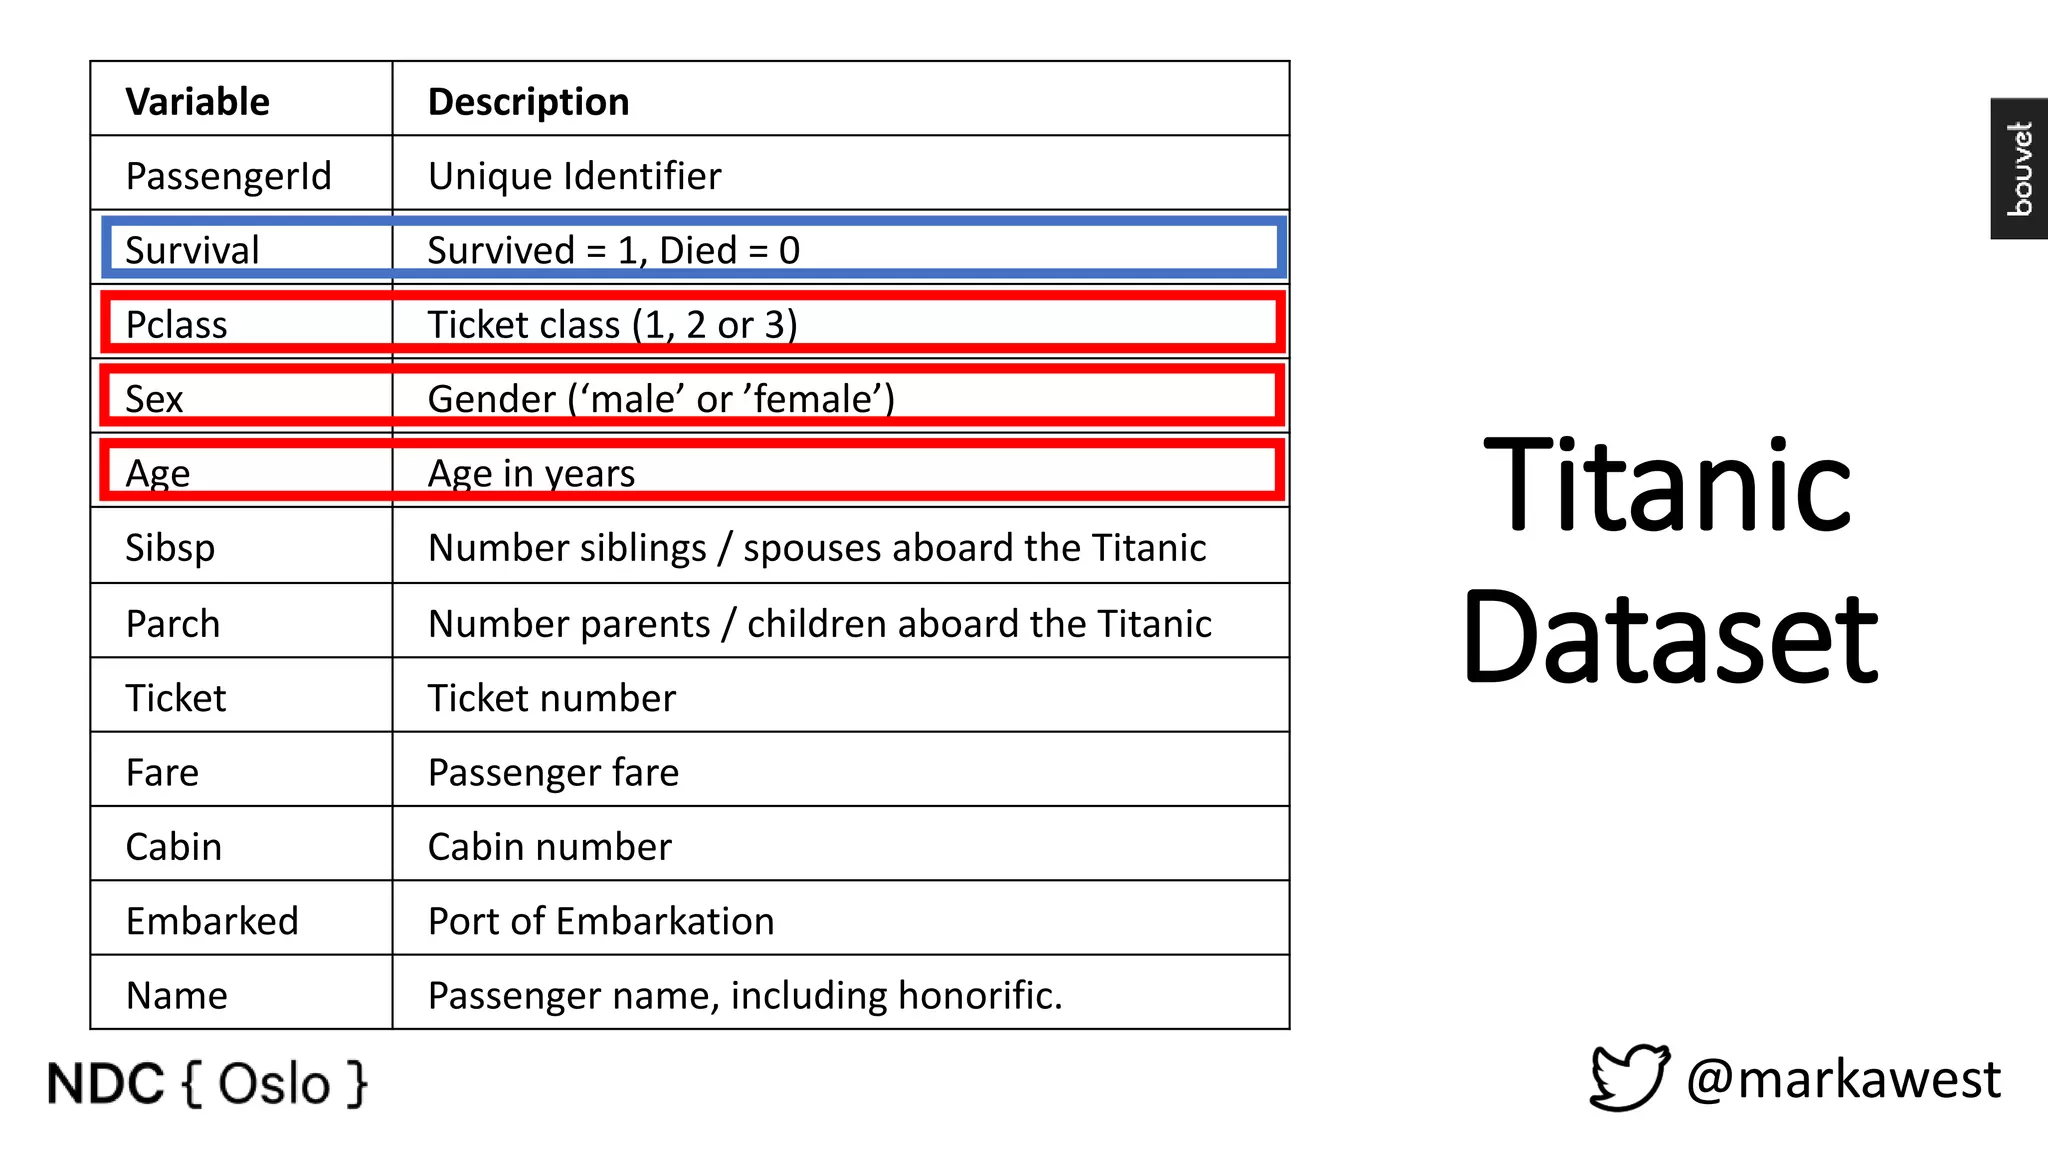
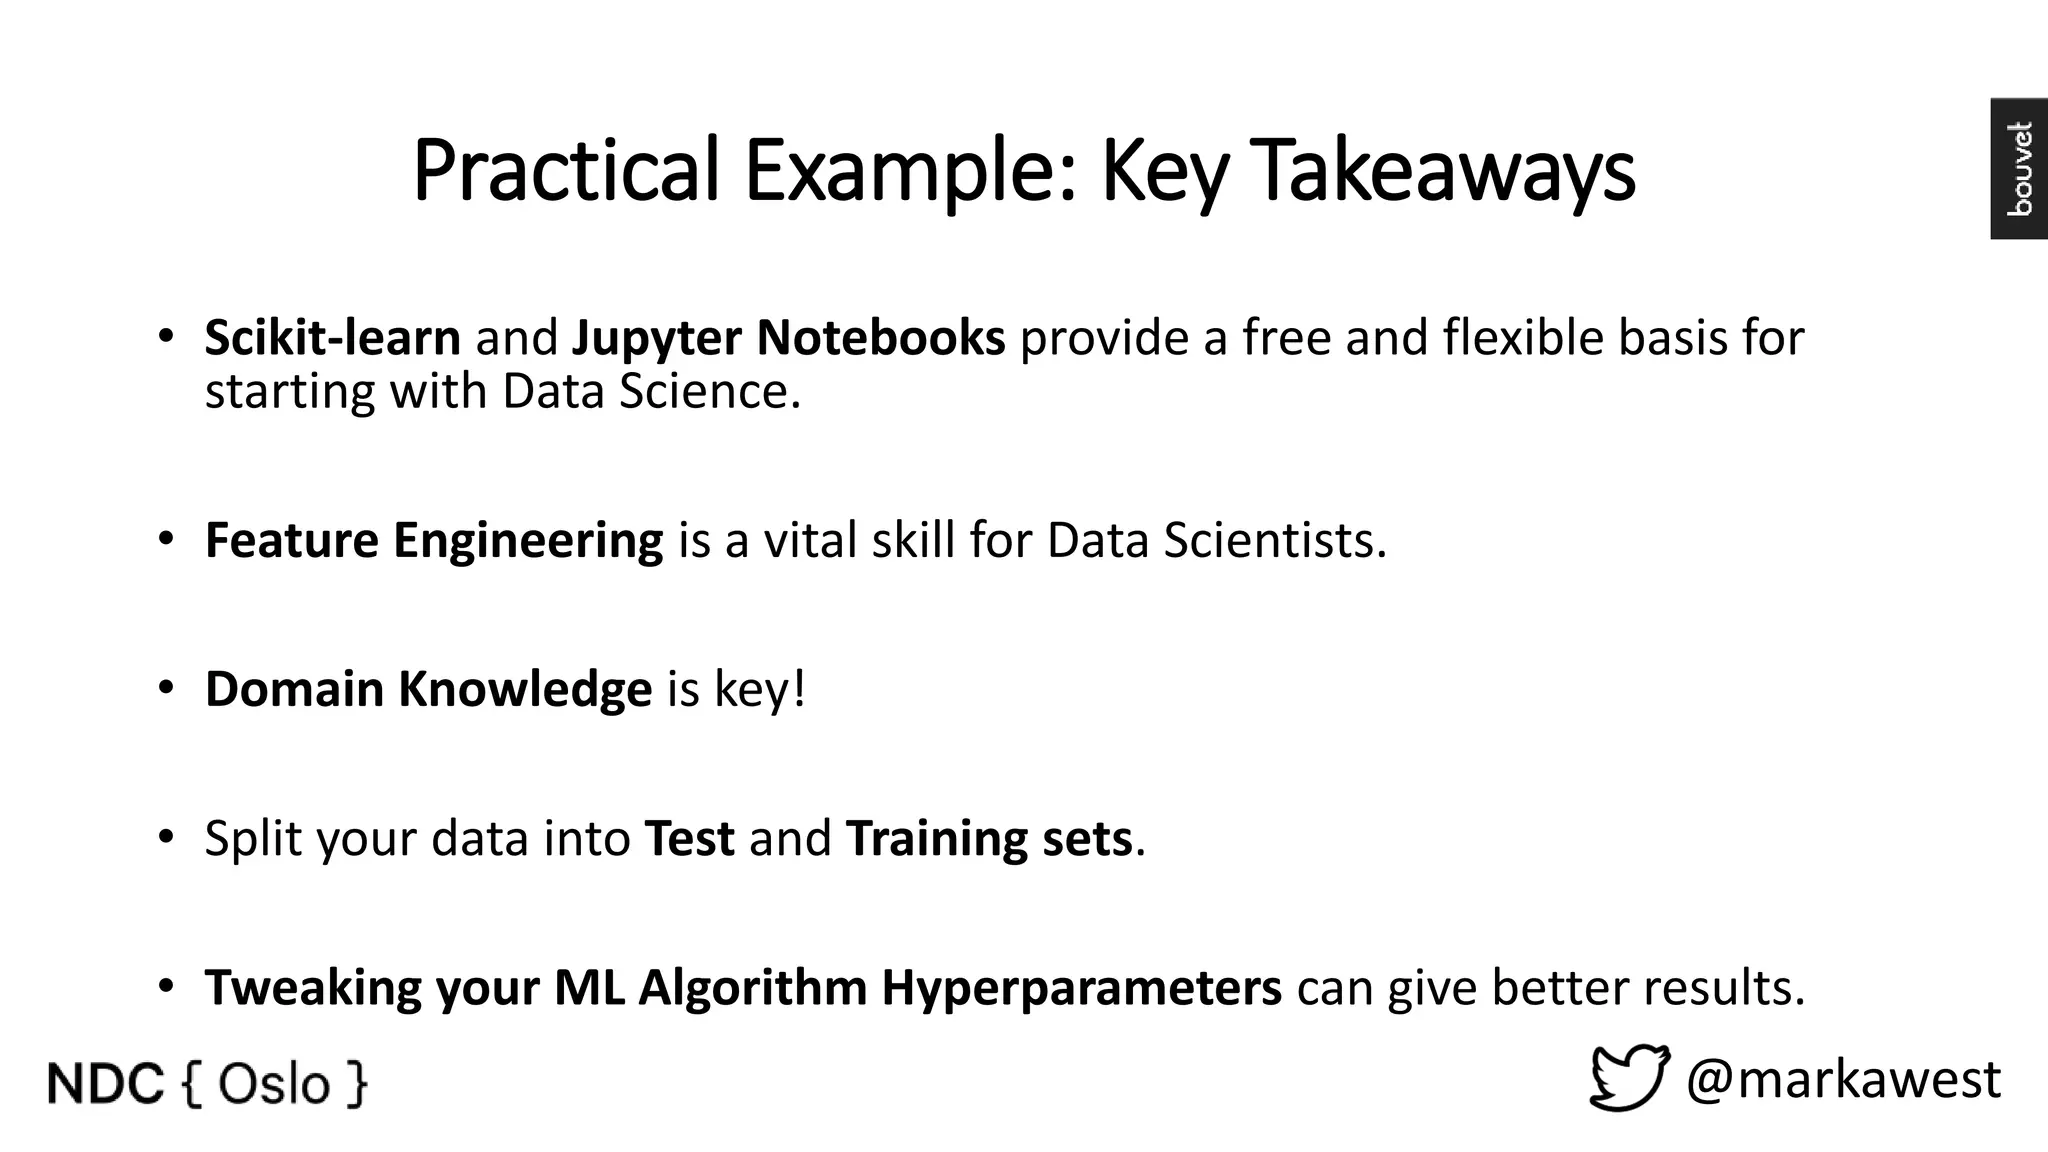
A Practical Introduction to Data Science @markawest
A Practical-ish Introduction to Data Science @markawest
Who Am I? @markawest
Who Am I? • Previously Java Developer and Architect. @markawest
Who Am I? • Previously Java Developer and Architect. • Currently building and managing a team of Data Scientists at Bouvet Oslo. @markawest
Who Am I? • Previously Java Developer and Architect. • Currently building and managing a team of Data Scientists at Bouvet Oslo. • Leader javaBin (Norwegian Java User Group). @markawest
Agenda What is Data Science? Machine Learning Algorithms Practical Example @markawest
What is Data Science? What is Data Science? Machine Learning Algorithms Practical Example @markawest
@markawest “An estimated 2.5 quintillion* bytes of data are created each day…” IBM * 1 quintillion = 1,000,000,000,000,000,000 (or 1,000,000,000 Gigabytes)
@markawest
@markawest “Data Science… is an interdisciplinary field of scientific methods, processes, and systems to extract knowledge or insight from data…” Wikipedia
Computer Science/IT @markawest
Computer Science/IT Domain/Business Knowledge Software Development @markawest
Computer Science/IT Math and Statistics Domain/Business Knowledge Machine Learning Software Development Traditional Research Data Science @markawest
Computer Science/IT Math and Statistics Domain/Business Knowledge Machine Learning Software Development Traditional Research @markawest
@markawest “Data Science… is an interdisciplinary field of scientific methods, processes, and systems to extract knowledge or insight from data…” Wikipedia
@markawest 1. Question 2. Data 3. Exploratory Data Analysis 4. Formal Modelling 5. Interperetation 6. Communication 7. Result Data Science Process : Hypothesis Driven
@markawest Roles Required in a Data Science Project • Prove / disprove hypotheses. • Information and Data Gathering. • Data Wrangling. • Algorithm and ML models. • Communication. Data Scientist • Build Data Driven Platforms. • Operationalize Algorithms and Machine Learning models. • Data Integration. Data Engineer • Storytelling. • Build Dashboards and other Data visualizations. • Provide insight through visual means. Visualization Expert • Project Management. • Manage stakeholder expectations. • Maintain a Vision. • Facilitate. Process Owner
@markawest Roles Required in a Data Science Project • Prove / disprove hypotheses. • Information and Data gathering. • Data wrangling. • Algorithm and ML models. • Communication. Data Scientist • Build Data Driven Platforms. • Operationalize Algorithms and Machine Learning models. • Data Integration. Data Engineer • Storytelling. • Build Dashboards and other Data visualizations. • Provide insight through visual means. Visualization Expert • Project Management. • Manage stakeholder expectations. • Maintain a Vision. • Facilitate. Process Owner
@markawest “Data Science… is an interdisciplinary field of scientific methods, processes, and systems to extract knowledge or insight from data…” Wikipedia
Isn’t Data Science just a rebranding of Business Intelligence? @markawest
@markawest Data Science as an Evolution of BI Business Intelligence Data Science Adds.. Data Sources Structured Data, most often from Relational Database Management Systems (RDBMS). Unstructured Data (log files, audio, images, emails, tweets, raw text, documents). Available Tools Data Visualization, Statistics. Advanced technologies such as Machine Learning and NLP. Goals Provide support to strategic decision making, based on historical data. Provide business value through advanced functionality and technologies. Source: https://www.linkedin.com/pulse/data-science-business-intelligence-whats-difference-david-rostcheck
@markawest Machine Learning: A Tool for Data Science
@markawest Machine Learning: A Tool for Data Science Artificial Intelligence Artificial Intelligence Enabling computers to mimic human intelligence and behavior.
@markawest Machine Learning: A Tool for Data Science Artificial Intelligence Machine Learning Artificial Intelligence Enabling computers to mimic human intelligence and behavior. Machine Learning Algorithms allowing computers to learn, make predictions and describe data without being explicitly programmed.
@markawest Machine Learning: A Tool for Data Science Artificial Intelligence Machine Learning Deep Learning Machine Learning Algorithms allowing computers to learn, make predictions and describe data without being explicitly programmed. Artificial Intelligence Enabling computers to mimic human intelligence and behavior. Deep Learning Black box learning with multi-layered Neural Networks.
What is Data Science: Key Takeaways • Data Scientists require Math and Statistics skills in addition to traditional Software Development. • Data Science is Hypothesis Driven. • Data Science projects require a range of competencies/roles. • Data Science can be seen as an evolution of Business Intelligence, providing additional capabilities through the application of cutting edge technologies and unstructured data. @markawest
Machine Learning Algorithms What is Data Science? Machine Learning Algorithms Practical Example @markawest
@markawest “Machine Learning: Field of study that gives computers the ability to learn without being explicitly programmed.” Arthur L. Samuel IBM Journal of Research and Development, 1959 Computer Data Rules Output Computer Data Output Rules Traditional Programming Machine Learning
Machine Learning: Models vs. Algorithms @markawest Algorithm Training Data (In) Model (Out) Data set representing the domain to be modelled. Implemented Machine Learning Algorithm. Rule set based on Algorithm and Training Data.
The Importance of a Generalized Model @markawest Training Data New Data
Overfitting & Underfitting in Machine Learning @markawest Underfitted Appropriate Overfitted Generalized model with an acceptable error margin. Model focuses on noise in training data. Model overlooks underlying patterns.
Supervised Learning Machine Learning Types @markawest Unsupervised Learning Model trained on historical data. Resulting model can be used to make predictions on new data. Use Case: Predicting a value based on patterns discovered in previous data. Model finds trends and patterns in data, without prior training on historical data. Use Case: Describing your data based on statistical analysis. Reinforcement Learning Model uses a feedback loop to iteratively improve it’s performance. Use Case: Learning how to best solve a problem based on trial and error.
Machine Learning Algorithm Types @markawest Supervised Learning Unsupervised Learning
Common Machine Learning Types @markawest Supervised Learning Unsupervised Learning ClassificationRegression Clustering
Example Machine Learning Algorithms @markawest Supervised Learning Unsupervised Learning Linear Regression ClassificationRegression K-Means Clustering Support Vector Machines Decision Trees
Floor Space House Price 1 180 221 900 2 570 538 000 770 180 000 1 960 604 000 1 680 510 000 … … … … 5 240 1 225 000 Linear Regression (predicts continuous values) Feature Label @markawest
Floor Space House Price 1 180 221 900 2 570 538 000 770 180 000 1 960 604 000 1 680 510 000 … … … … 5 240 1 225 000 Linear Regression (predicts continuous values) Feature Label Trend Line Deviation Outlier Prediction @markawest
Linear Regression Notes Benefits • Simple to understand. • Transparent. Limitations • Outliers skew trend line. • Doesn’t work well with non- linear relationships. Some Alternatives • Non-linear Least Squares. • Tree algorithms. @markawest
Example Machine Learning Algorithms @markawest Supervised Learning Unsupervised Learning Linear Regression ClassificationRegression K-Means Clustering Support Vector Machines Decision Trees
Support Vector Machine (predicts discrete classes) @markawest • Challenge: Define an optimal line for separating classes.
Support Vector Machine (predicts discrete classes) @markawest • Challenge: Define an optimal line for separating classes. • Solution: Find the support vectors, the optimal boundary can be placed equidistant between these.
Support Vector Machine (predicts discrete classes) @markawest • Challenge: Define an optimal line for separating classes. • Solution: Find the support vectors, the optimal boundary can be placed equidistant between these. Optimal Boundary Support Vector Support Vector
The SVM Buffer Zone (predicts discrete classes) @markawest • SVM’s allow the definition of a “buffer zone”. • Any training data in the buffer zone is ignored, making the model resilient to outliers and more generic. Optimal Boundary Support Vector Support Vector
Support Vector Machine Notes Benefits • Resistant to outliers. • Works with both linear and non-linear boundaries. • Works well with large feature sets (high dimensionality). Limitations • Works best with binary classification. • Tricky to tune (i.e. buffer zone). Some Alternatives • Logistic Regression. • Decision Trees. • K-Nearest Neighbors. @markawest
Example Machine Learning Algorithms @markawest Supervised Learning Unsupervised Learning Linear Regression ClassificationRegression K-Means Clustering Support Vector Machines Decision Trees
Decision Tree (predicts discrete classes) @markawest Outlook Temp Humidity Wind Play Sunny Hot High Weak No Sunny Hot High Strong No Overcast Hot High Weak Yes … … … … … … … … … … Overcast Mild High Strong Yes Overcast Hot Normal Weak Yes Rain Mild High Strong No No Yes No Yes Yes Outlook Humidity Wind Features Labels Overcast Sunny Rain High WeakNormal Strong
Building a Decision Tree: Recursive Partitioning @markawest 1. Find the Feature that optimally splits data points into homogeneous groups.Outlook Temp Humidity Wind Play Sunny Hot High Weak No Sunny Hot High Strong No Overcast Hot High Weak Yes … … … … … … … … … … Overcast Mild High Strong Yes Overcast Hot Normal Weak Yes Rain Mild High Strong No Features Labels
Building a Decision Tree: Recursive Partitioning @markawest 1. Find the Feature that optimally “slices” data points into homogeneous groups. 2. Repeat for each leaf, until a stopping criteria is reached, for example: • Data points at each leaf have the same value. • Another threshold is set (i.e. maximum tree depth or minimum data points for each leaf is reached). No Yes No Yes YesHumidity Wind Overcast Sunny Rain High Normal Strong Outlook
Decision Tree Notes Benefits • White Box. • Flexible (use for both regression and classification). • Robust to outliers. • Handle non-linear boundaries. Limitations • Susceptible to overfitting. • Changes to where the Data is sliced can produce different results. Some Alternatives • Support Vector Machine. • Logistic Regression. • Random Forests. @markawest
Example Machine Learning Algorithms @markawest Supervised Learning Unsupervised Learning Linear Regression ClassificationRegression K-Means Clustering Support Vector Machines Decision Trees
K-Means Clustering (describing data without training first) @markawest • K = The amount of clusters the algorithm will try to find. • K = Should be large enough to extract meaningful patterns but small enough that clusters remain clearly distinct. • So how do we calculate K?
K-Means: Calculating the K value @markawest • Scree Plots allow us to find optimal number of clusters. • Sum of Squared Error (SSE). • The optimal K value is at the “Elbow” of the plot.
K-Means Demo Randomly allocate centroids @markawest
K-Means Demo Iteration 1: Calculate cluster membership based on nearest centroid @markawest
K-Means Demo Iteration 1: Move centroids to the center of their cluster @markawest
K-Means Demo Iteration 2: Recalculate cluster membership based on nearest centroid @markawest
K-Means Demo Iteration 2: Move centroids to the center of their cluster @markawest
K-Means Demo After 6 iterations: Clusters and centroids stablise, algorithm stops @markawest
K-Means Clustering Notes Benefits • Fast and highly effective at uncovering basic data patterns. • Works best for spherical, non- overlapping clusters. Limitations • Each data point can only be assigned to one cluster. • Clusters are assumed to be spherical. Some Alternatives • Gaussian mixtures. • Fuzzy K-Means. @markawest
Does Machine Learning really need Data Science skillz? @markawest
Data Science Skills and Machine Learning @markawest Machine Learning Data In Data Out Variable Selection Feature Engineering Algorithm Selection Algorithm Tuning Interpret Results Evaluation Communication
Machine Learning Algorithms: Key Takeaways @markawest • The three main types of Machine Learning are Supervised, Unsupervised and Reinforcement Learning. • A successful Machine Learning Model needs to find the balance between Overfitting and Underfitting. • Machine Learning Algorithms are merely tools. Good results come from understanding how they work and tuning them correctly. • Data Science skills are vital for succeeding with Machine Learning.
Practical Example What is Data Science? Machine Learning Algorithms Practical Example @markawest
Use Case: Titanic Passenger Survival @markawest Goal: Build a classification model for predicting Titanic survivability.
Hypothesis That it is possible to predict Titanic survivability based on Age, Gender and Ticket Class. @markawest
@markawest Variable Description PassengerId Unique Identifier Survival Survived = 1, Died = 0 Pclass Ticket class (1, 2 or 3) Sex Gender (‘male’ or ’female’) Age Age in years Sibsp Number siblings / spouses aboard the Titanic Parch Number parents / children aboard the Titanic Ticket Ticket number Fare Passenger fare Cabin Cabin number Embarked Port of Embarkation Name Passenger name, including honorific. Titanic Dataset
Tools @markawest
Practical Example: Key Takeaways @markawest • Scikit-learn and Jupyter Notebooks provide a free and flexible basis for starting with Data Science. • Feature Engineering is a vital skill for Data Scientists. • Domain Knowledge is key! • Split your data into Test and Training sets. • Tweaking your ML Algorithm Hyperparameters can give better results.
Thanks for listening! @markawest

NDC Oslo : A Practical Introduction to Data Science

  • 1.
  • 2.
  • 3.
  • 4.
    Who Am I? •Previously Java Developer and Architect. @markawest
  • 5.
    Who Am I? •Previously Java Developer and Architect. • Currently building and managing a team of Data Scientists at Bouvet Oslo. @markawest
  • 6.
    Who Am I? •Previously Java Developer and Architect. • Currently building and managing a team of Data Scientists at Bouvet Oslo. • Leader javaBin (Norwegian Java User Group). @markawest
  • 7.
  • 8.
  • 9.
  • 10.
  • 11.
    What is DataScience? What is Data Science? Machine Learning Algorithms Practical Example @markawest
  • 12.
    @markawest “An estimated 2.5 quintillion*bytes of data are created each day…” IBM * 1 quintillion = 1,000,000,000,000,000,000 (or 1,000,000,000 Gigabytes)
  • 13.
  • 14.
    @markawest “Data Science… isan interdisciplinary field of scientific methods, processes, and systems to extract knowledge or insight from data…” Wikipedia
  • 15.
    @markawest “Data Science… isan interdisciplinary field of scientific methods, processes, and systems to extract knowledge or insight from data…” Wikipedia
  • 16.
  • 17.
  • 18.
  • 19.
  • 20.
    @markawest “Data Science… isan interdisciplinary field of scientific methods, processes, and systems to extract knowledge or insight from data…” Wikipedia
  • 21.
    @markawest 1. Question 2.Data 3. Exploratory Data Analysis 4. Formal Modelling 5. Interperetation 6. Communication 7. Result Data Science Process : Hypothesis Driven
  • 22.
    @markawest 1. Question 2.Data 3. Exploratory Data Analysis 4. Formal Modelling 5. Interperetation 6. Communication 7. Result Data Science Process : Hypothesis Driven
  • 23.
    @markawest 1. Question 2.Data 3. Exploratory Data Analysis 4. Formal Modelling 5. Interperetation 6. Communication 7. Result Data Science Process : Hypothesis Driven
  • 24.
    @markawest 1. Question 2.Data 3. Exploratory Data Analysis 4. Formal Modelling 5. Interperetation 6. Communication 7. Result Data Science Process : Hypothesis Driven
  • 25.
    @markawest 1. Question 2.Data 3. Exploratory Data Analysis 4. Formal Modelling 5. Interperetation 6. Communication 7. Result Data Science Process : Hypothesis Driven
  • 26.
    @markawest 1. Question 2.Data 3. Exploratory Data Analysis 4. Formal Modelling 5. Interperetation 6. Communication 7. Result Data Science Process : Hypothesis Driven
  • 27.
    @markawest 1. Question 2.Data 3. Exploratory Data Analysis 4. Formal Modelling 5. Interperetation 6. Communication 7. Result Data Science Process : Hypothesis Driven
  • 28.
    @markawest Roles Required ina Data Science Project • Prove / disprove hypotheses. • Information and Data Gathering. • Data Wrangling. • Algorithm and ML models. • Communication. Data Scientist • Build Data Driven Platforms. • Operationalize Algorithms and Machine Learning models. • Data Integration. Data Engineer • Storytelling. • Build Dashboards and other Data visualizations. • Provide insight through visual means. Visualization Expert • Project Management. • Manage stakeholder expectations. • Maintain a Vision. • Facilitate. Process Owner
  • 29.
    @markawest Roles Required ina Data Science Project • Prove / disprove hypotheses. • Information and Data gathering. • Data wrangling. • Algorithm and ML models. • Communication. Data Scientist • Build Data Driven Platforms. • Operationalize Algorithms and Machine Learning models. • Data Integration. Data Engineer • Storytelling. • Build Dashboards and other Data visualizations. • Provide insight through visual means. Visualization Expert • Project Management. • Manage stakeholder expectations. • Maintain a Vision. • Facilitate. Process Owner
  • 30.
    @markawest Roles Required ina Data Science Project • Prove / disprove hypotheses. • Information and Data gathering. • Data wrangling. • Algorithm and ML models. • Communication. Data Scientist • Build Data Driven Platforms. • Operationalize Algorithms and Machine Learning models. • Data Integration. Data Engineer • Storytelling. • Build Dashboards and other Data visualizations. • Provide insight through visual means. Visualization Expert • Project Management. • Manage stakeholder expectations. • Maintain a Vision. • Facilitate. Process Owner
  • 31.
    @markawest Roles Required ina Data Science Project • Prove / disprove hypotheses. • Information and Data gathering. • Data wrangling. • Algorithm and ML models. • Communication. Data Scientist • Build Data Driven Platforms. • Operationalize Algorithms and Machine Learning models. • Data Integration. Data Engineer • Storytelling. • Build Dashboards and other Data visualizations. • Provide insight through visual means. Visualization Expert • Project Management. • Manage stakeholder expectations. • Maintain a Vision. • Facilitate. Process Owner
  • 32.
    @markawest Roles Required ina Data Science Project • Prove / disprove hypotheses. • Information and Data gathering. • Data wrangling. • Algorithm and ML models. • Communication. Data Scientist • Build Data Driven Platforms. • Operationalize Algorithms and Machine Learning models. • Data Integration. Data Engineer • Storytelling. • Build Dashboards and other Data visualizations. • Provide insight through visual means. Visualization Expert • Project Management. • Manage stakeholder expectations. • Maintain a Vision. • Facilitate. Process Owner
  • 33.
    @markawest “Data Science… isan interdisciplinary field of scientific methods, processes, and systems to extract knowledge or insight from data…” Wikipedia
  • 34.
    Isn’t Data Sciencejust a rebranding of Business Intelligence? @markawest
  • 35.
    @markawest Data Science asan Evolution of BI Business Intelligence Data Science Adds.. Data Sources Structured Data, most often from Relational Database Management Systems (RDBMS). Unstructured Data (log files, audio, images, emails, tweets, raw text, documents). Available Tools Data Visualization, Statistics. Advanced technologies such as Machine Learning and NLP. Goals Provide support to strategic decision making, based on historical data. Provide business value through advanced functionality and technologies. Source: https://www.linkedin.com/pulse/data-science-business-intelligence-whats-difference-david-rostcheck
  • 36.
    @markawest Machine Learning: ATool for Data Science
  • 37.
    @markawest Machine Learning: ATool for Data Science Artificial Intelligence Artificial Intelligence Enabling computers to mimic human intelligence and behavior.
  • 38.
    @markawest Machine Learning: ATool for Data Science Artificial Intelligence Machine Learning Artificial Intelligence Enabling computers to mimic human intelligence and behavior. Machine Learning Algorithms allowing computers to learn, make predictions and describe data without being explicitly programmed.
  • 39.
    @markawest Machine Learning: ATool for Data Science Artificial Intelligence Machine Learning Deep Learning Machine Learning Algorithms allowing computers to learn, make predictions and describe data without being explicitly programmed. Artificial Intelligence Enabling computers to mimic human intelligence and behavior. Deep Learning Black box learning with multi-layered Neural Networks.
  • 40.
    What is DataScience: Key Takeaways • Data Scientists require Math and Statistics skills in addition to traditional Software Development. • Data Science is Hypothesis Driven. • Data Science projects require a range of competencies/roles. • Data Science can be seen as an evolution of Business Intelligence, providing additional capabilities through the application of cutting edge technologies and unstructured data. @markawest
  • 41.
    Machine Learning Algorithms What isData Science? Machine Learning Algorithms Practical Example @markawest
  • 42.
    @markawest “Machine Learning: Field ofstudy that gives computers the ability to learn without being explicitly programmed.” Arthur L. Samuel IBM Journal of Research and Development, 1959 Computer Data Rules Output Computer Data Output Rules Traditional Programming Machine Learning
  • 43.
    Machine Learning: Modelsvs. Algorithms @markawest Algorithm Training Data (In) Model (Out) Data set representing the domain to be modelled. Implemented Machine Learning Algorithm. Rule set based on Algorithm and Training Data.
  • 44.
    The Importance ofa Generalized Model @markawest Training Data New Data
  • 45.
    Overfitting & Underfittingin Machine Learning @markawest Underfitted Appropriate Overfitted Generalized model with an acceptable error margin. Model focuses on noise in training data. Model overlooks underlying patterns.
  • 47.
    Supervised Learning Machine LearningTypes @markawest Unsupervised Learning Model trained on historical data. Resulting model can be used to make predictions on new data. Use Case: Predicting a value based on patterns discovered in previous data. Model finds trends and patterns in data, without prior training on historical data. Use Case: Describing your data based on statistical analysis. Reinforcement Learning Model uses a feedback loop to iteratively improve it’s performance. Use Case: Learning how to best solve a problem based on trial and error.
  • 48.
    Machine Learning AlgorithmTypes @markawest Supervised Learning Unsupervised Learning
  • 49.
    Common Machine LearningTypes @markawest Supervised Learning Unsupervised Learning ClassificationRegression Clustering
  • 50.
    Example Machine LearningAlgorithms @markawest Supervised Learning Unsupervised Learning Linear Regression ClassificationRegression K-Means Clustering Support Vector Machines Decision Trees
  • 51.
    Example Machine LearningAlgorithms @markawest Supervised Learning Unsupervised Learning Linear Regression ClassificationRegression K-Means Clustering Support Vector Machines Decision Trees
  • 52.
    Floor Space HousePrice 1 180 221 900 2 570 538 000 770 180 000 1 960 604 000 1 680 510 000 … … … … 5 240 1 225 000 Linear Regression (predicts continuous values) Feature Label @markawest
  • 53.
    Floor Space HousePrice 1 180 221 900 2 570 538 000 770 180 000 1 960 604 000 1 680 510 000 … … … … 5 240 1 225 000 Linear Regression (predicts continuous values) Feature Label Trend Line Deviation Outlier Prediction @markawest
  • 54.
    Linear Regression Notes Benefits •Simple to understand. • Transparent. Limitations • Outliers skew trend line. • Doesn’t work well with non- linear relationships. Some Alternatives • Non-linear Least Squares. • Tree algorithms. @markawest
  • 55.
    Example Machine LearningAlgorithms @markawest Supervised Learning Unsupervised Learning Linear Regression ClassificationRegression K-Means Clustering Support Vector Machines Decision Trees
  • 56.
    Support Vector Machine (predictsdiscrete classes) @markawest • Challenge: Define an optimal line for separating classes.
  • 57.
    Support Vector Machine (predictsdiscrete classes) @markawest • Challenge: Define an optimal line for separating classes. • Solution: Find the support vectors, the optimal boundary can be placed equidistant between these.
  • 58.
    Support Vector Machine (predictsdiscrete classes) @markawest • Challenge: Define an optimal line for separating classes. • Solution: Find the support vectors, the optimal boundary can be placed equidistant between these. Optimal Boundary Support Vector Support Vector
  • 59.
    The SVM BufferZone (predicts discrete classes) @markawest • SVM’s allow the definition of a “buffer zone”. • Any training data in the buffer zone is ignored, making the model resilient to outliers and more generic. Optimal Boundary Support Vector Support Vector
  • 60.
    Support Vector MachineNotes Benefits • Resistant to outliers. • Works with both linear and non-linear boundaries. • Works well with large feature sets (high dimensionality). Limitations • Works best with binary classification. • Tricky to tune (i.e. buffer zone). Some Alternatives • Logistic Regression. • Decision Trees. • K-Nearest Neighbors. @markawest
  • 61.
    Example Machine LearningAlgorithms @markawest Supervised Learning Unsupervised Learning Linear Regression ClassificationRegression K-Means Clustering Support Vector Machines Decision Trees
  • 62.
    Decision Tree (predicts discreteclasses) @markawest Outlook Temp Humidity Wind Play Sunny Hot High Weak No Sunny Hot High Strong No Overcast Hot High Weak Yes … … … … … … … … … … Overcast Mild High Strong Yes Overcast Hot Normal Weak Yes Rain Mild High Strong No No Yes No Yes Yes Outlook Humidity Wind Features Labels Overcast Sunny Rain High WeakNormal Strong
  • 63.
    Building a DecisionTree: Recursive Partitioning @markawest 1. Find the Feature that optimally splits data points into homogeneous groups.Outlook Temp Humidity Wind Play Sunny Hot High Weak No Sunny Hot High Strong No Overcast Hot High Weak Yes … … … … … … … … … … Overcast Mild High Strong Yes Overcast Hot Normal Weak Yes Rain Mild High Strong No Features Labels
  • 64.
    Building a DecisionTree: Recursive Partitioning @markawest 1. Find the Feature that optimally “slices” data points into homogeneous groups. 2. Repeat for each leaf, until a stopping criteria is reached, for example: • Data points at each leaf have the same value. • Another threshold is set (i.e. maximum tree depth or minimum data points for each leaf is reached). No Yes No Yes YesHumidity Wind Overcast Sunny Rain High Normal Strong Outlook
  • 65.
    Decision Tree Notes Benefits •White Box. • Flexible (use for both regression and classification). • Robust to outliers. • Handle non-linear boundaries. Limitations • Susceptible to overfitting. • Changes to where the Data is sliced can produce different results. Some Alternatives • Support Vector Machine. • Logistic Regression. • Random Forests. @markawest
  • 66.
    Example Machine LearningAlgorithms @markawest Supervised Learning Unsupervised Learning Linear Regression ClassificationRegression K-Means Clustering Support Vector Machines Decision Trees
  • 67.
    K-Means Clustering (describing datawithout training first) @markawest • K = The amount of clusters the algorithm will try to find. • K = Should be large enough to extract meaningful patterns but small enough that clusters remain clearly distinct. • So how do we calculate K?
  • 68.
    K-Means: Calculating theK value @markawest • Scree Plots allow us to find optimal number of clusters. • Sum of Squared Error (SSE). • The optimal K value is at the “Elbow” of the plot.
  • 69.
    K-Means Demo Randomly allocatecentroids @markawest
  • 70.
    K-Means Demo Randomly allocatecentroids @markawest
  • 71.
    K-Means Demo Iteration 1:Calculate cluster membership based on nearest centroid @markawest
  • 72.
    K-Means Demo Iteration 1:Move centroids to the center of their cluster @markawest
  • 73.
    K-Means Demo Iteration 2:Recalculate cluster membership based on nearest centroid @markawest
  • 74.
    K-Means Demo Iteration 2:Move centroids to the center of their cluster @markawest
  • 75.
    K-Means Demo After 6iterations: Clusters and centroids stablise, algorithm stops @markawest
  • 76.
    K-Means Clustering Notes Benefits •Fast and highly effective at uncovering basic data patterns. • Works best for spherical, non- overlapping clusters. Limitations • Each data point can only be assigned to one cluster. • Clusters are assumed to be spherical. Some Alternatives • Gaussian mixtures. • Fuzzy K-Means. @markawest
  • 77.
    Does Machine Learning reallyneed Data Science skillz? @markawest
  • 78.
    Data Science Skillsand Machine Learning @markawest Machine Learning Data In Data Out Variable Selection Feature Engineering Algorithm Selection Algorithm Tuning Interpret Results Evaluation Communication
  • 79.
    Machine Learning Algorithms:Key Takeaways @markawest • The three main types of Machine Learning are Supervised, Unsupervised and Reinforcement Learning. • A successful Machine Learning Model needs to find the balance between Overfitting and Underfitting. • Machine Learning Algorithms are merely tools. Good results come from understanding how they work and tuning them correctly. • Data Science skills are vital for succeeding with Machine Learning.
  • 80.
    Practical Example What isData Science? Machine Learning Algorithms Practical Example @markawest
  • 81.
    Use Case: TitanicPassenger Survival @markawest Goal: Build a classification model for predicting Titanic survivability.
  • 82.
    Hypothesis That it ispossible to predict Titanic survivability based on Age, Gender and Ticket Class. @markawest
  • 83.
    @markawest Variable Description PassengerId UniqueIdentifier Survival Survived = 1, Died = 0 Pclass Ticket class (1, 2 or 3) Sex Gender (‘male’ or ’female’) Age Age in years Sibsp Number siblings / spouses aboard the Titanic Parch Number parents / children aboard the Titanic Ticket Ticket number Fare Passenger fare Cabin Cabin number Embarked Port of Embarkation Name Passenger name, including honorific. Titanic Dataset
  • 84.
  • 86.
    Practical Example: KeyTakeaways @markawest • Scikit-learn and Jupyter Notebooks provide a free and flexible basis for starting with Data Science. • Feature Engineering is a vital skill for Data Scientists. • Domain Knowledge is key! • Split your data into Test and Training sets. • Tweaking your ML Algorithm Hyperparameters can give better results.
  • 87.

Editor's Notes

  • #2 Welcome to my talk about Data Science. In this talk I will attempt to cut through the hype to give you an idea of what Data Science is, how it relates to Machine Learning, and finally give you some tips for getting started with your own Data Science and Machine Learning projects.
  • #3 Welcome to my talk about Data Science. In this talk I will attempt to cut through the hype to give you an idea of what Data Science is, how it relates to Machine Learning, and finally give you some tips for getting started with your own Data Science and Machine Learning projects.
  • #4 But first, who the devil am I? As you can see from my twitter handle my name is Mark West, and I’m an English living here in Oslo, Norway.
  • #5 Speaking for me is a hobby that I do to learn and share my own knowledge and experiences. In the past couple of years I have spoken at a range of conference across Europe and the US. The good news is that this is the first time I have spoken at NDC. This is also the first time I have given this specific talk so I am excited to hear your feedback. So lets get started!
  • #6 Speaking for me is a hobby that I do to learn and share my own knowledge and experiences. In the past couple of years I have spoken at a range of conference across Europe and the US. The good news is that this is the first time I have spoken at NDC. This is also the first time I have given this specific talk so I am excited to hear your feedback. So lets get started!
  • #7 Speaking for me is a hobby that I do to learn and share my own knowledge and experiences. In the past couple of years I have spoken at a range of conference across Europe and the US. The good news is that this is the first time I have spoken at NDC. This is also the first time I have given this specific talk so I am excited to hear your feedback. So lets get started!
  • #8 Here is the Agenda for my talk. As you can see it is split into four sections.
  • #9 I’ll then do on to define what Data Science is, what parts are most relevant for us, and out Data Science is linked with Machine Learning and Aritifical Intelligence. I’ll also talk about the drivers behind Data Science projects that the roles that these projects require.
  • #10 Machine Learning is the most popular application of Data Science at the moment, and I’ll therefore use some time to define the categories and types of Machine Learning algorithms, and give you some examples of the most commonly used algorithms.
  • #11 Finally I will show you a practical example of applied Data Science, and show you how Data Science is more than just Machine Learning.
  • #12 Right, so whats the motivation. Why am I here today?
  • #13 As a society we are becoming more and more data driven. Each day we generate huge amounts of data – not just in the systems we work with but with social media, IoT, and our interaction with the internet. Therefore it’s no surprise that our employers and customers are also looking to becoming more data driven. To extract insight from their data.
  • #28 Tip : Possibly replace this with Bouvet’s own methodology if it is ready and good enough.
  • #42 Ok, so lets move on to the second part of my talk – Machine Learning algorithms.
  • #43 Machine Learning is all about giving computers a framework to create their own logic or rules, without these being programmed by a human. Look at it as an inversion of control when compared to traditional programming.
  • #45 An underfitted model is likely to neglect significant trends, which would cause it to yield less accurate predictions for both current and future data. An overfitted model would yield highly accurate predictions for the current data, but would be less generalizable to future data. But when parameters are tuned just right, such as shown in Figure 2b, the algorithm strikes a balance between identifying major trends and discounting minor variations, rendering the resulting model well-suited for making predictions. Note – more complex models are prone to overfitting.
  • #46 An underfitted model is likely to neglect significant trends, which would cause it to yield less accurate predictions for both current and future data. An overfitted model would yield highly accurate predictions for the current data, but would be less generalizable to future data. But when parameters are tuned just right, such as shown in Figure 2b, the algorithm strikes a balance between identifying major trends and discounting minor variations, rendering the resulting model well-suited for making predictions. Note – more complex models are prone to overfitting.
  • #48 Note that reinforcement learning continuously improves itself, which supervised and unsupervised models will have to be built again to reflect new data. So if your use case requires you to
  • #54 Other forms of Regression Model that are popular include Non-Regression, which is used for modelling non-linear trend lines, and Logistic Regression, which is a form of Regression where the trend line is used to separate data points into classes.
  • #55 Multicollinearity You go to see a rock and roll band with two great guitar players. You're eager to see which one plays best. But on stage, they're both playing furious leads at the same time!  When they're both playing loud and fast, how can you tell which guitarist has the biggest effect on the sound?  Even though they aren't playing the same notes, what they're doing is so similar it's difficult to tell one from the other. 
  • #57 The main objective of SVM is to derive an optimal boundary that separates one group from another. This is not as simple as it sounds, given that there are numerous possibilities.
  • #58 Support vectors
  • #59 The main objective of SVM is to derive an optimal boundary that separates one group from another. This is not as simple as it sounds, given that there are numerous possibilities.
  • #60 The main objective of SVM is to derive an optimal boundary that separates one group from another. This is not as simple as it sounds, given that there are numerous possibilities.
  • #61 Multicollinearity You go to see a rock and roll band with two great guitar players. You're eager to see which one plays best. But on stage, they're both playing furious leads at the same time!  When they're both playing loud and fast, how can you tell which guitarist has the biggest effect on the sound?  Even though they aren't playing the same notes, what they're doing is so similar it's difficult to tell one from the other. 
  • #67 As decision trees are grown by splitting data points into homogeneous groups, a slight change in the data could trigger changes to the split, and result in a different tree. Why Random Forests As decision trees also aim for the best way to split data points each time, they are vulnerable to overfitting (see Chapter 1.3). Inaccuracy. Using the best binary question to split the data at the start might not lead to the most accurate predictions. Sometimes, less effective splits used initially may lead to better predictions subsequently.
  • #81 More Data beats complex algorithms : It’s all about the DATA!!!! Garbage in, Garbage out!!
  • #82 Right, so whats the motivation. Why am I here today?
  • #85 survival – Did the passenger survive? pclass – Which sex age sibsp parch ticket Fare cabin embarked