Downloaded 82 times


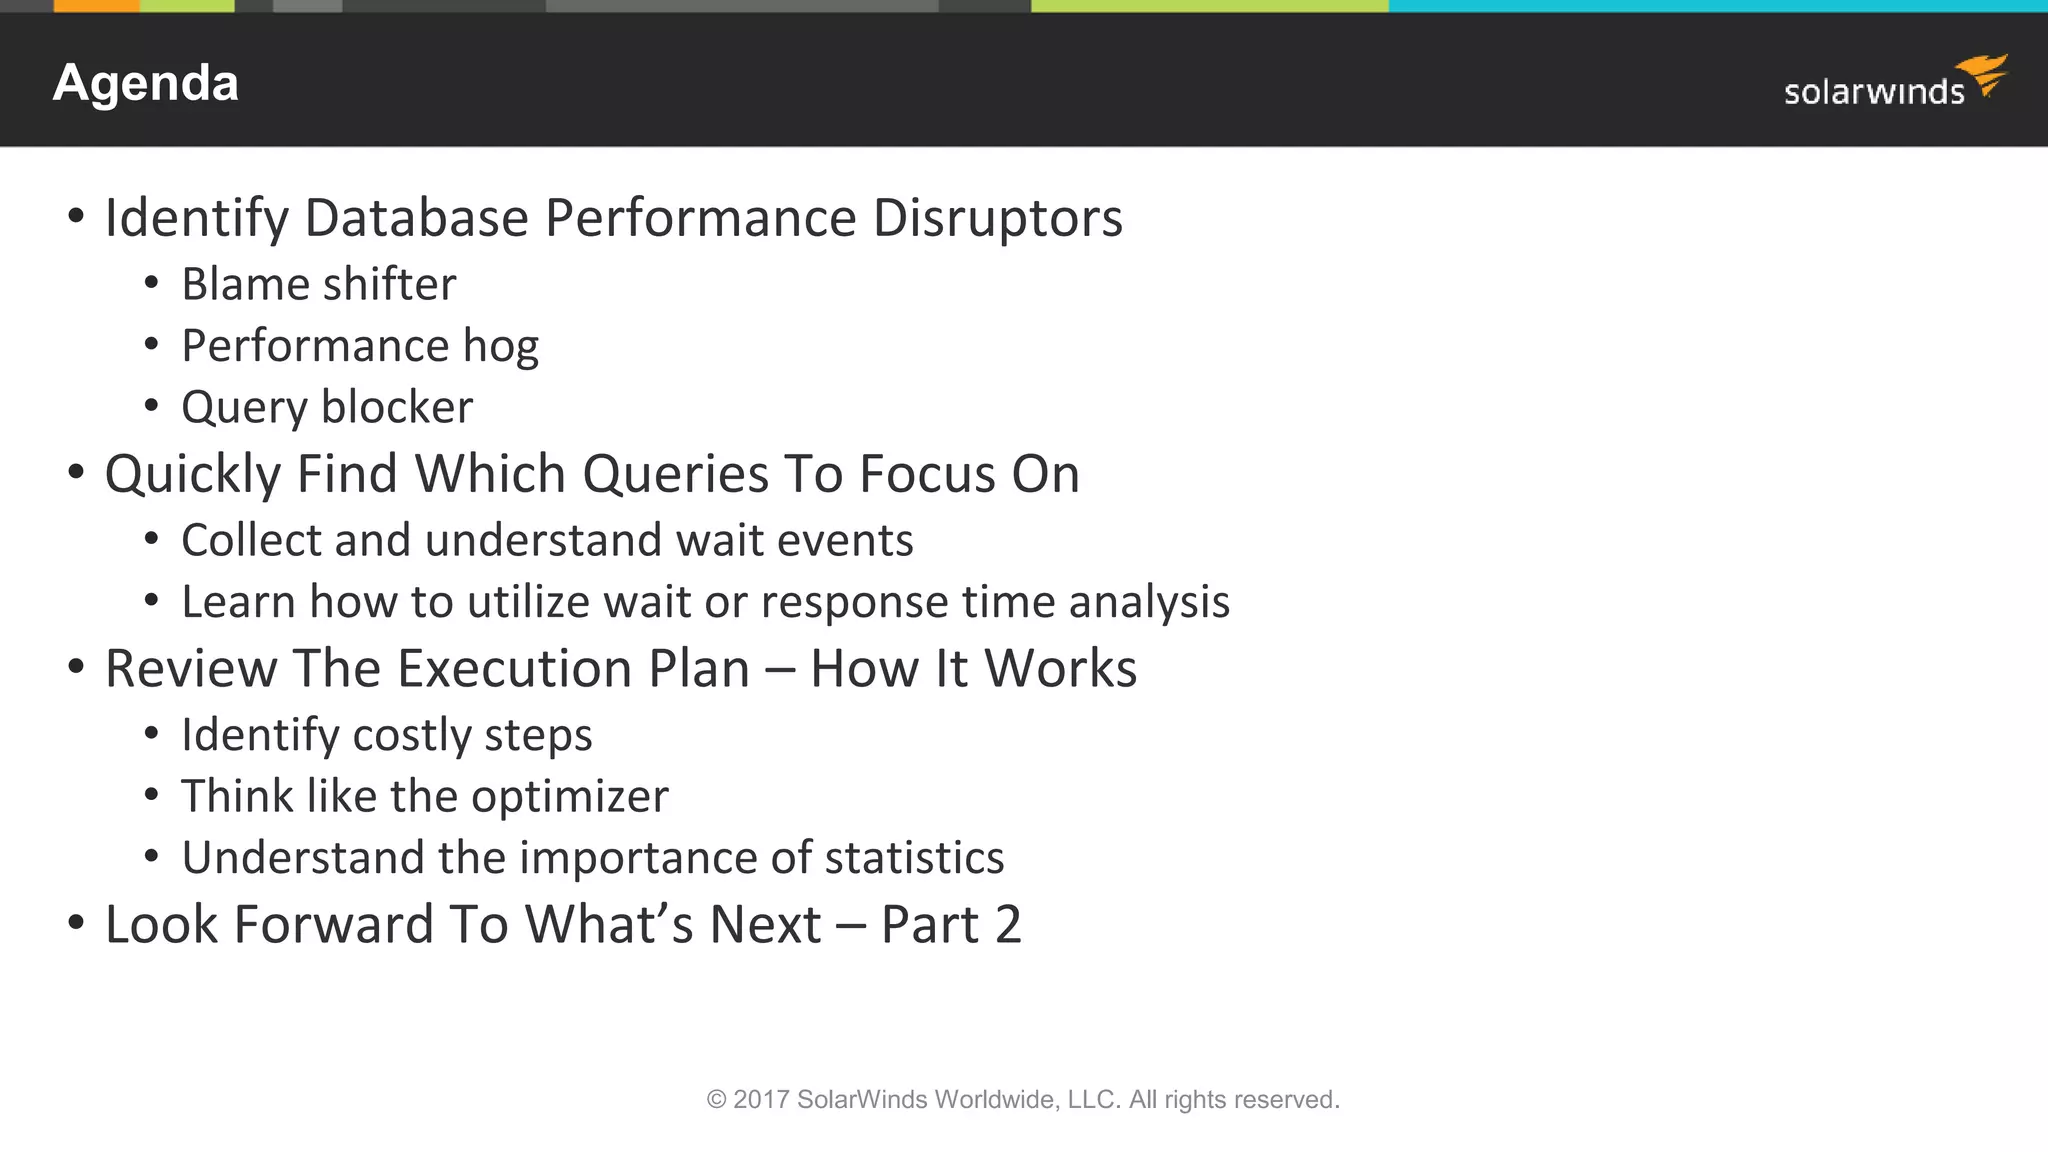


The document provides an overview and agenda for a presentation on optimizing Oracle database performance through query tuning. It discusses identifying performance issues, collecting wait event information, reviewing execution plans, and understanding how the Oracle optimizer works using features like adaptive plans and statistics gathering. The goal is to show attendees how to quickly find and focus on the queries most in need of tuning.
Introduction to the presentation by Janis Griffin, highlighting expertise and agenda focusing on database performance disruptors and query tuning.
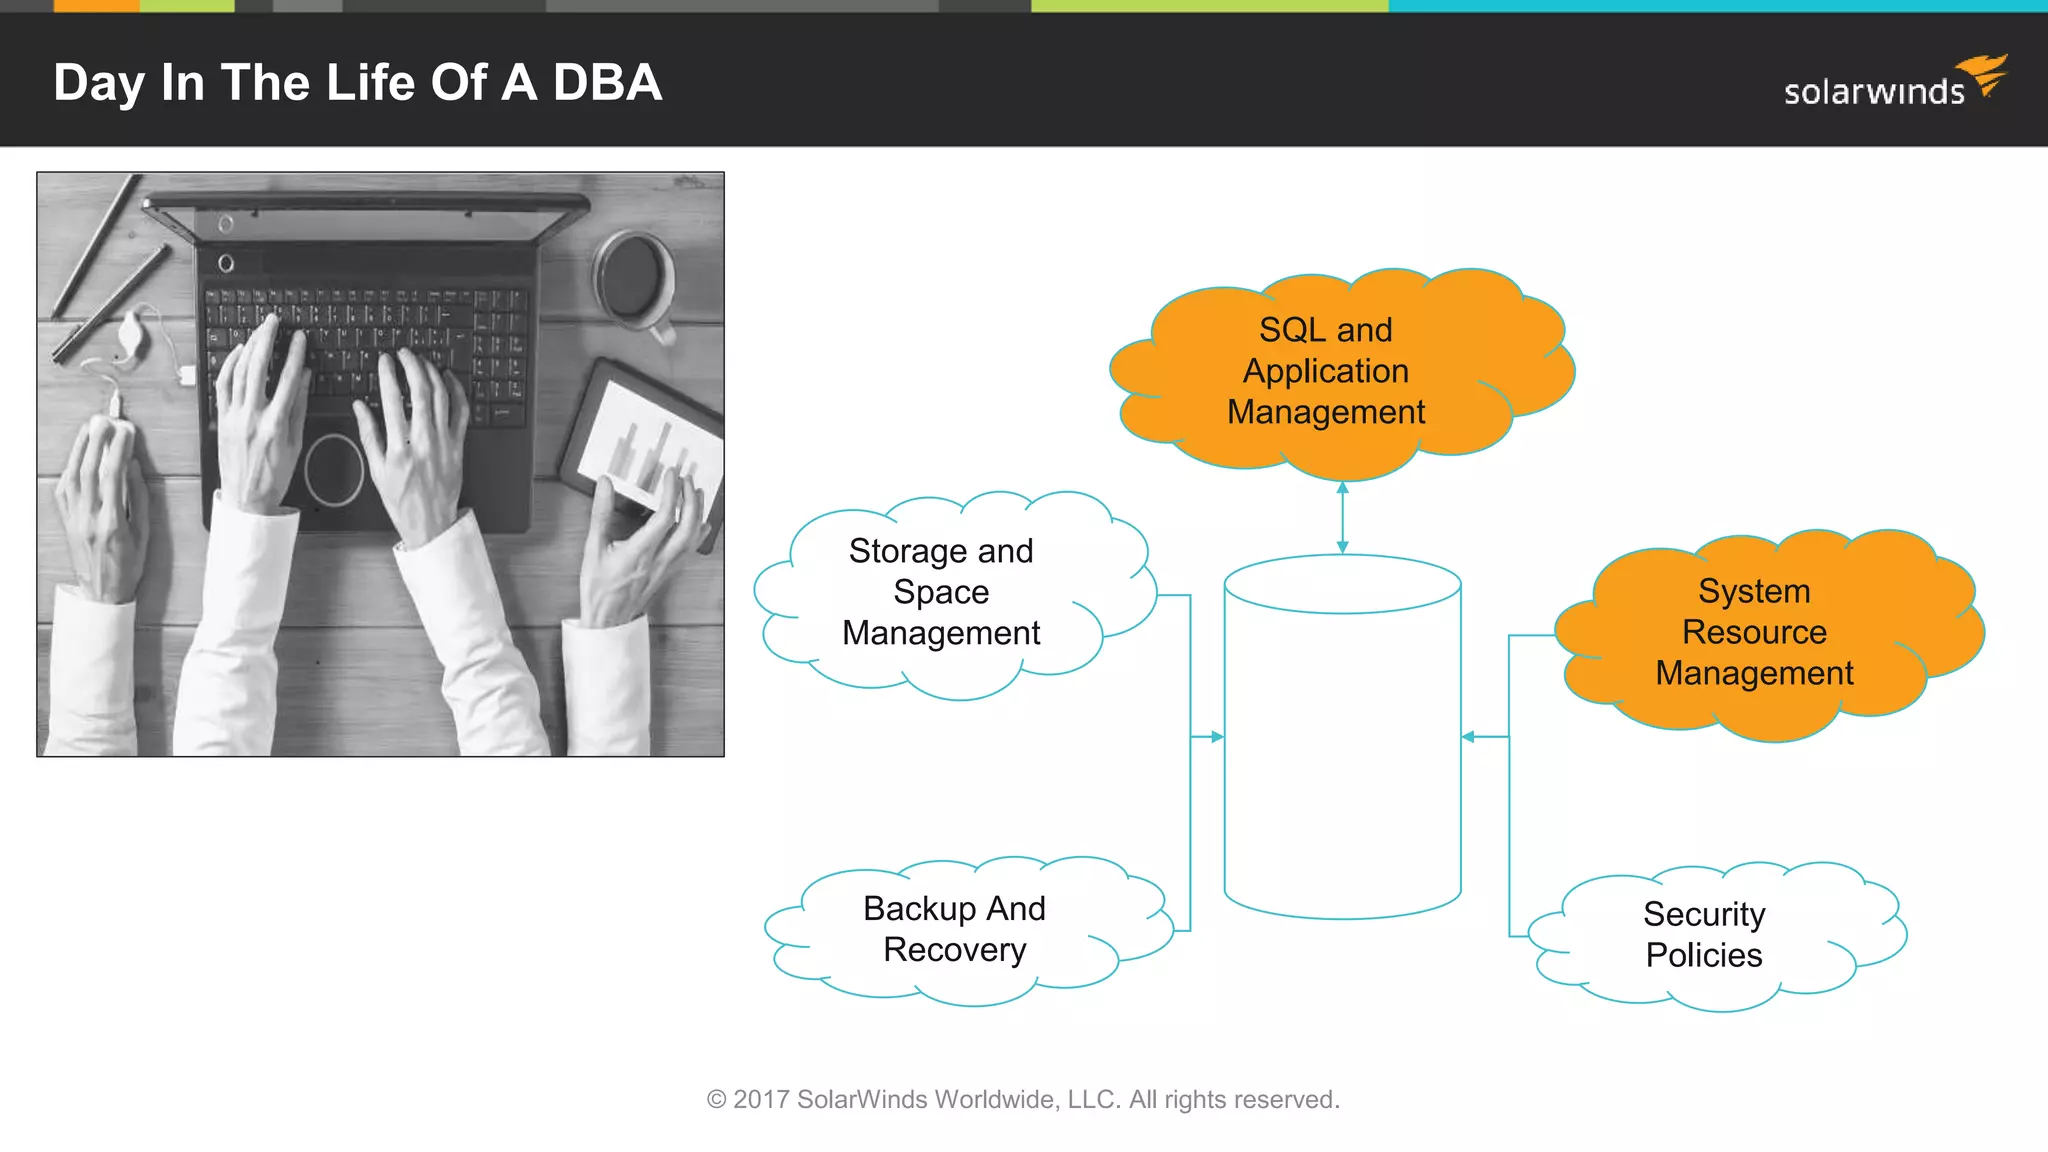
Overview of a DBA's daily tasks including SQL management, storage, backup, recovery, security, and resource management.
Discussion on conventional tools measuring health over performance and the need for specialized tools to find performance issues effectively.
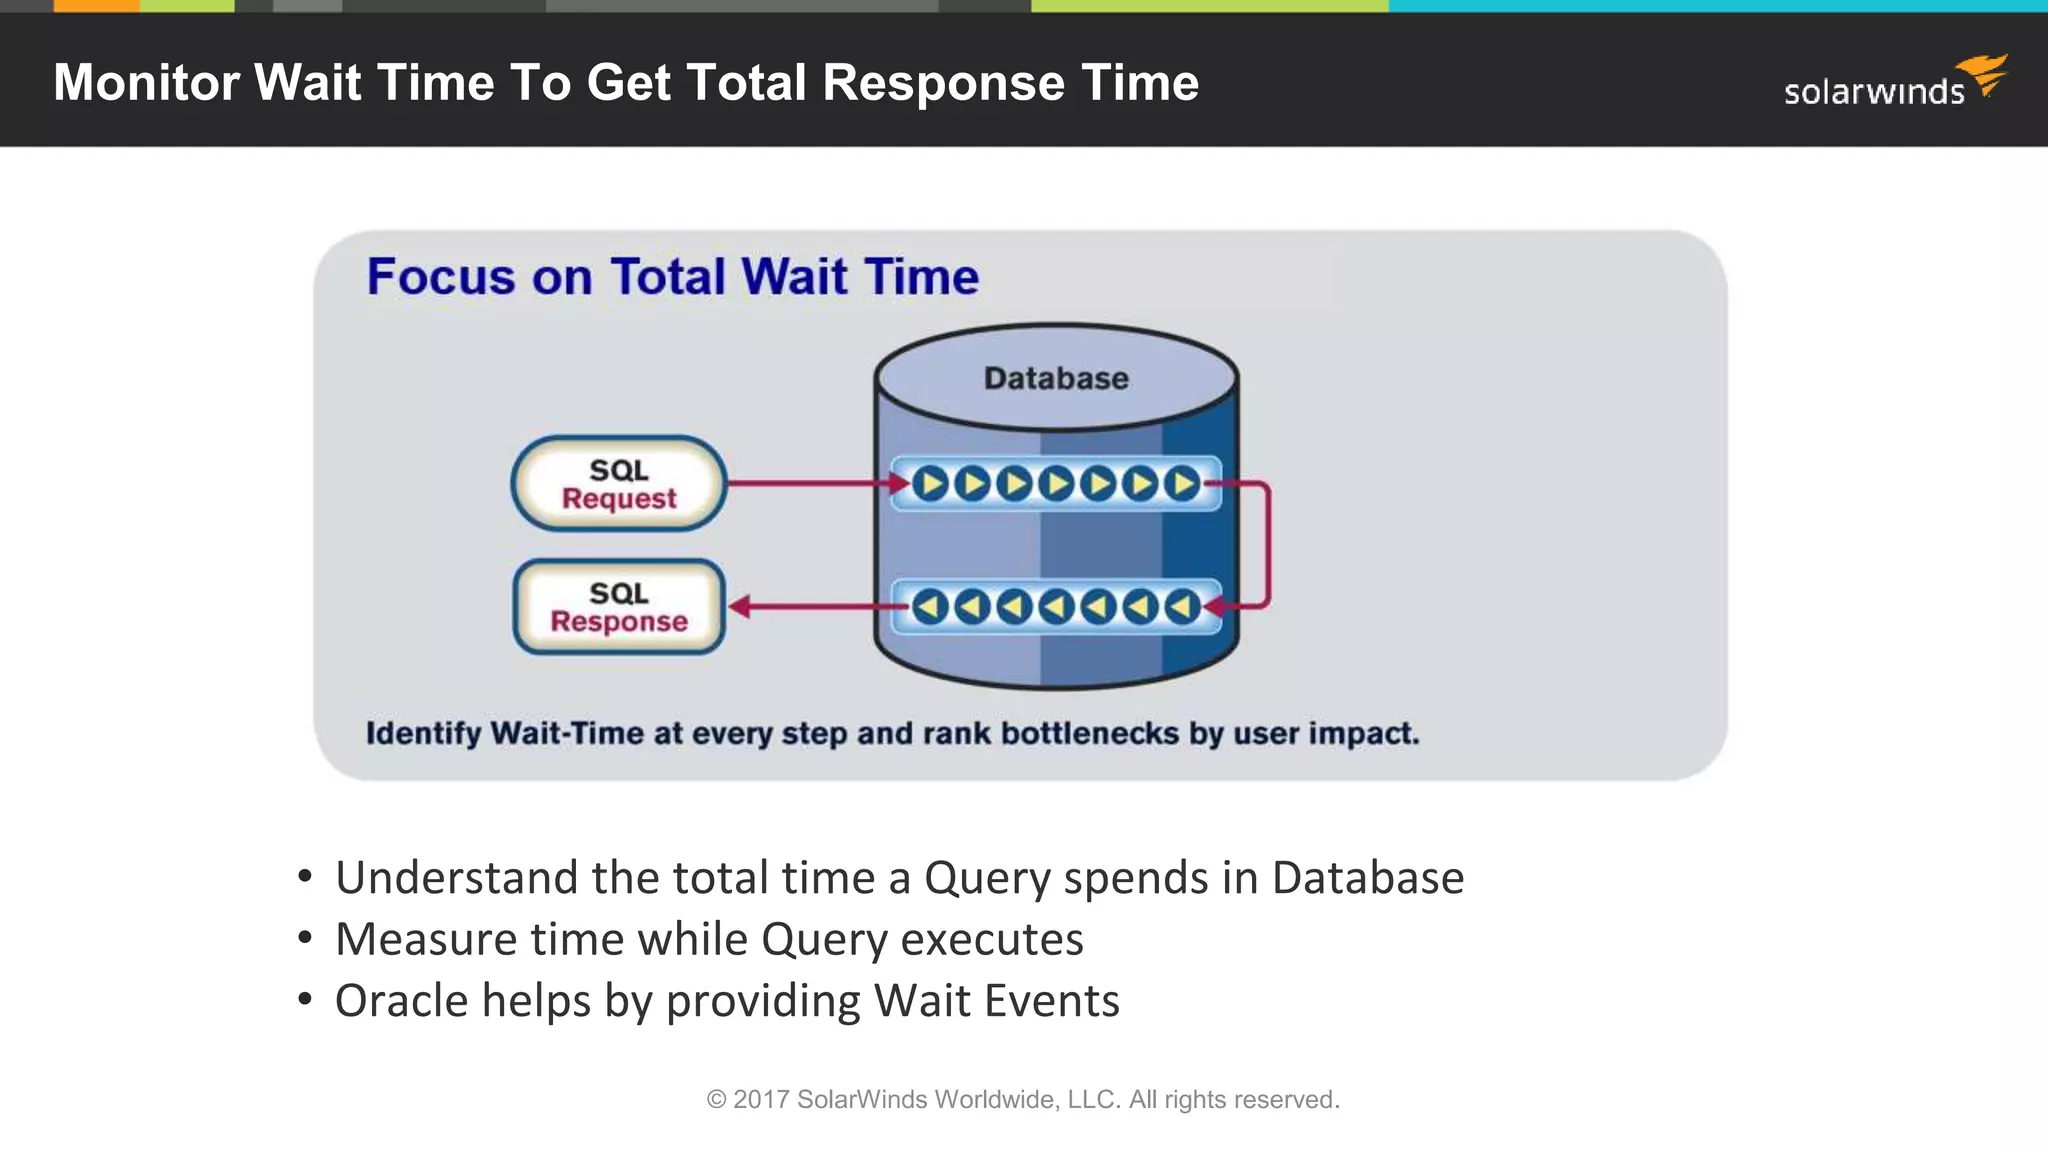
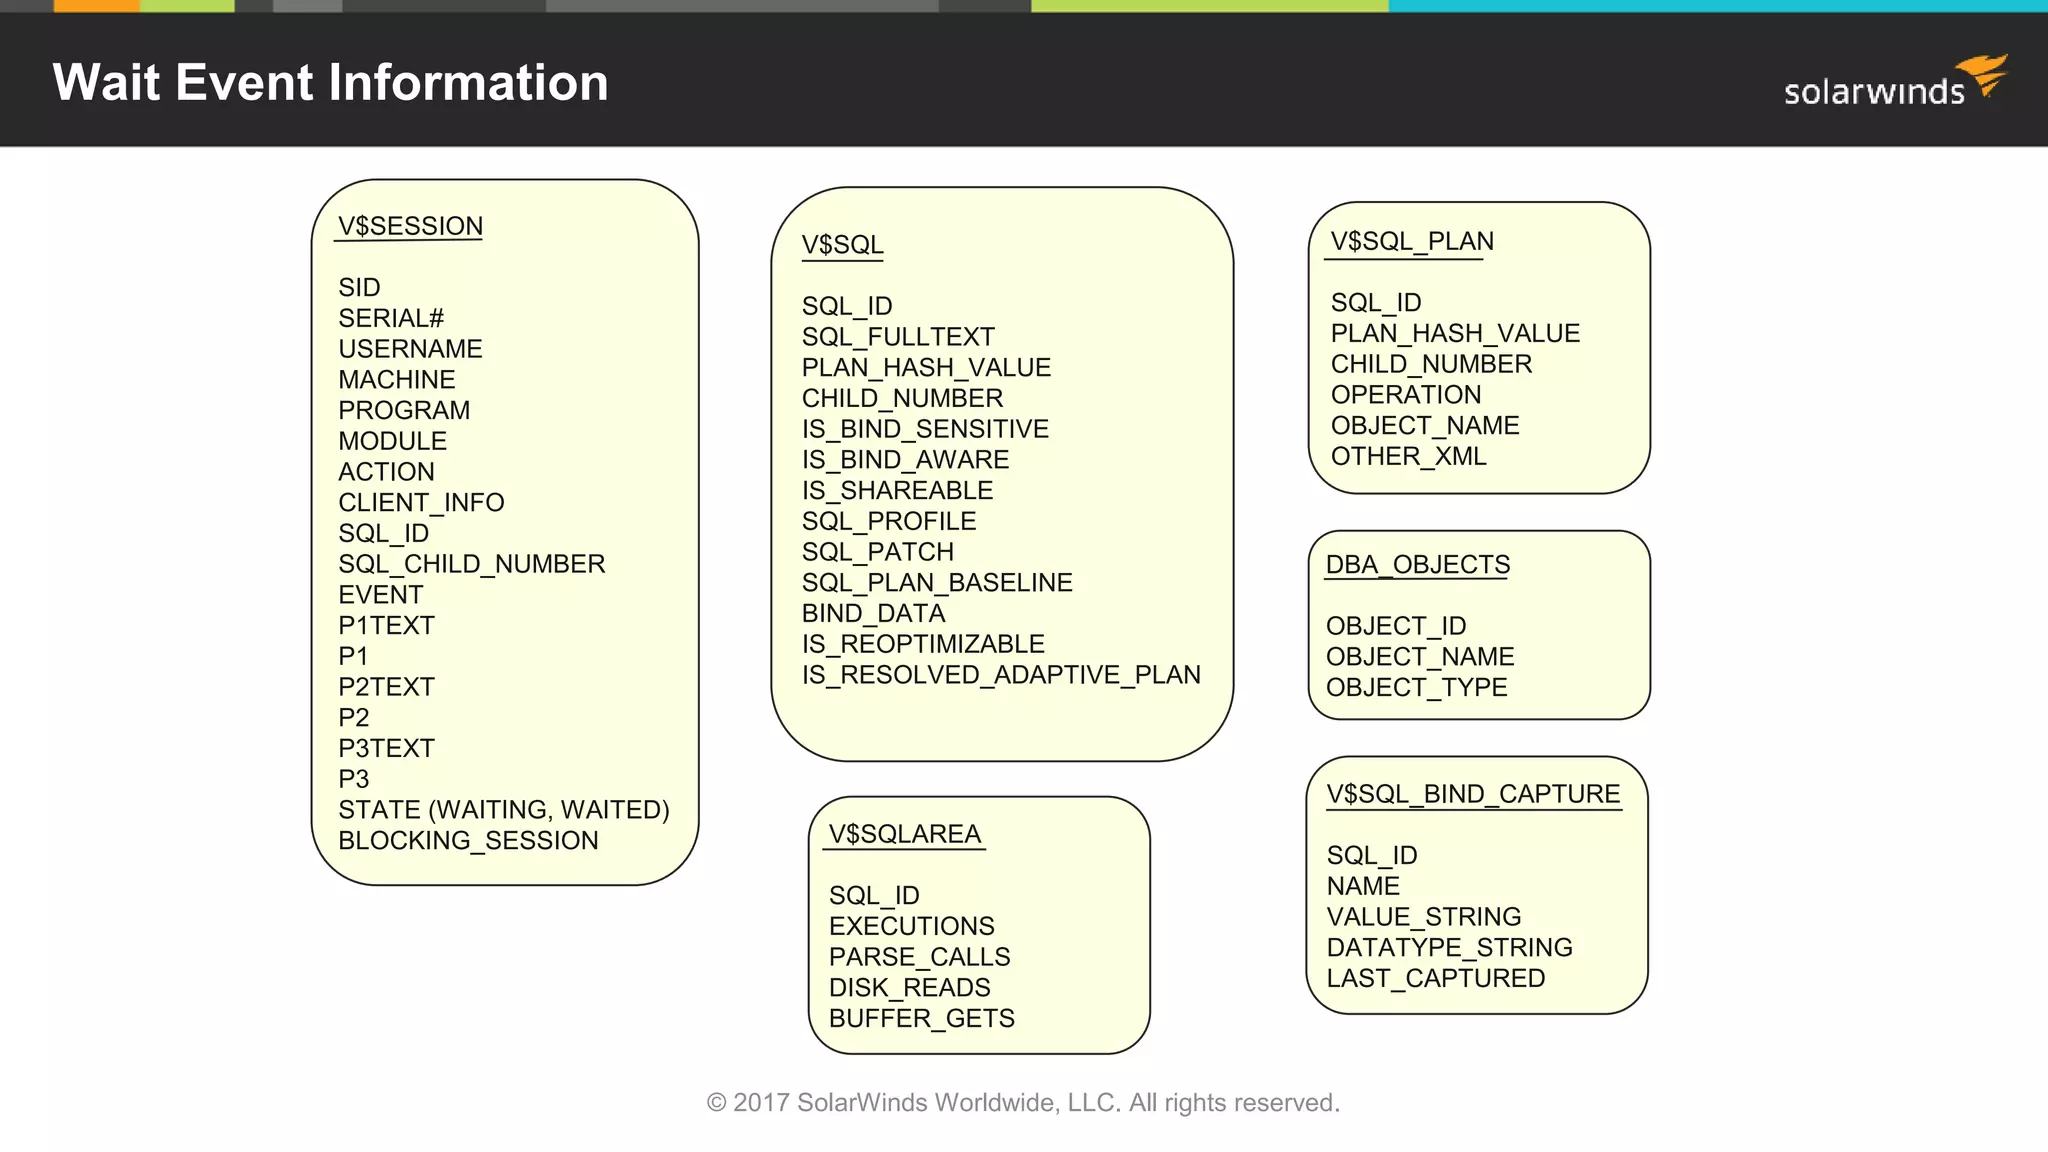
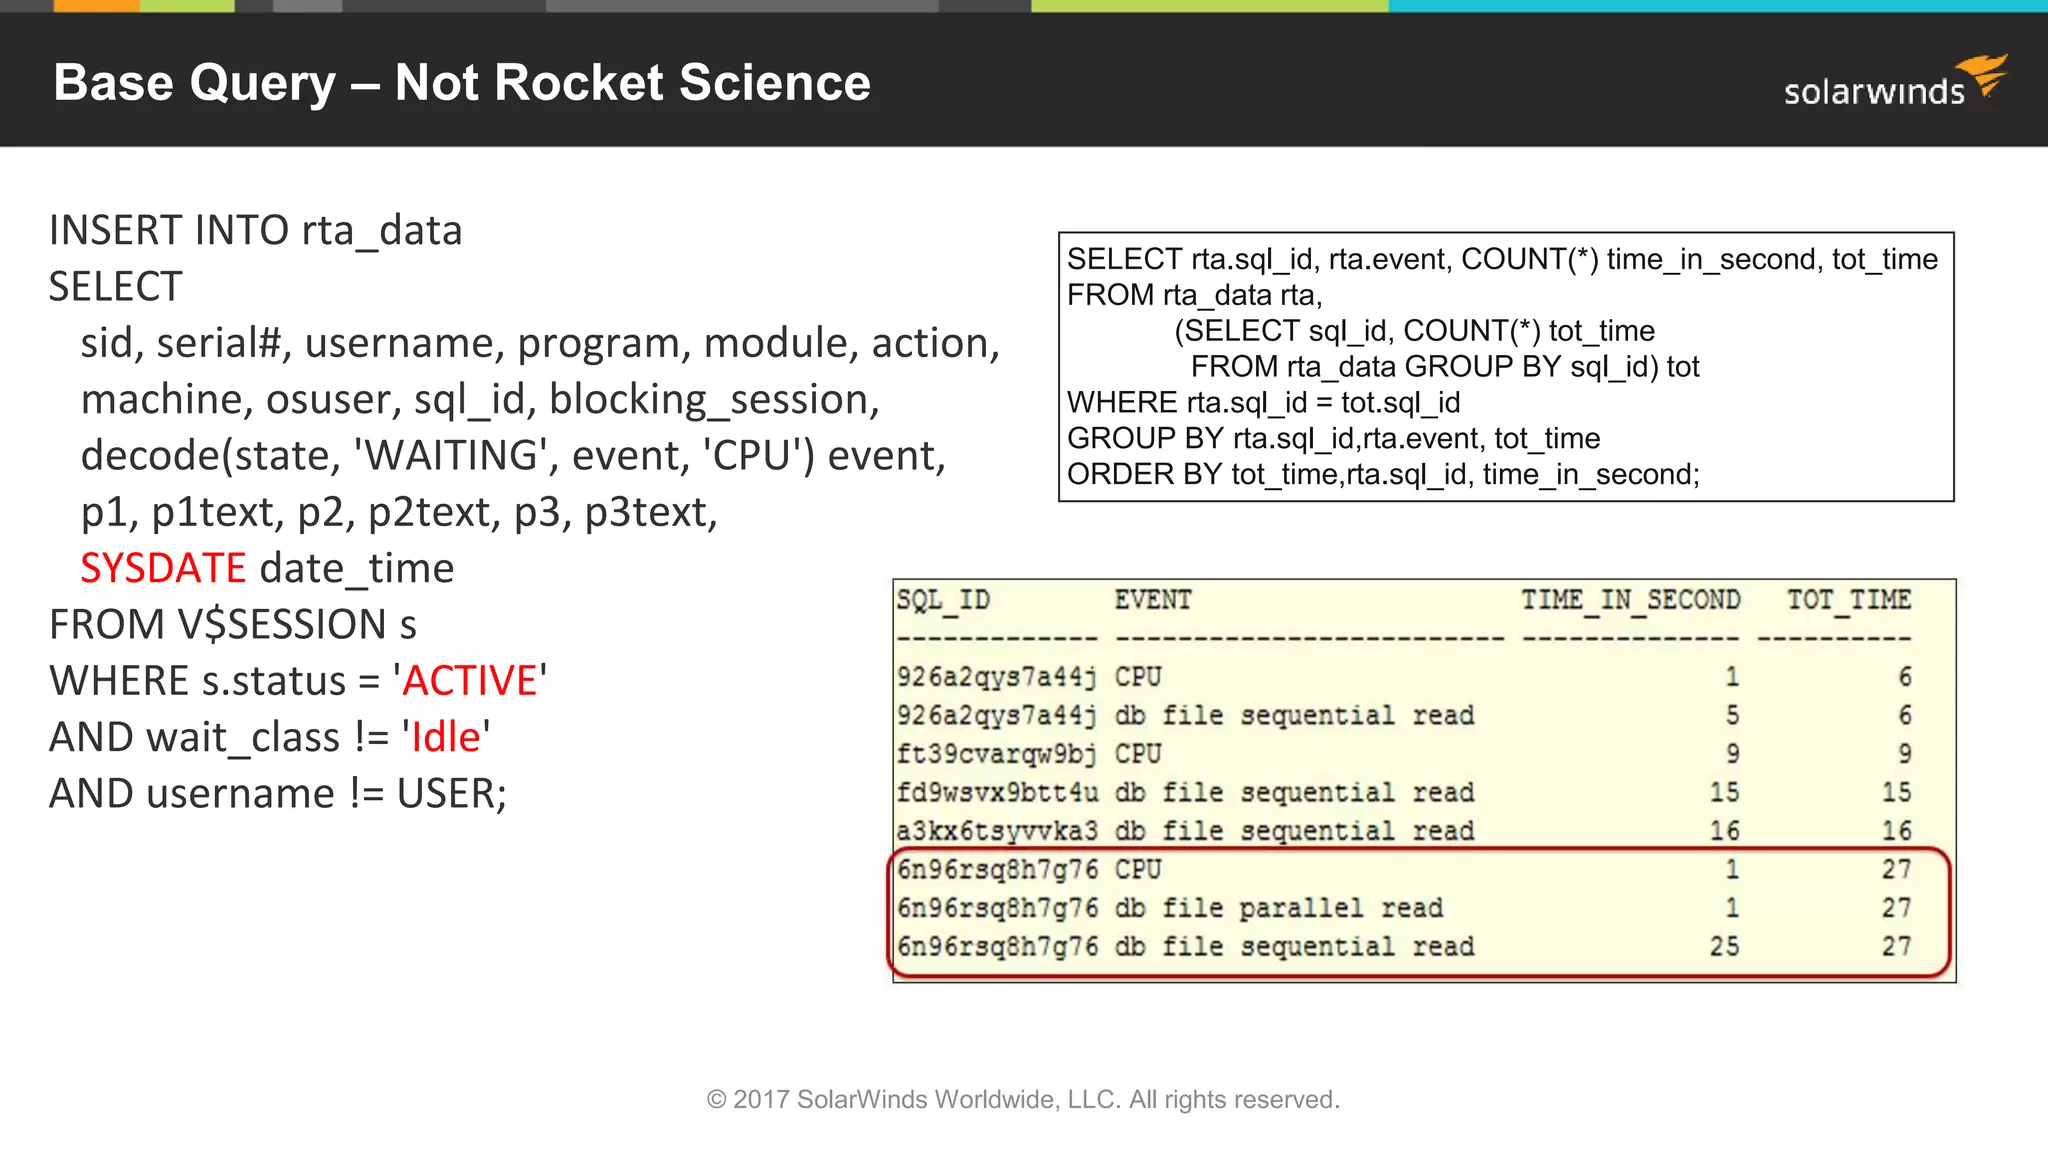
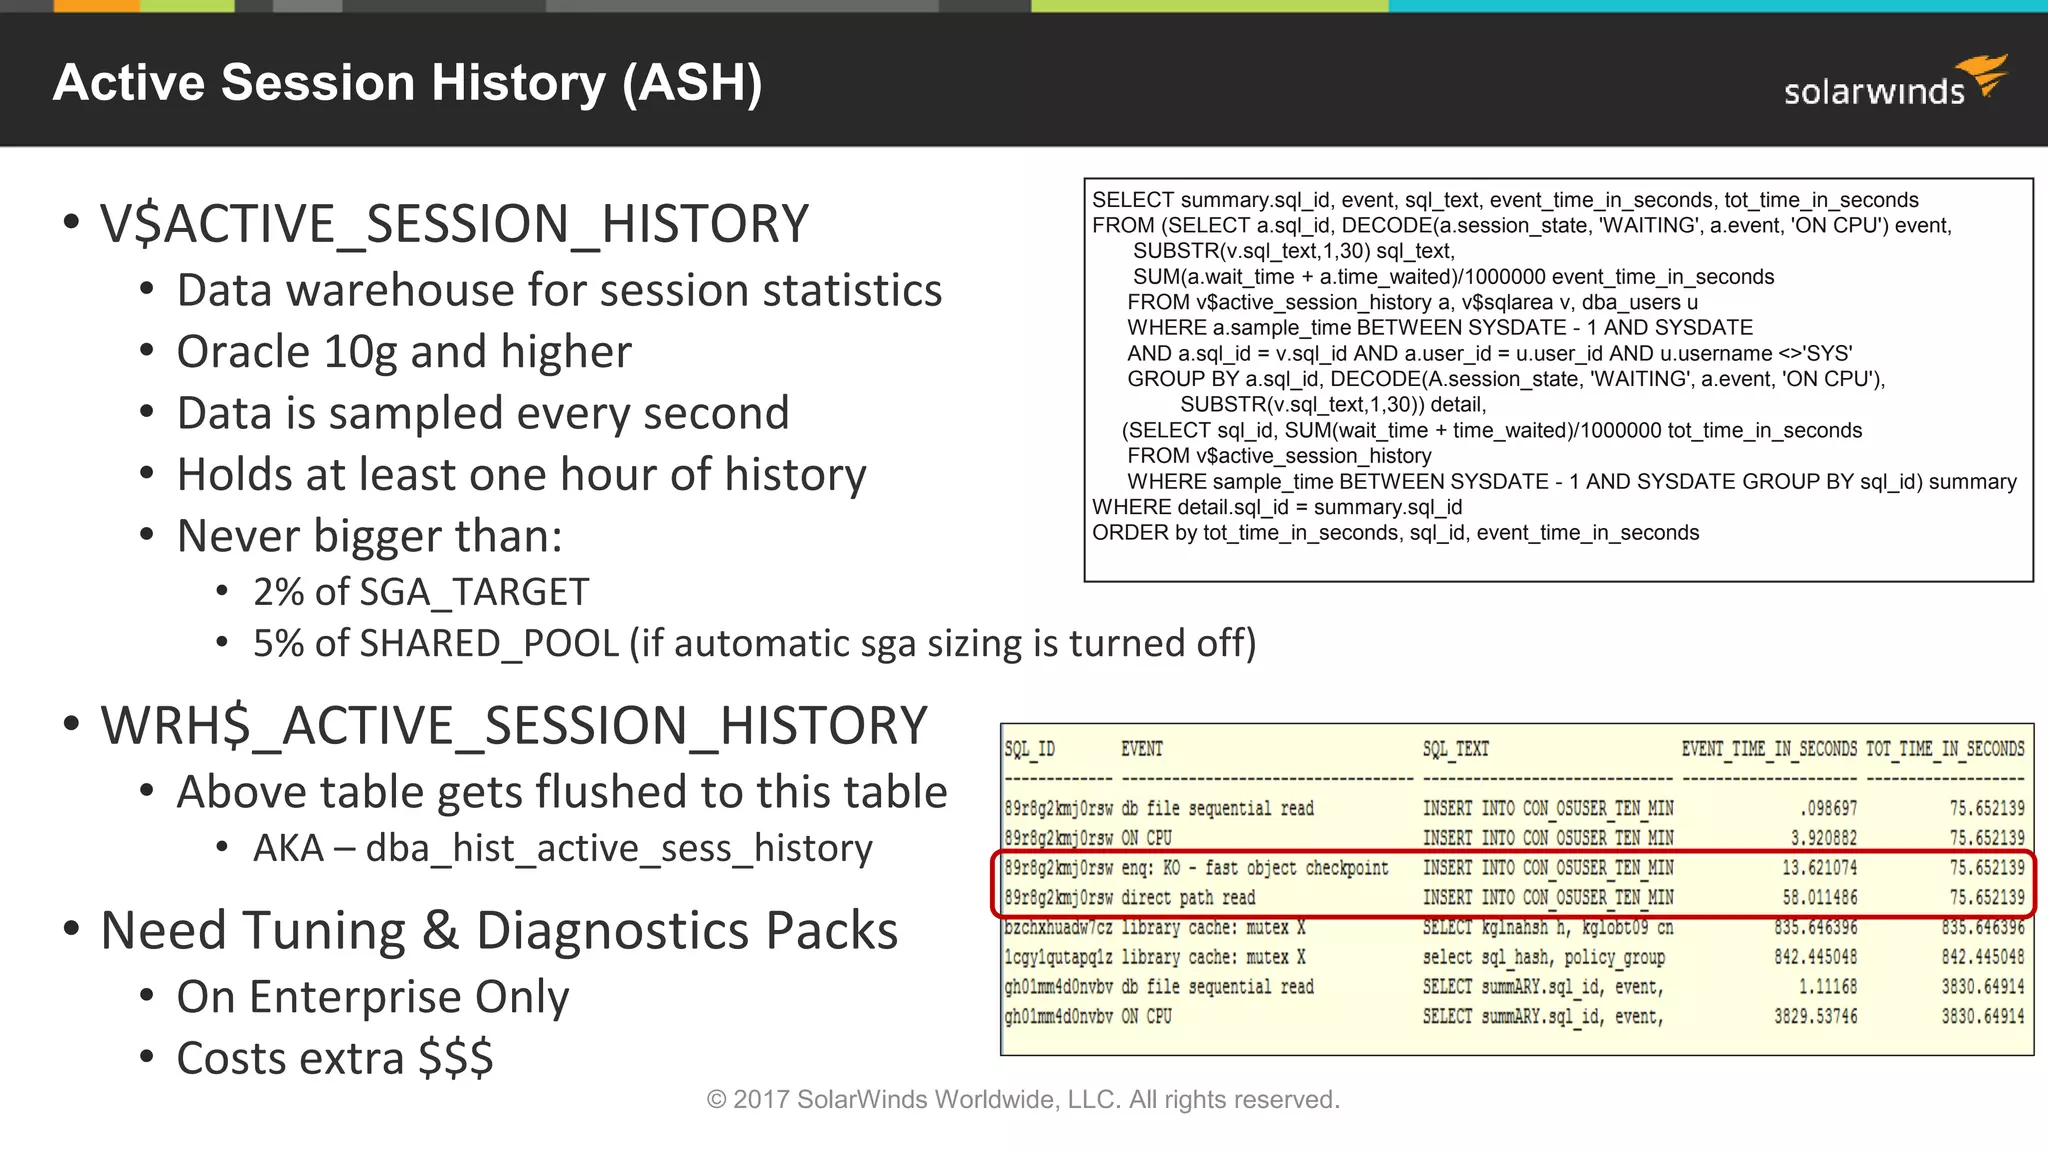
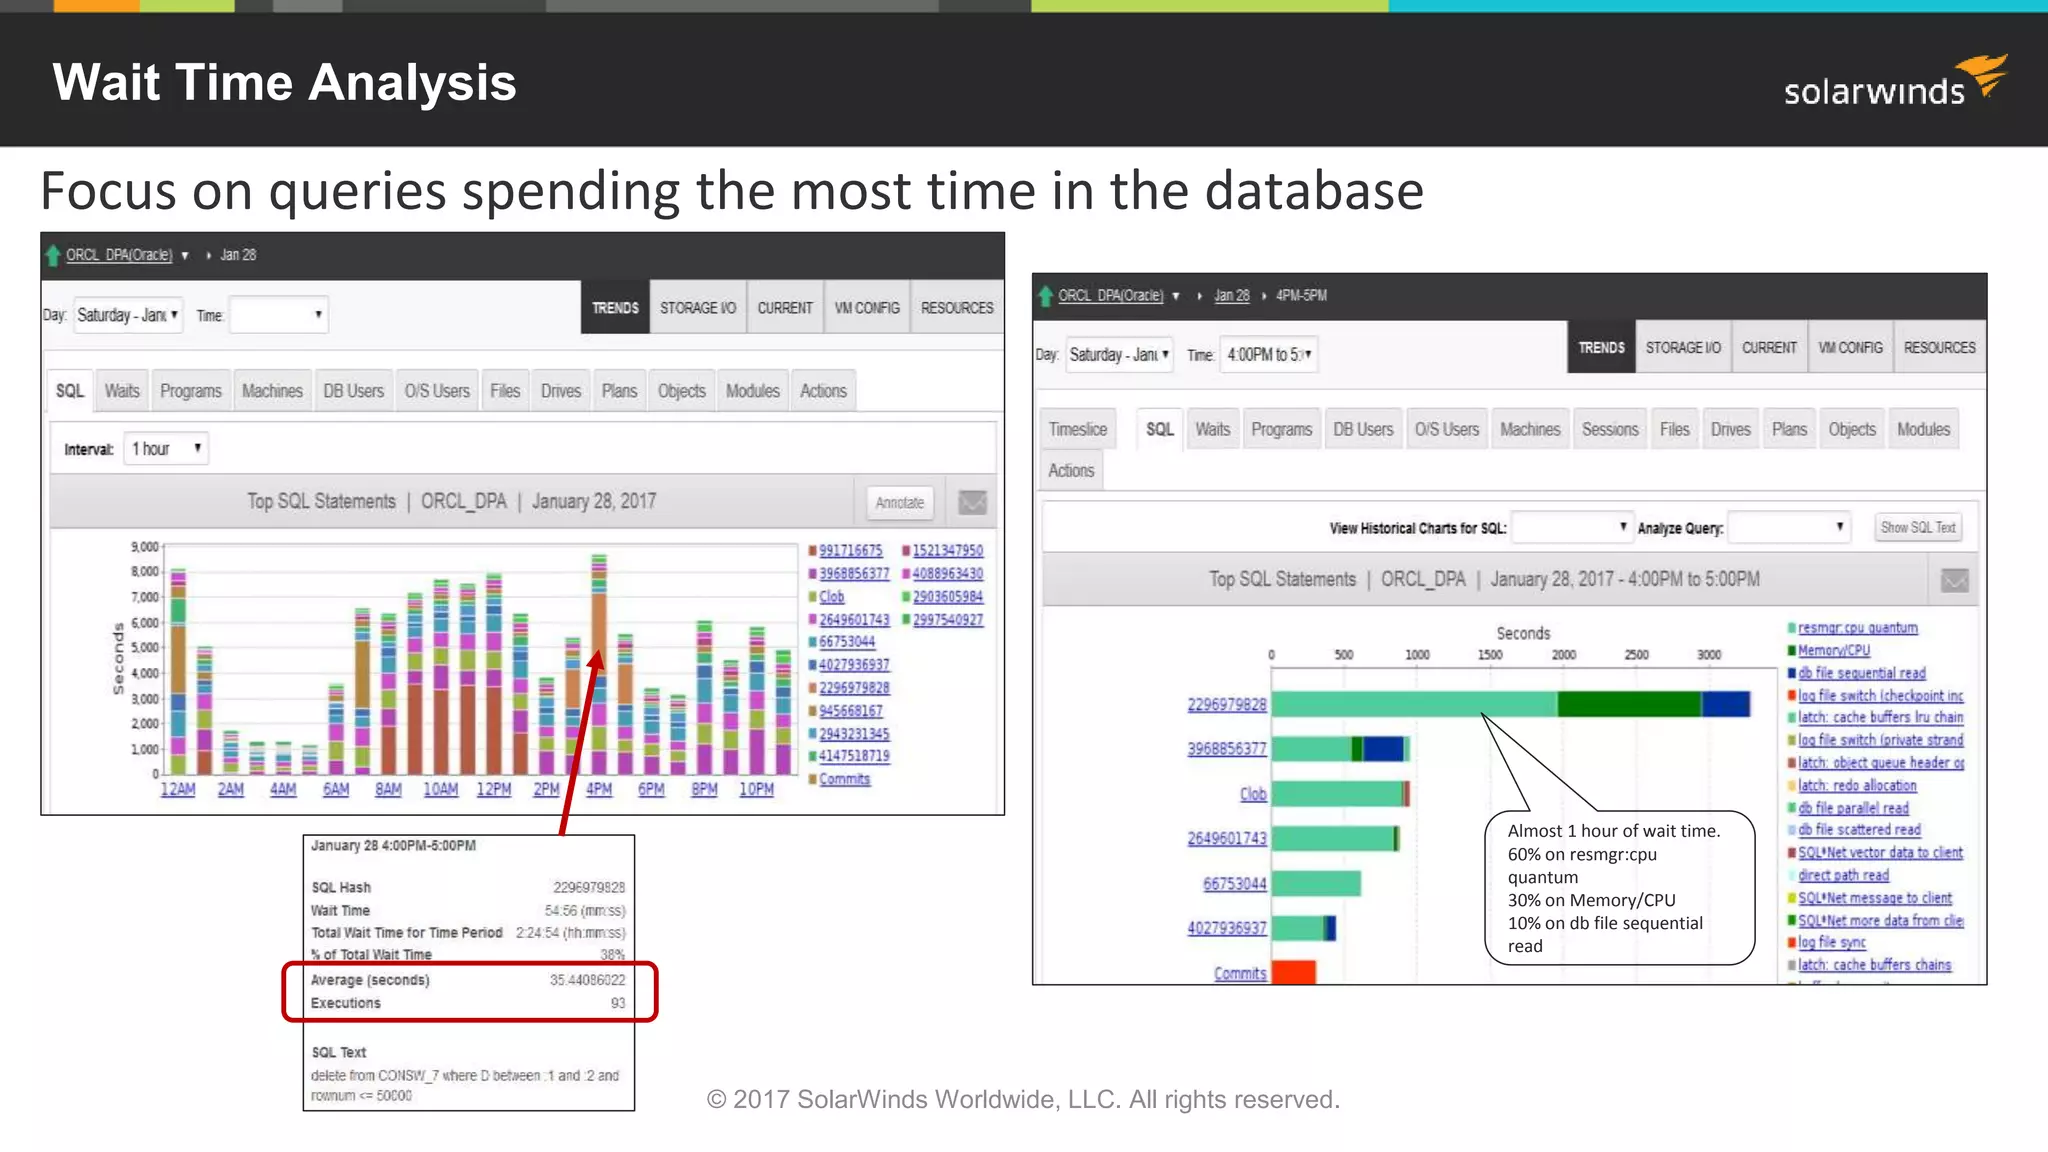
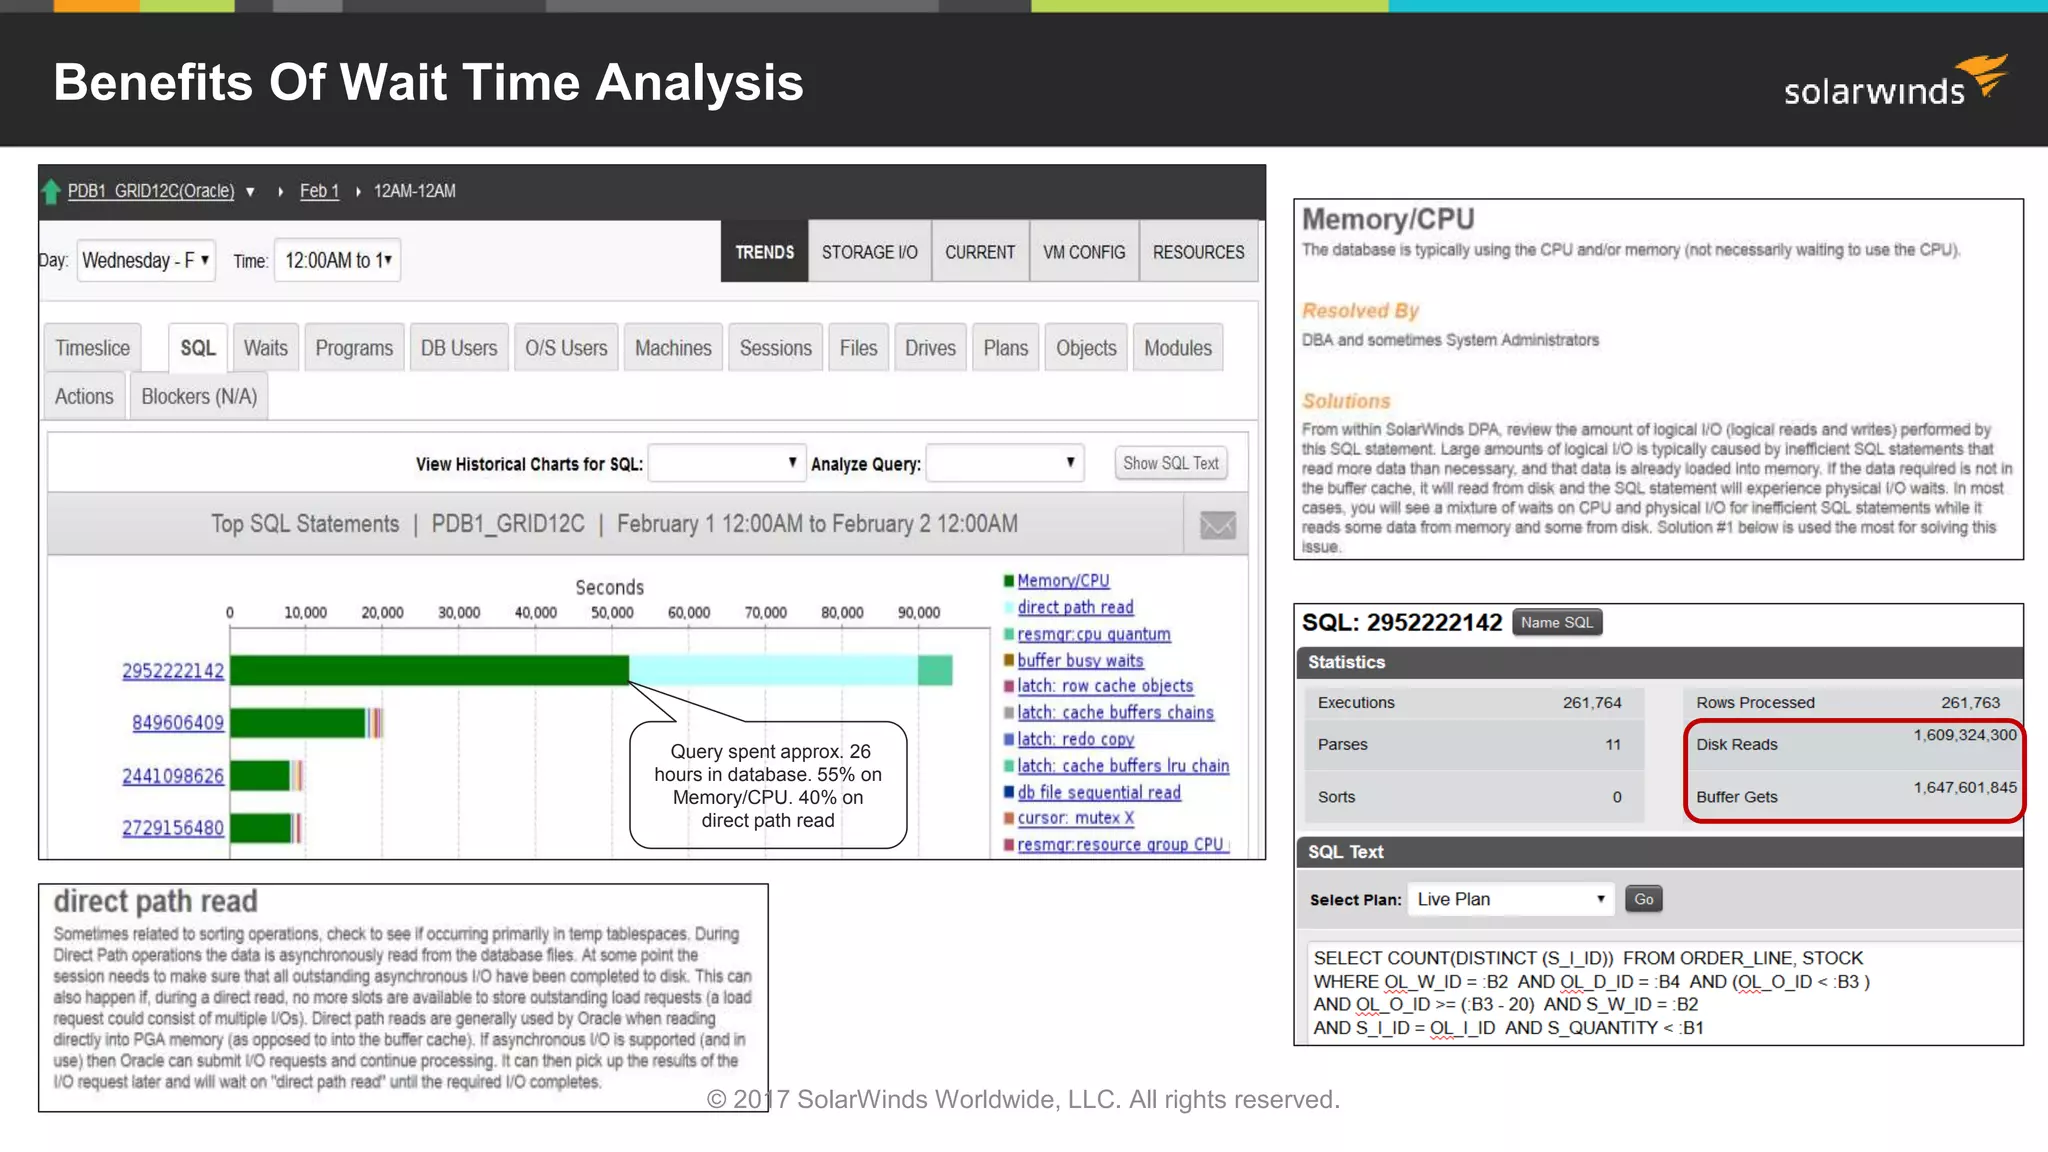
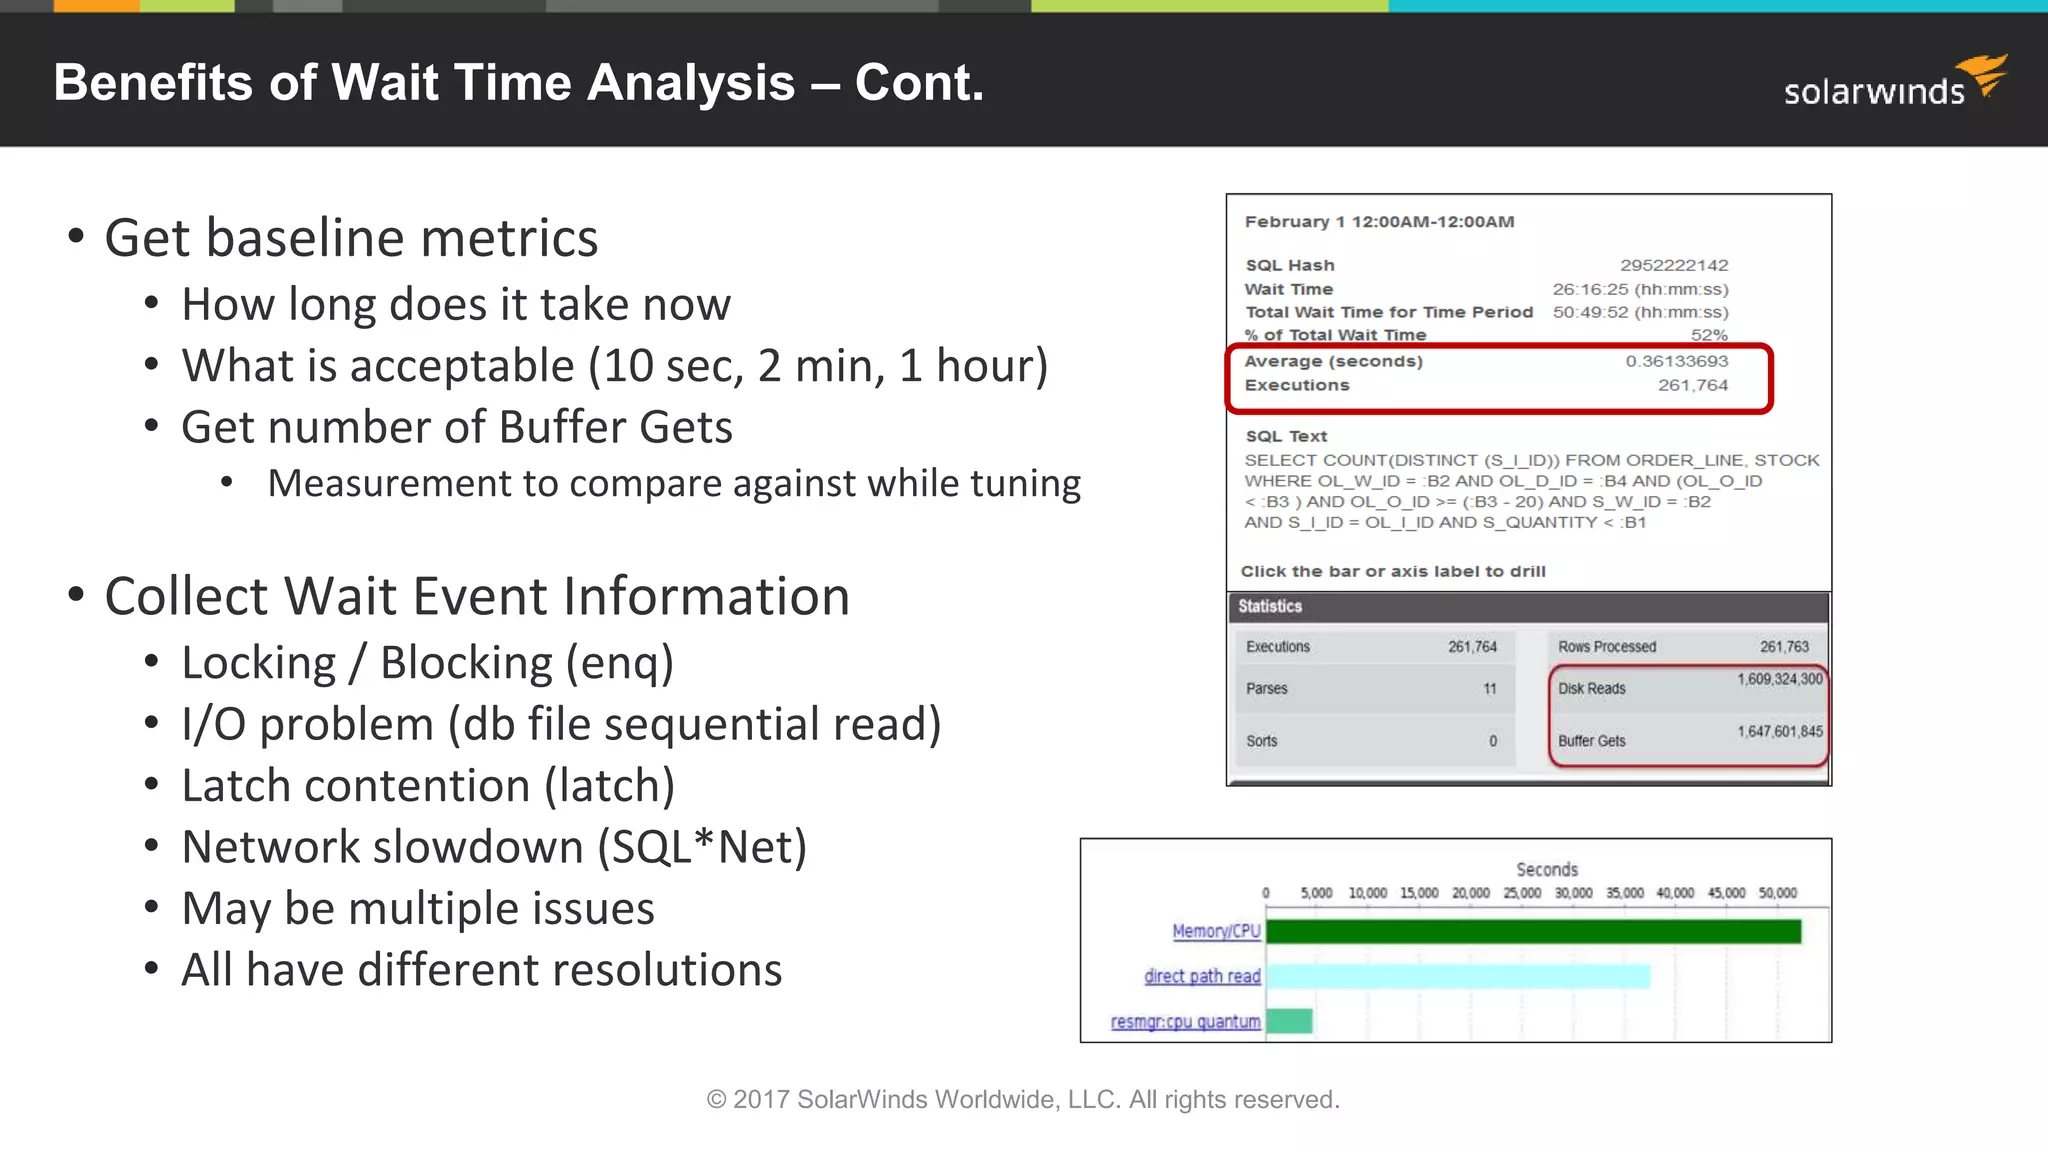
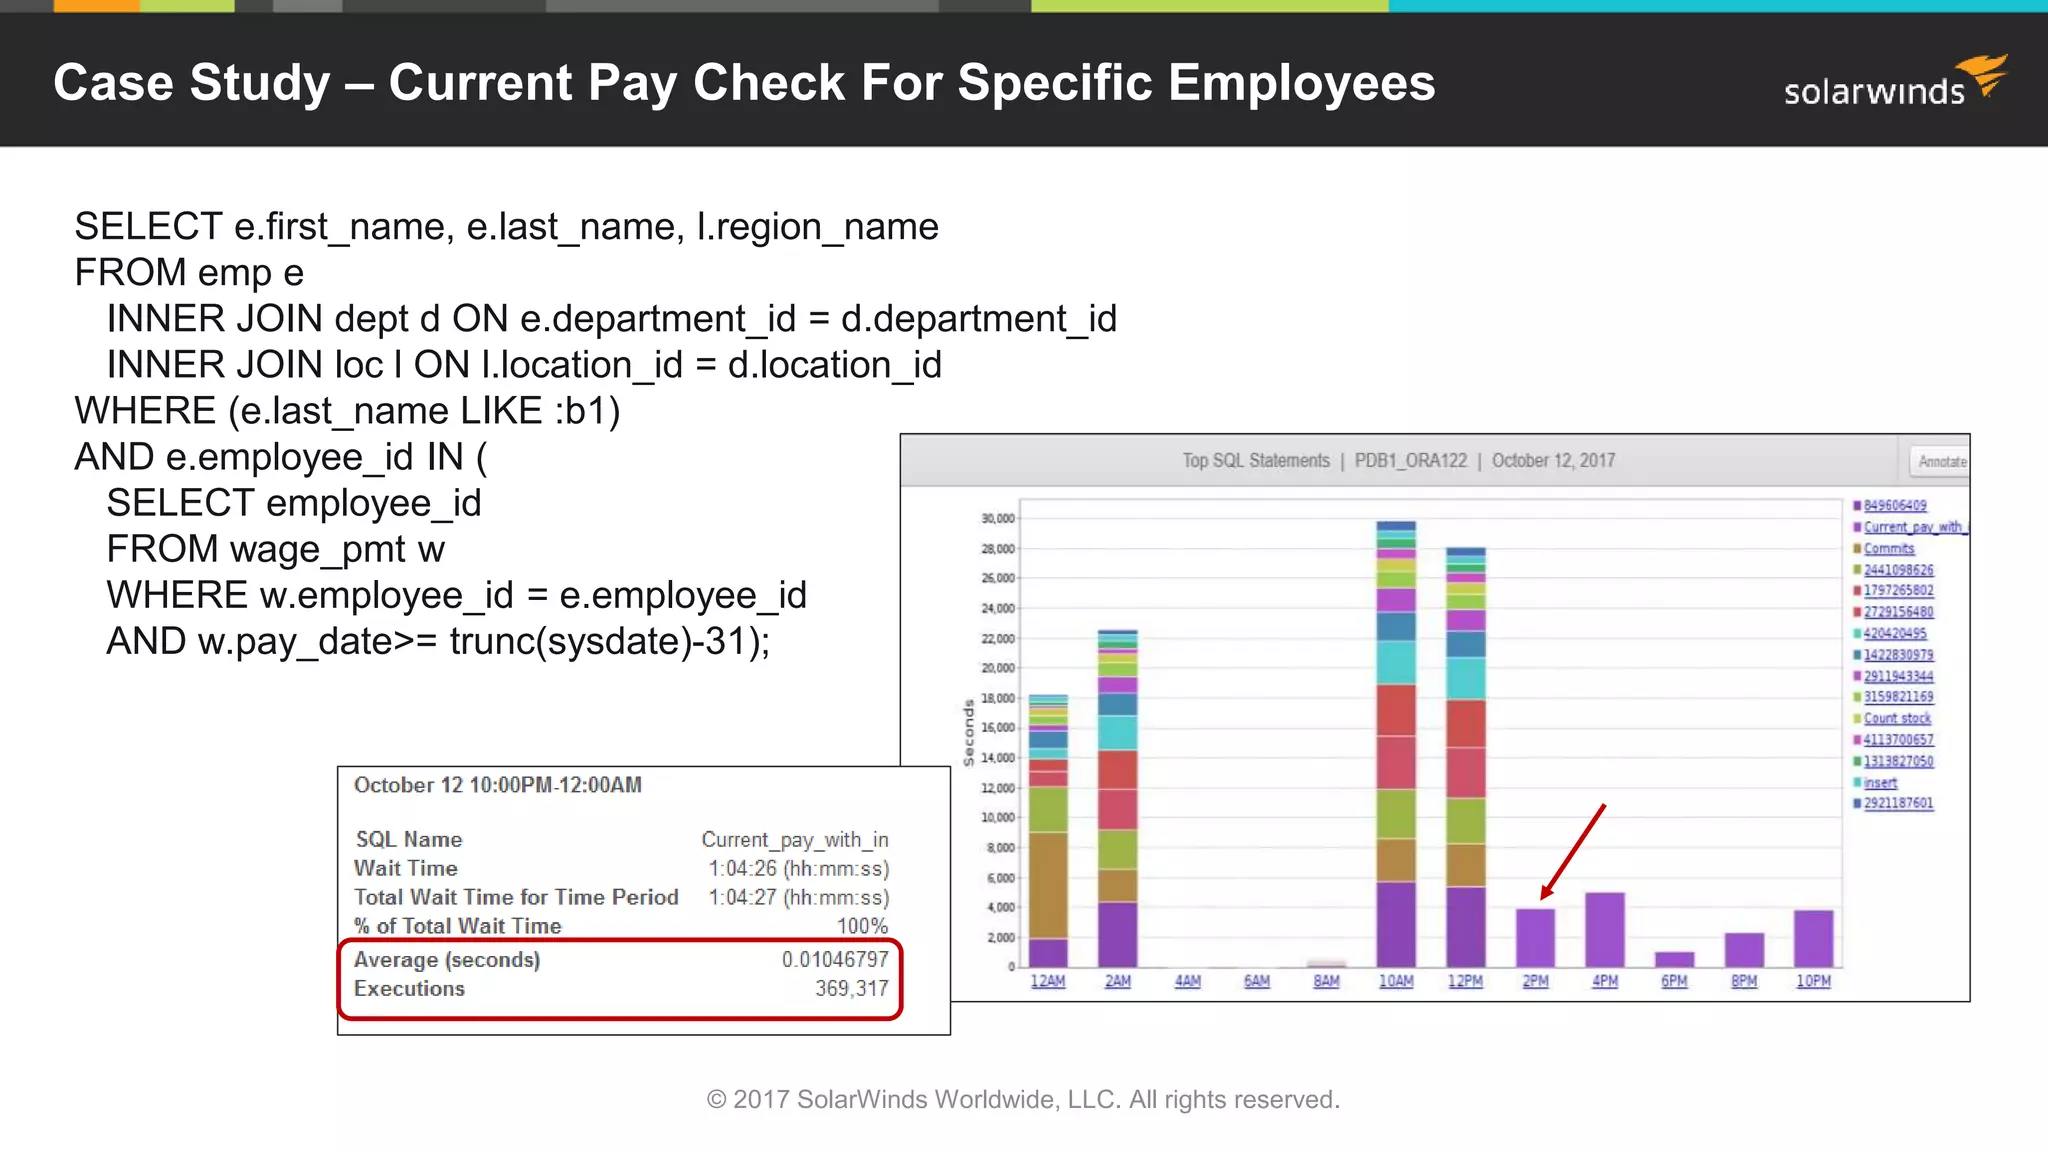
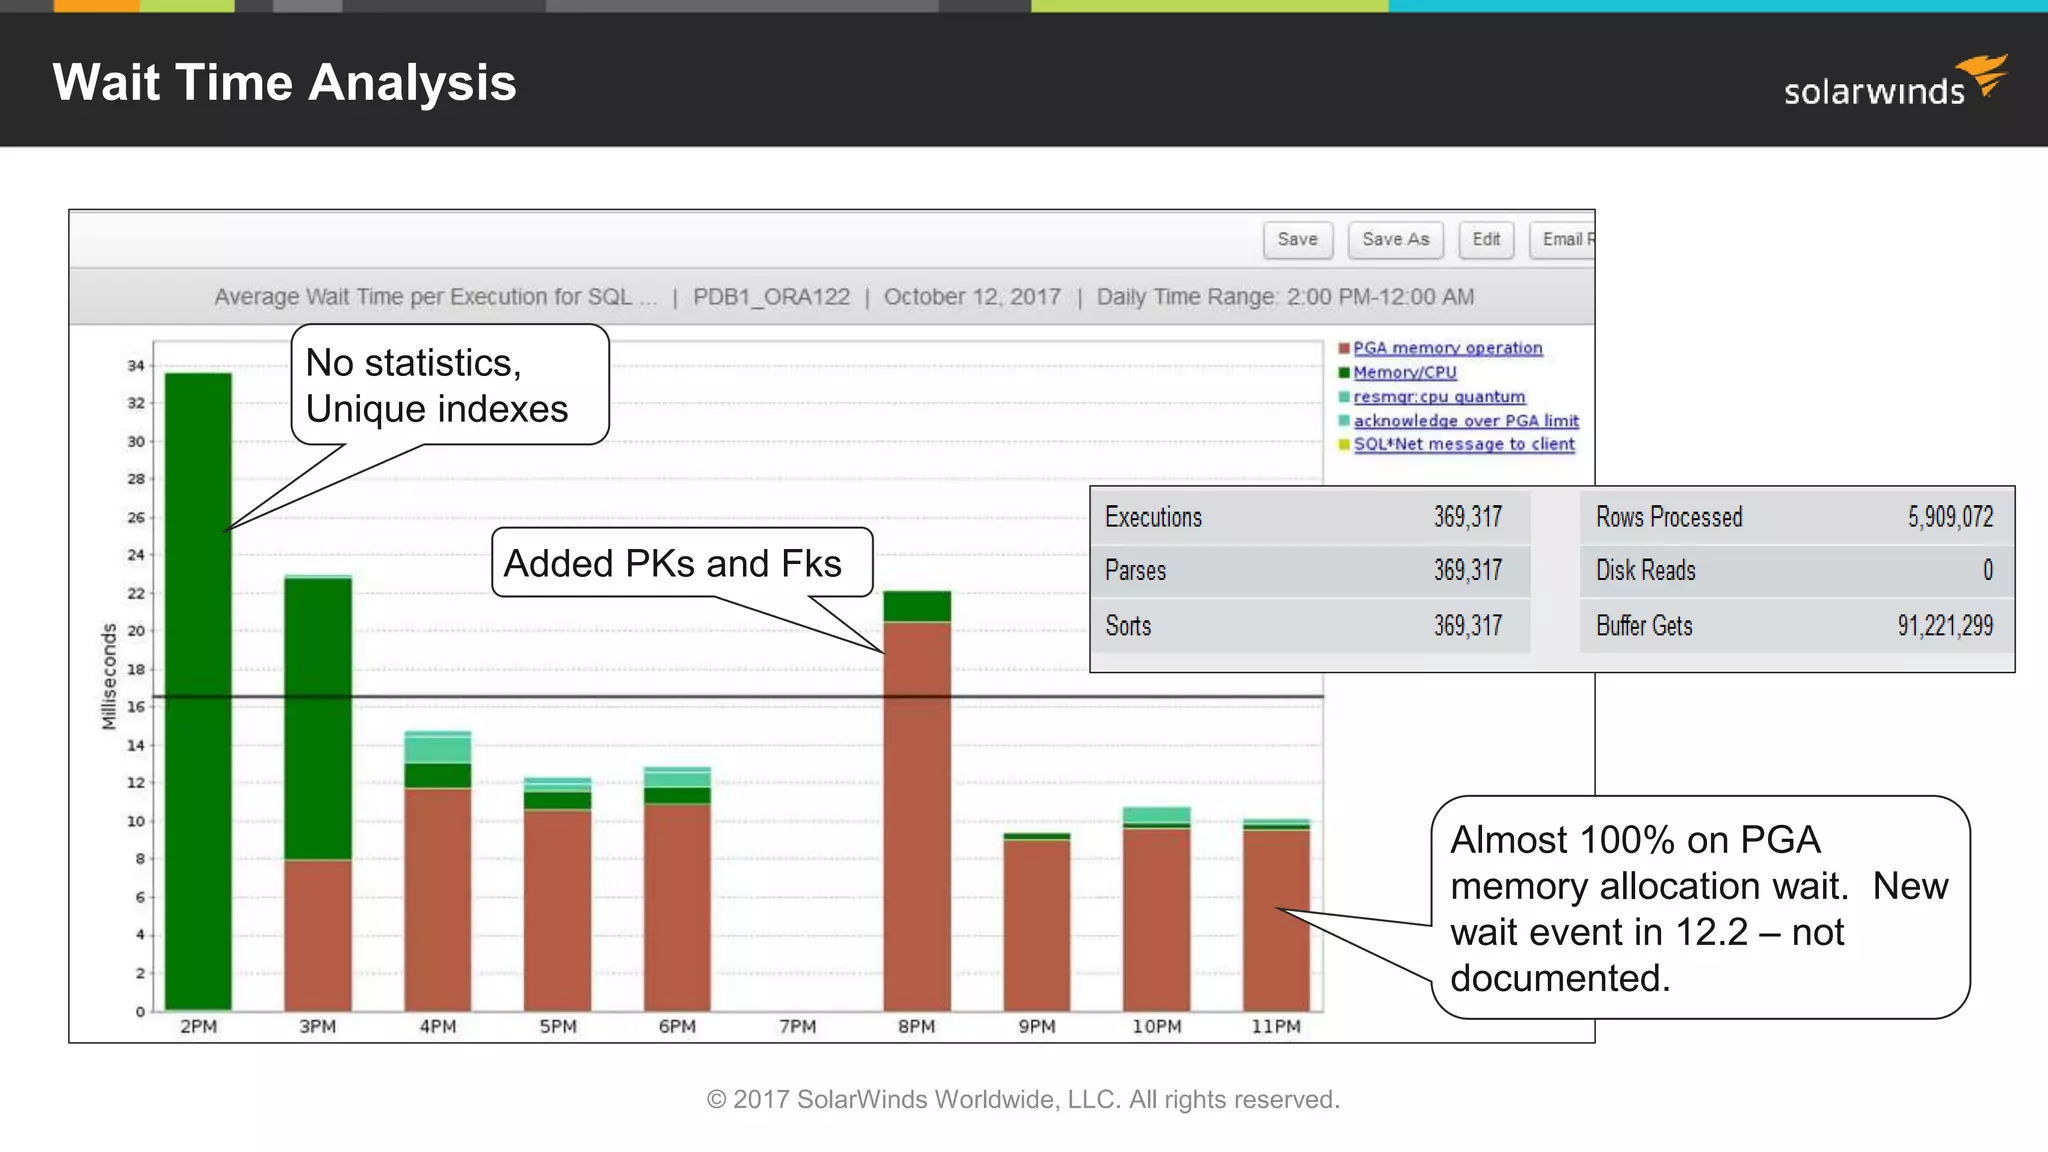
Focus on monitoring wait times to assess total response times and analyzing wait event information for performance tuning.
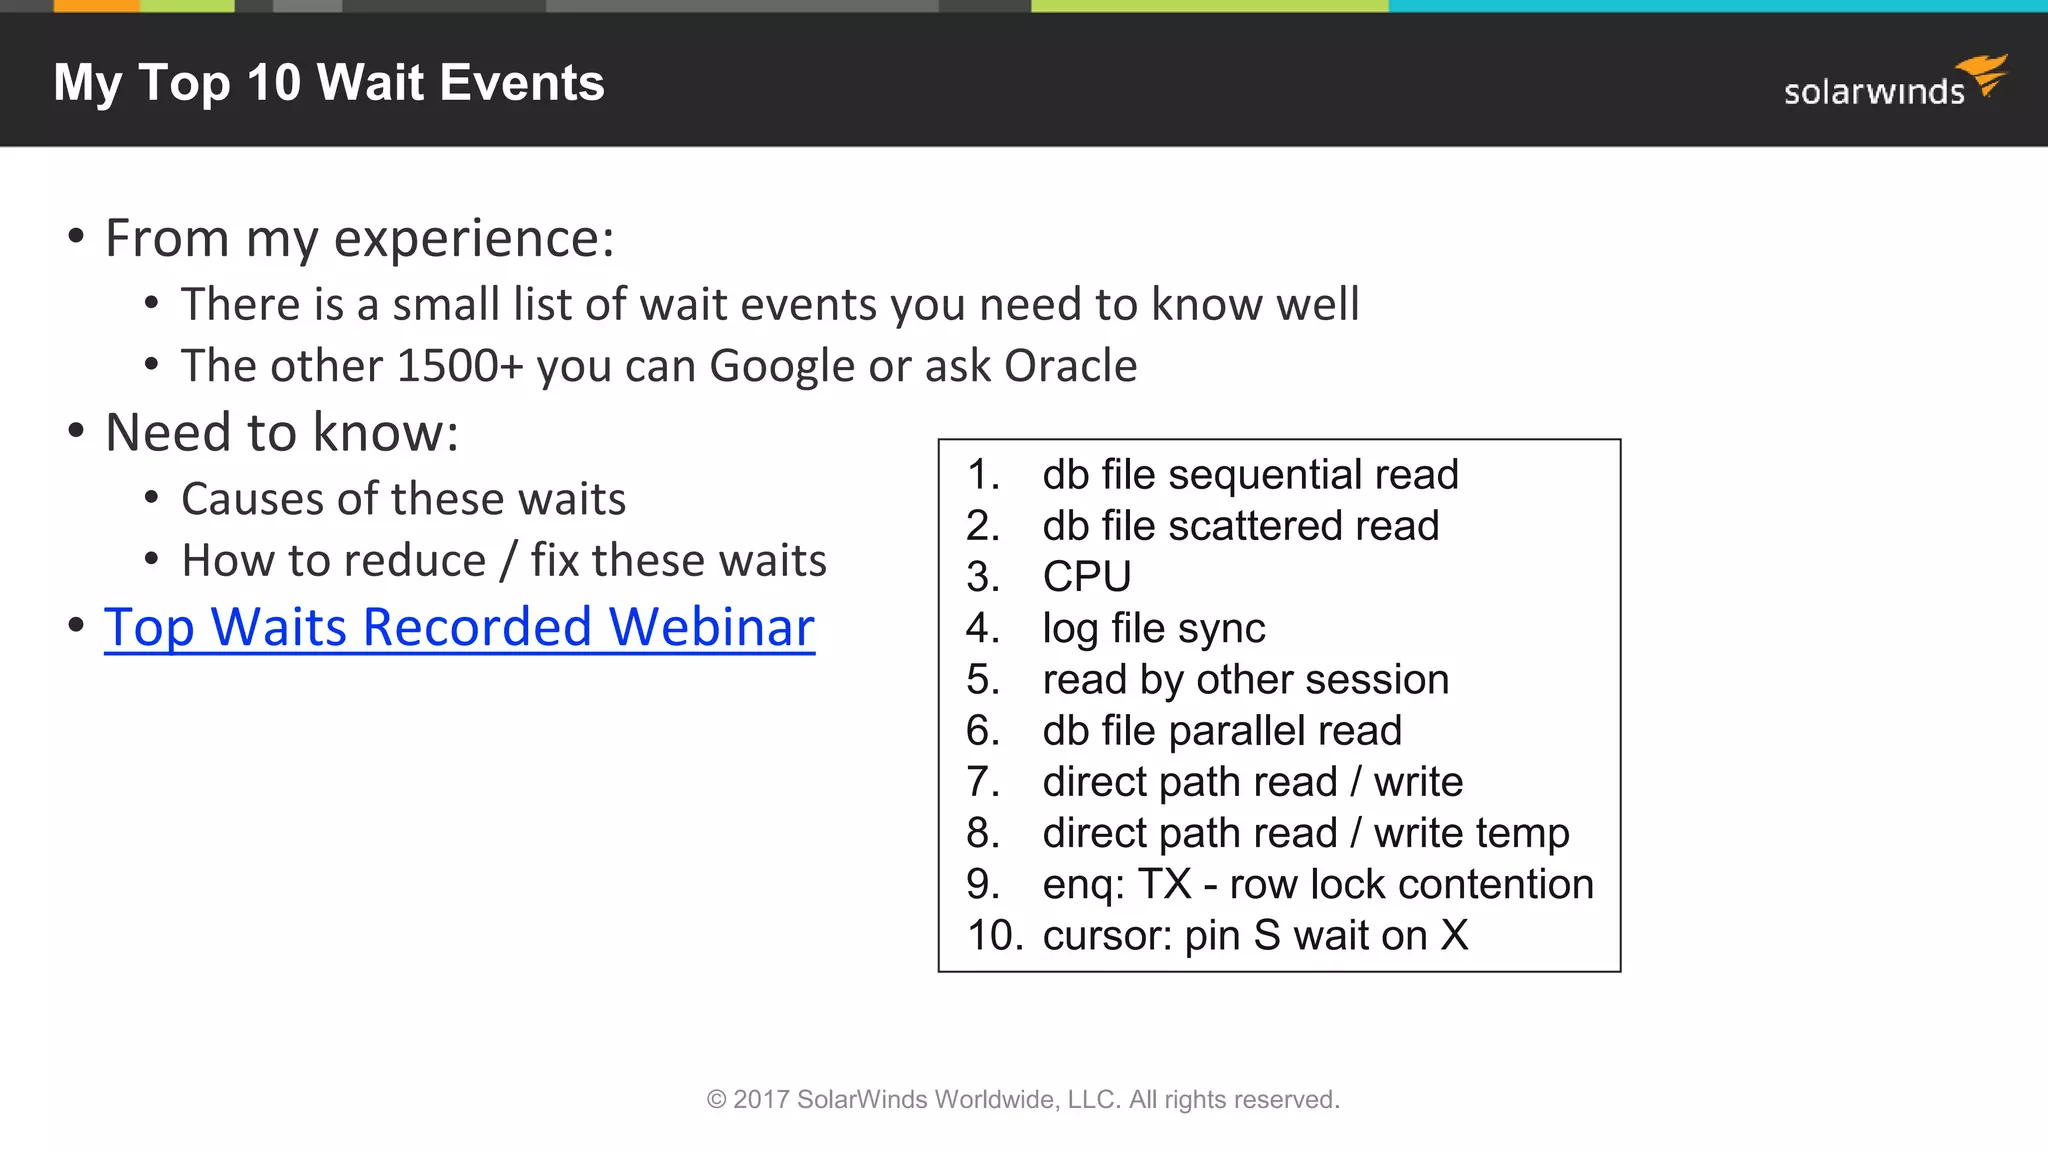
The importance of identifying top wait events, their causes, and the benefits of wait time analysis for improving performance.
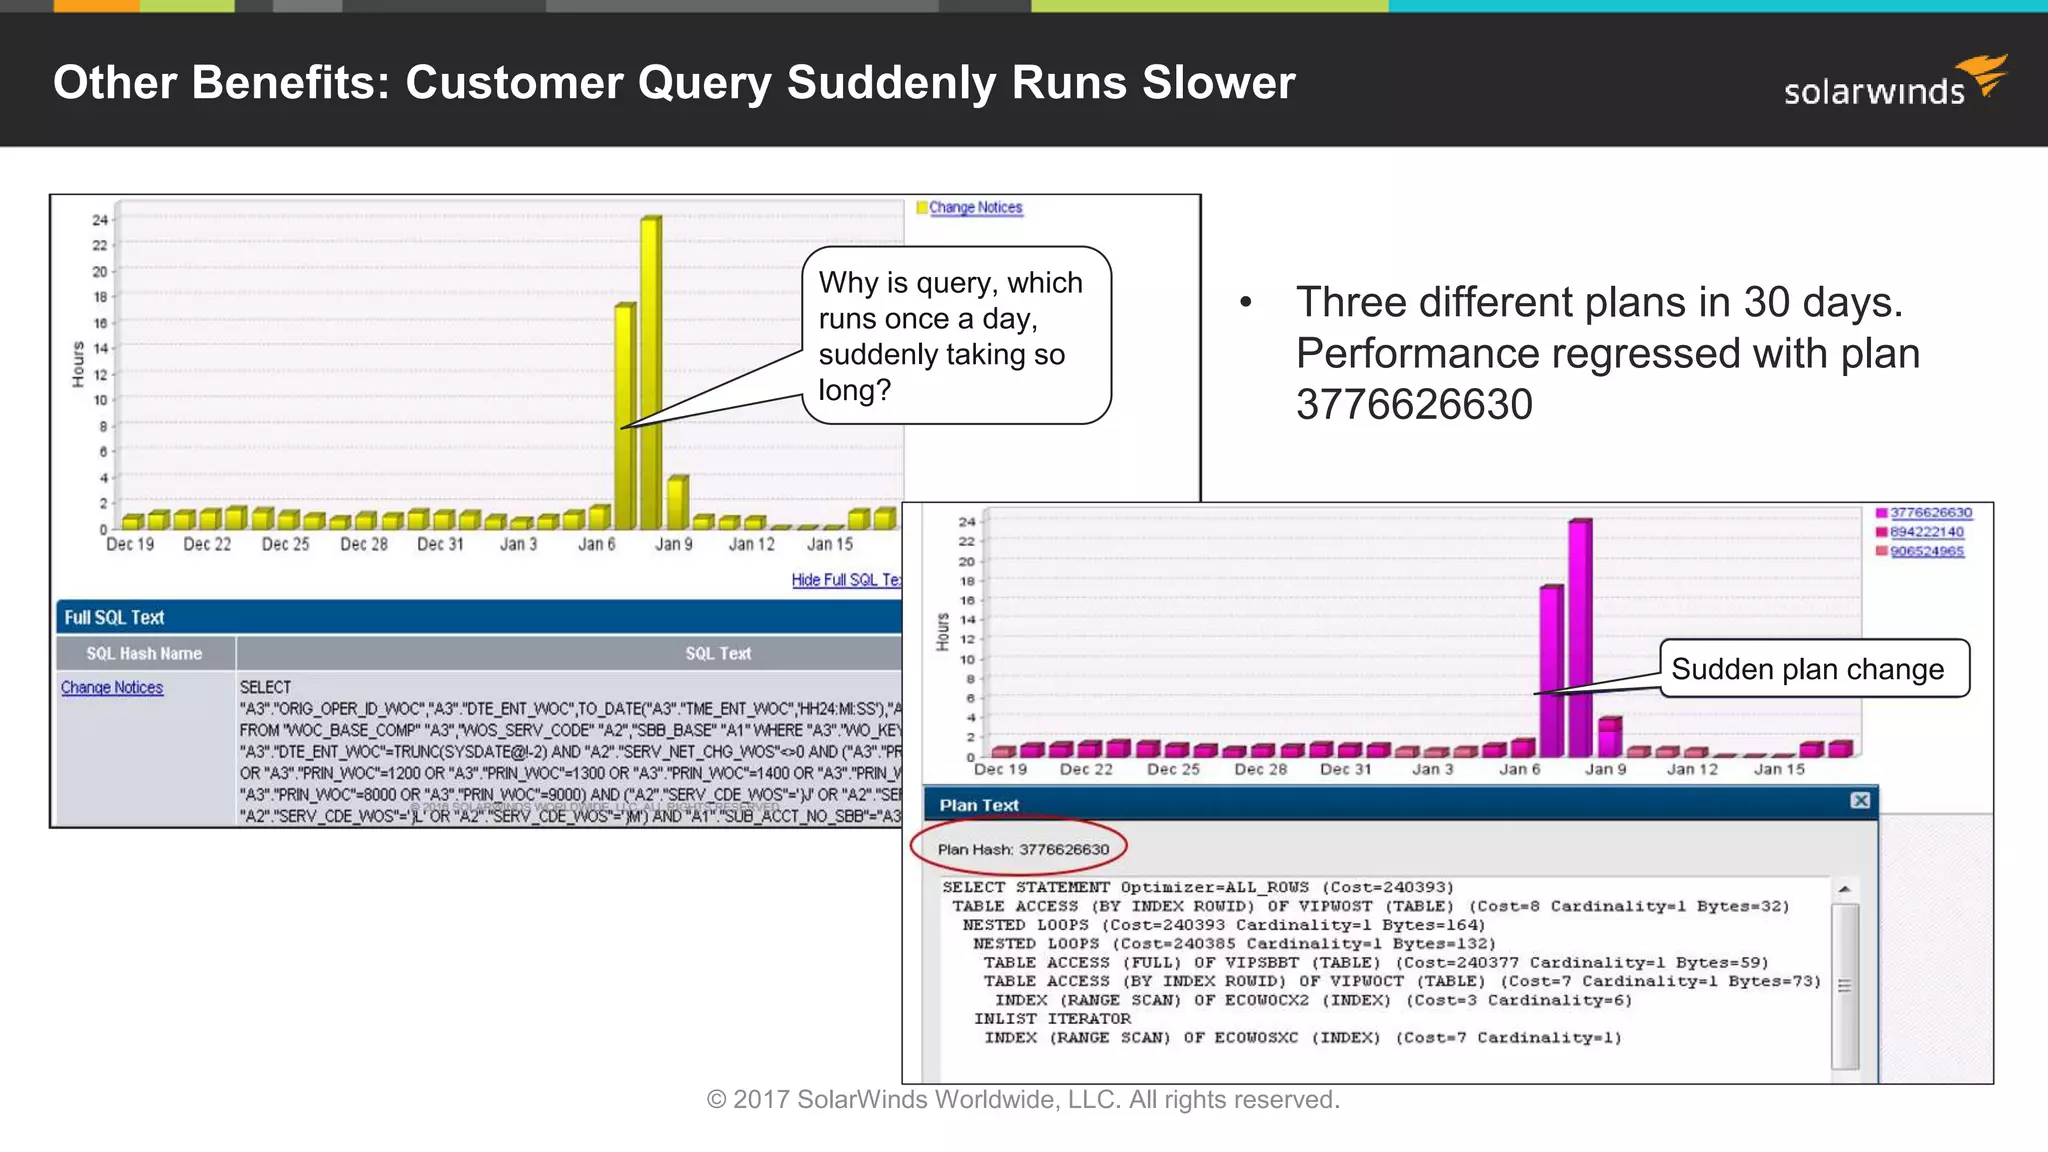
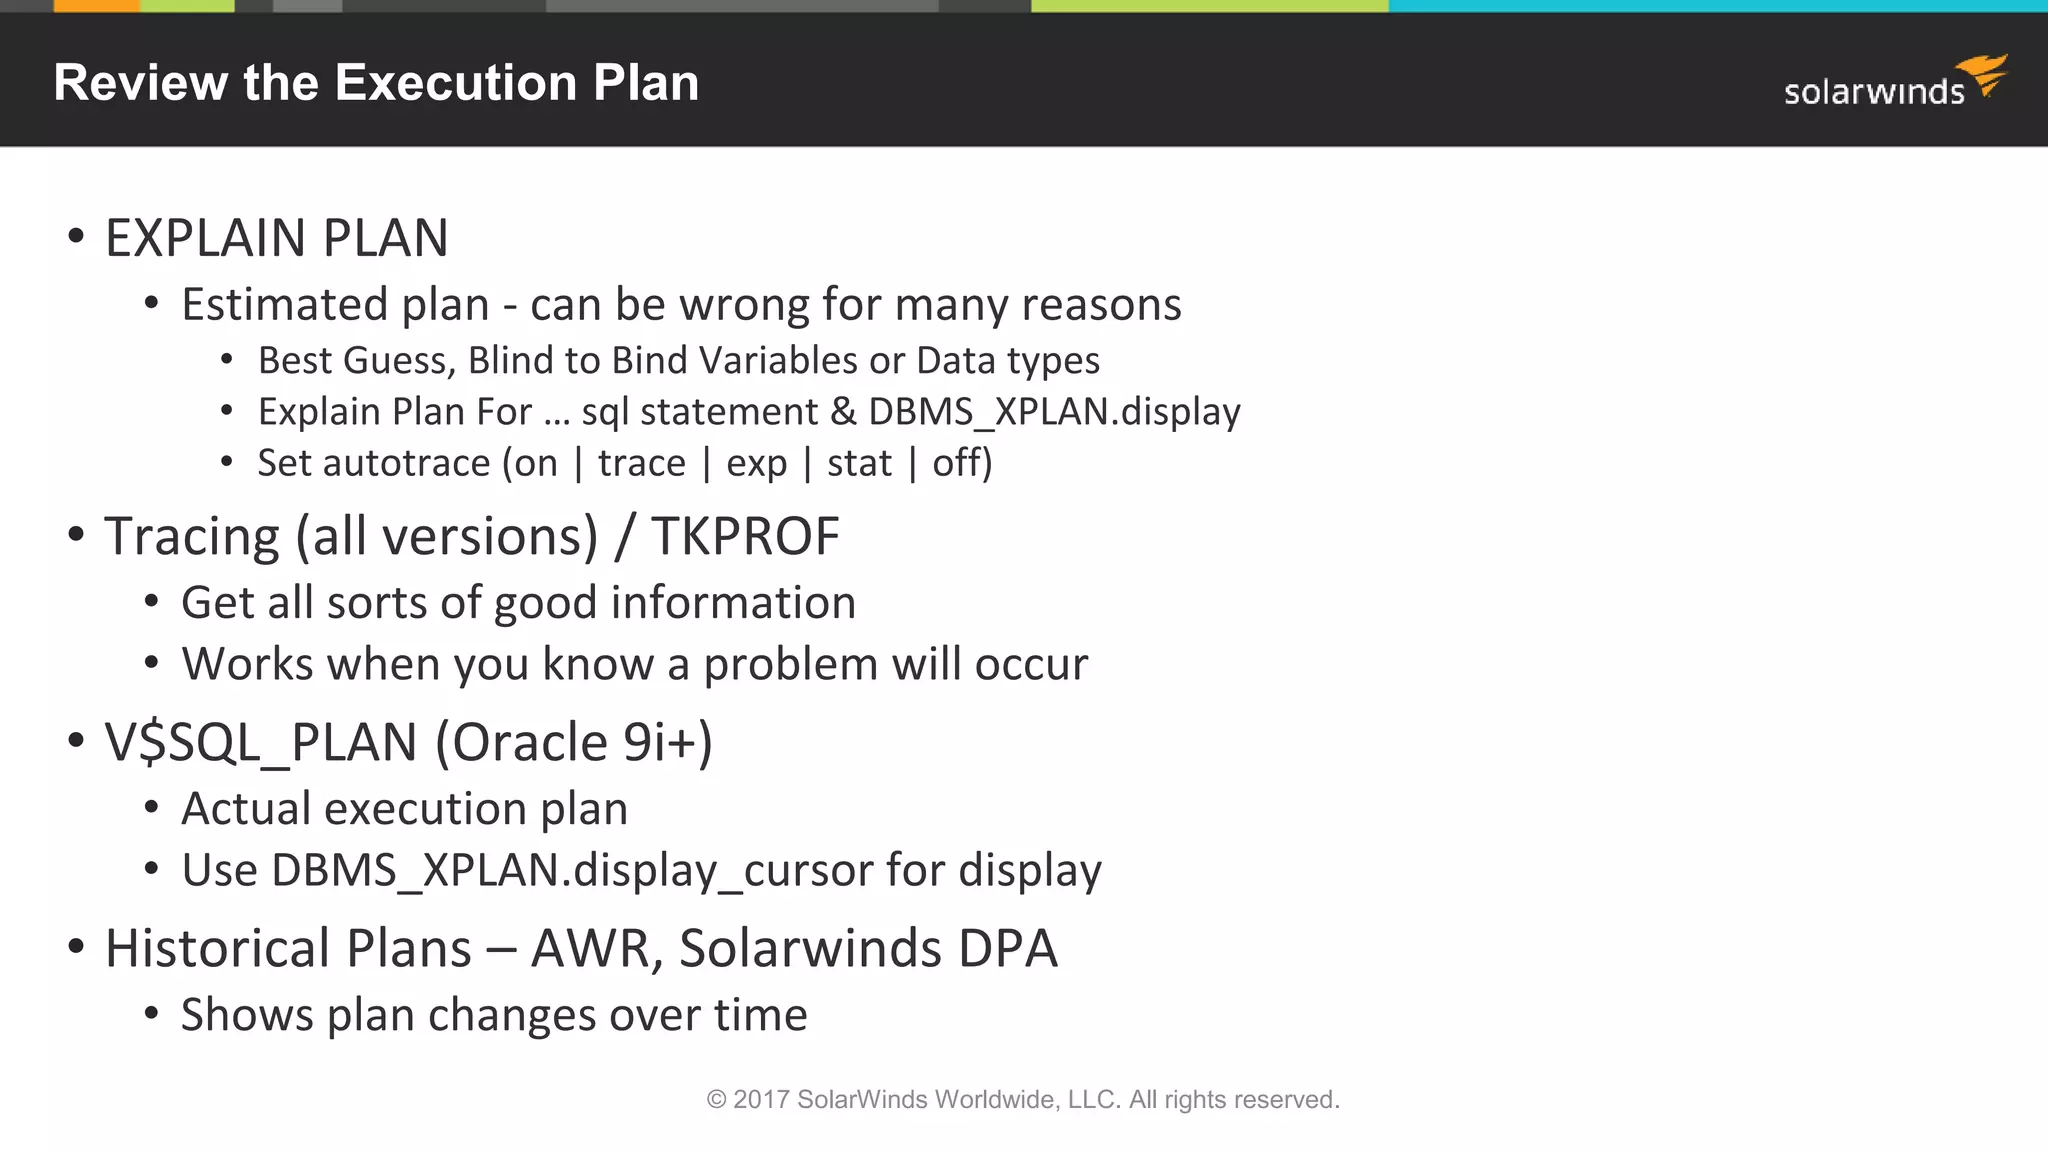
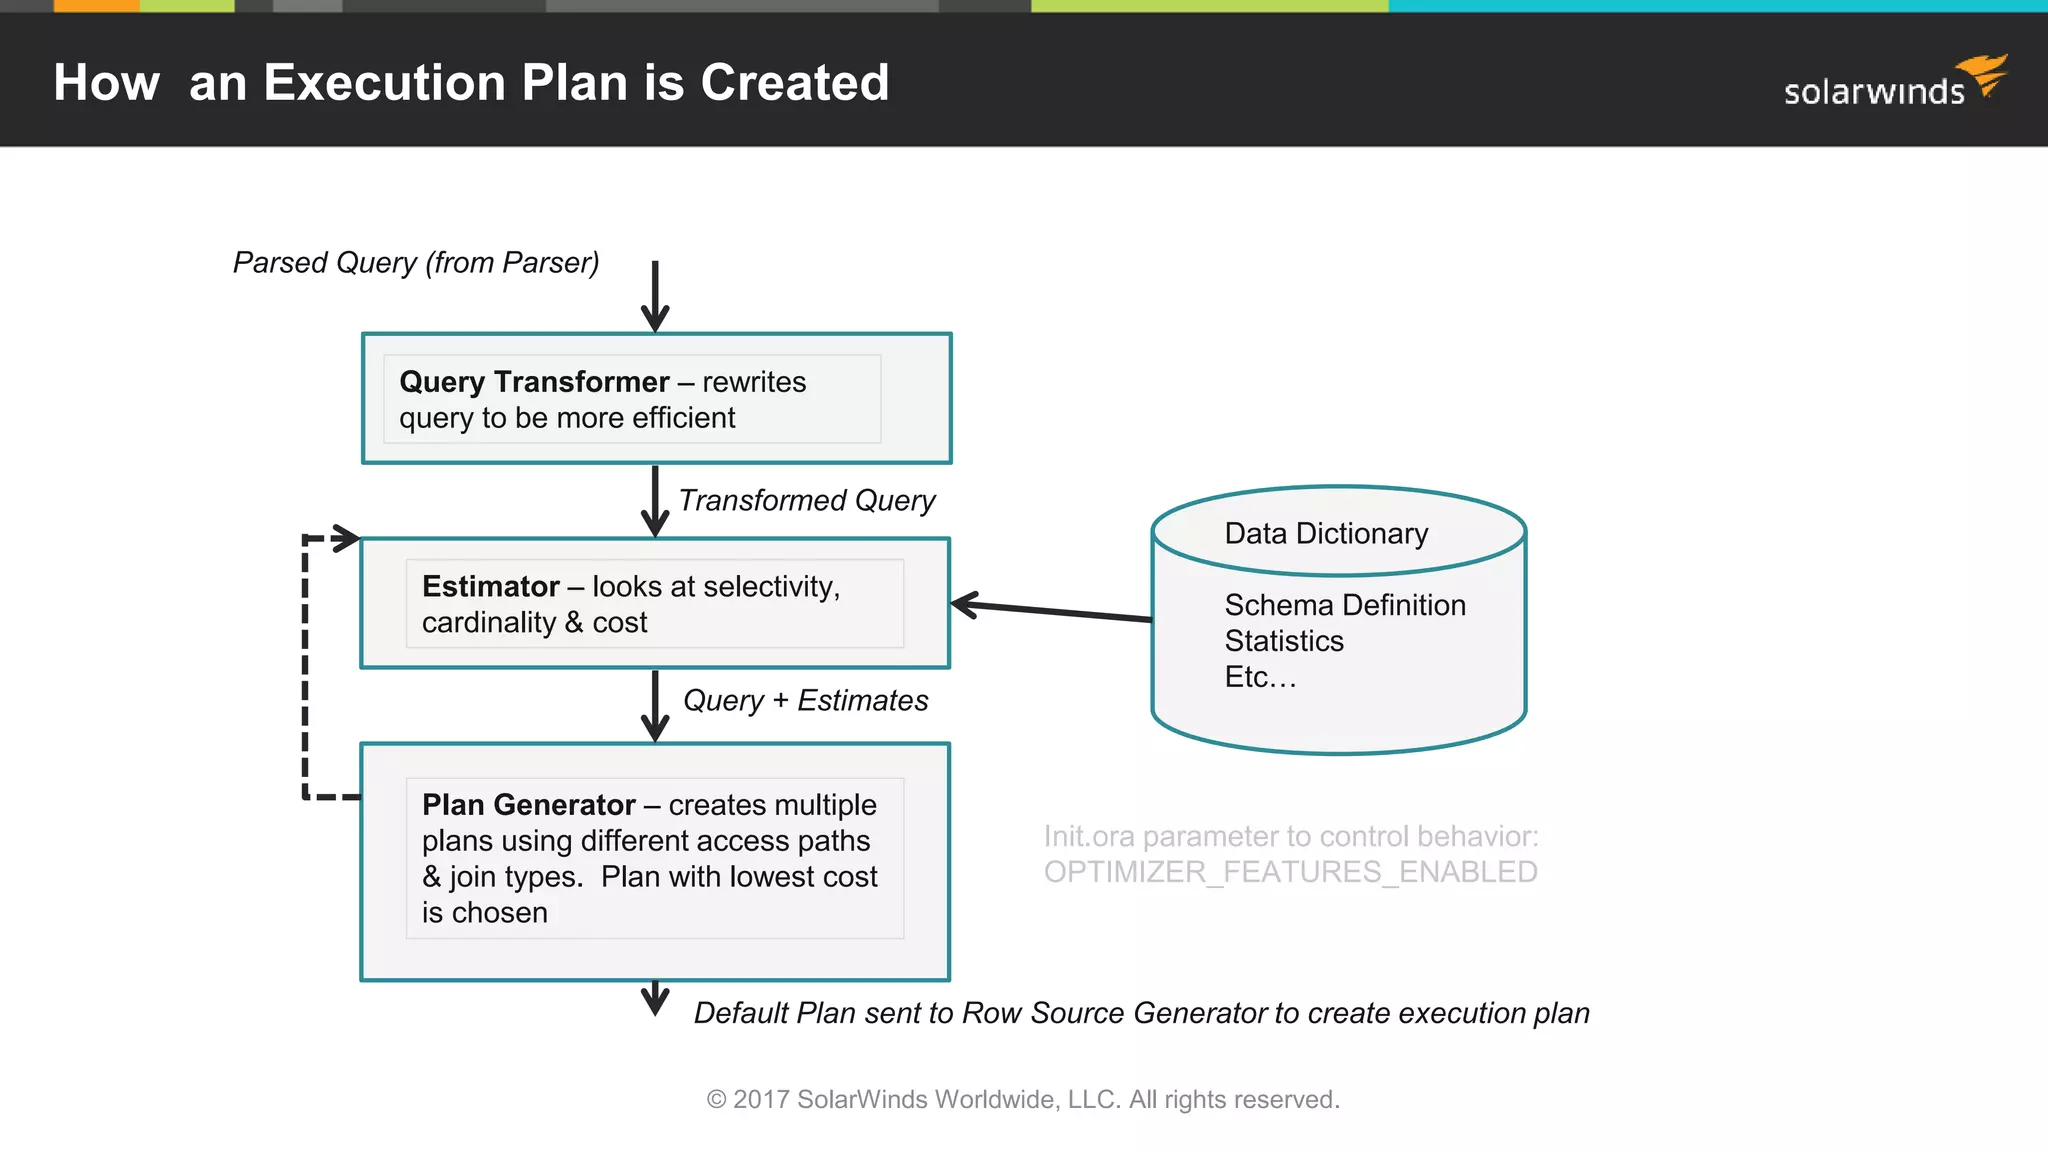
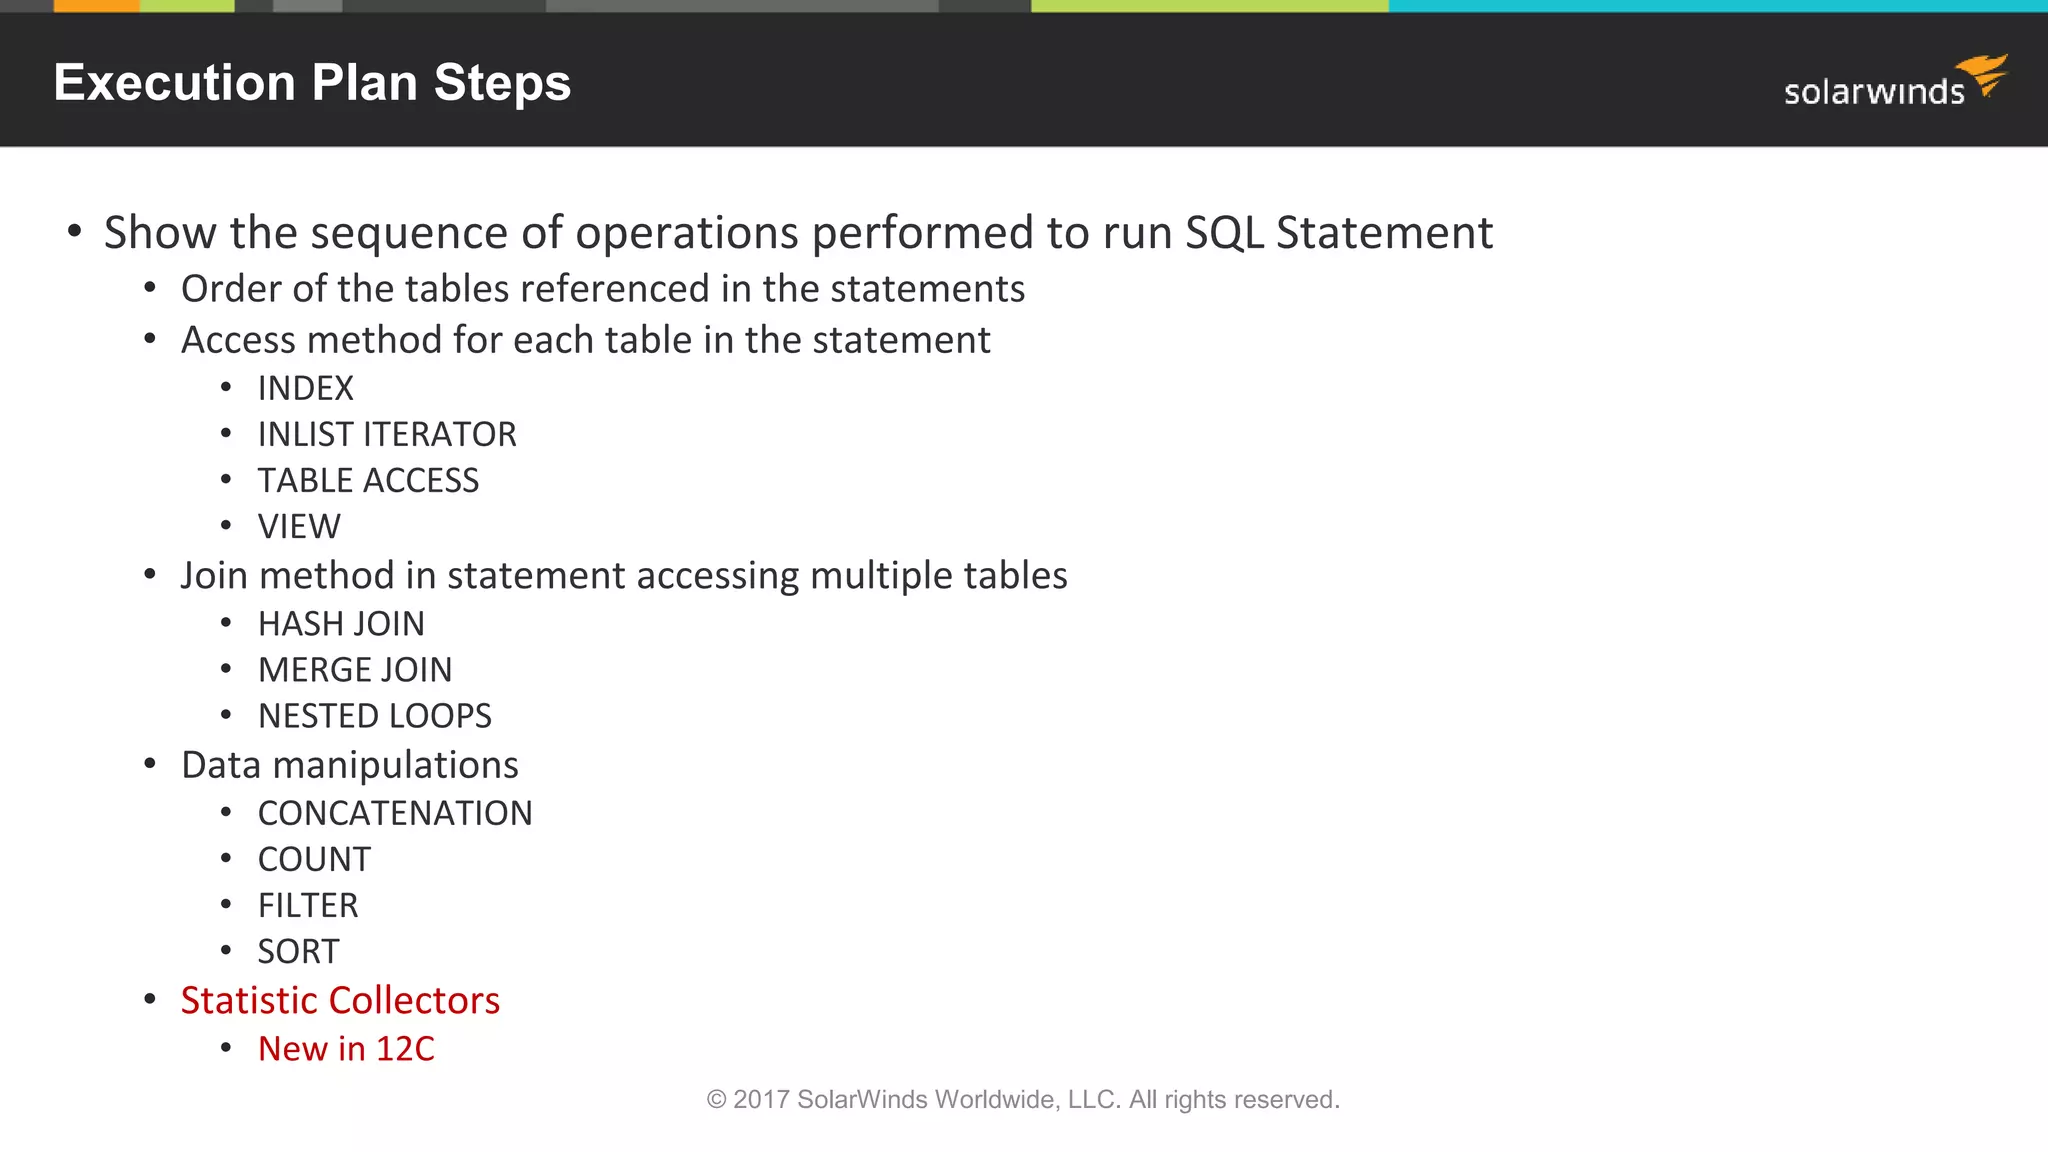
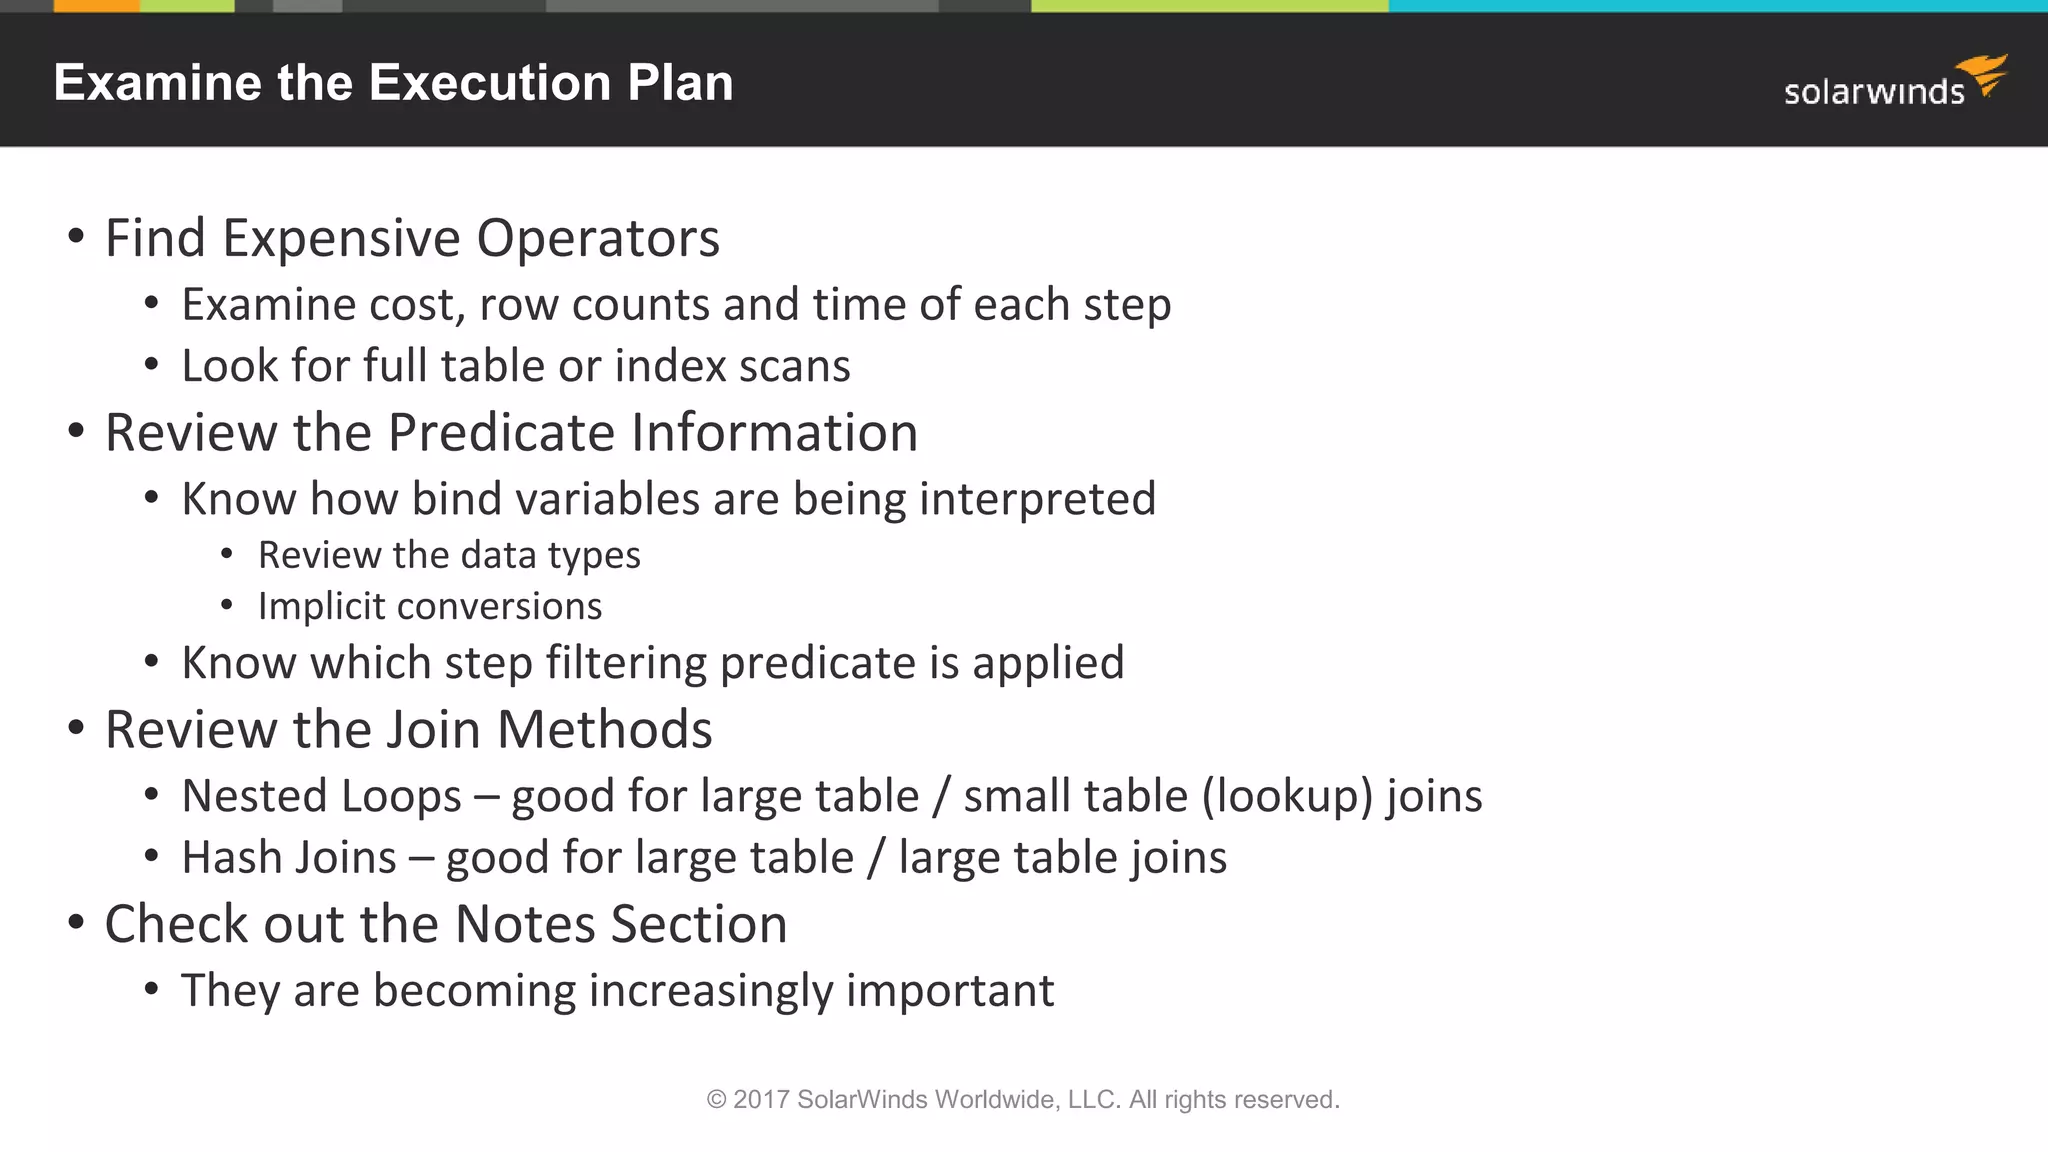
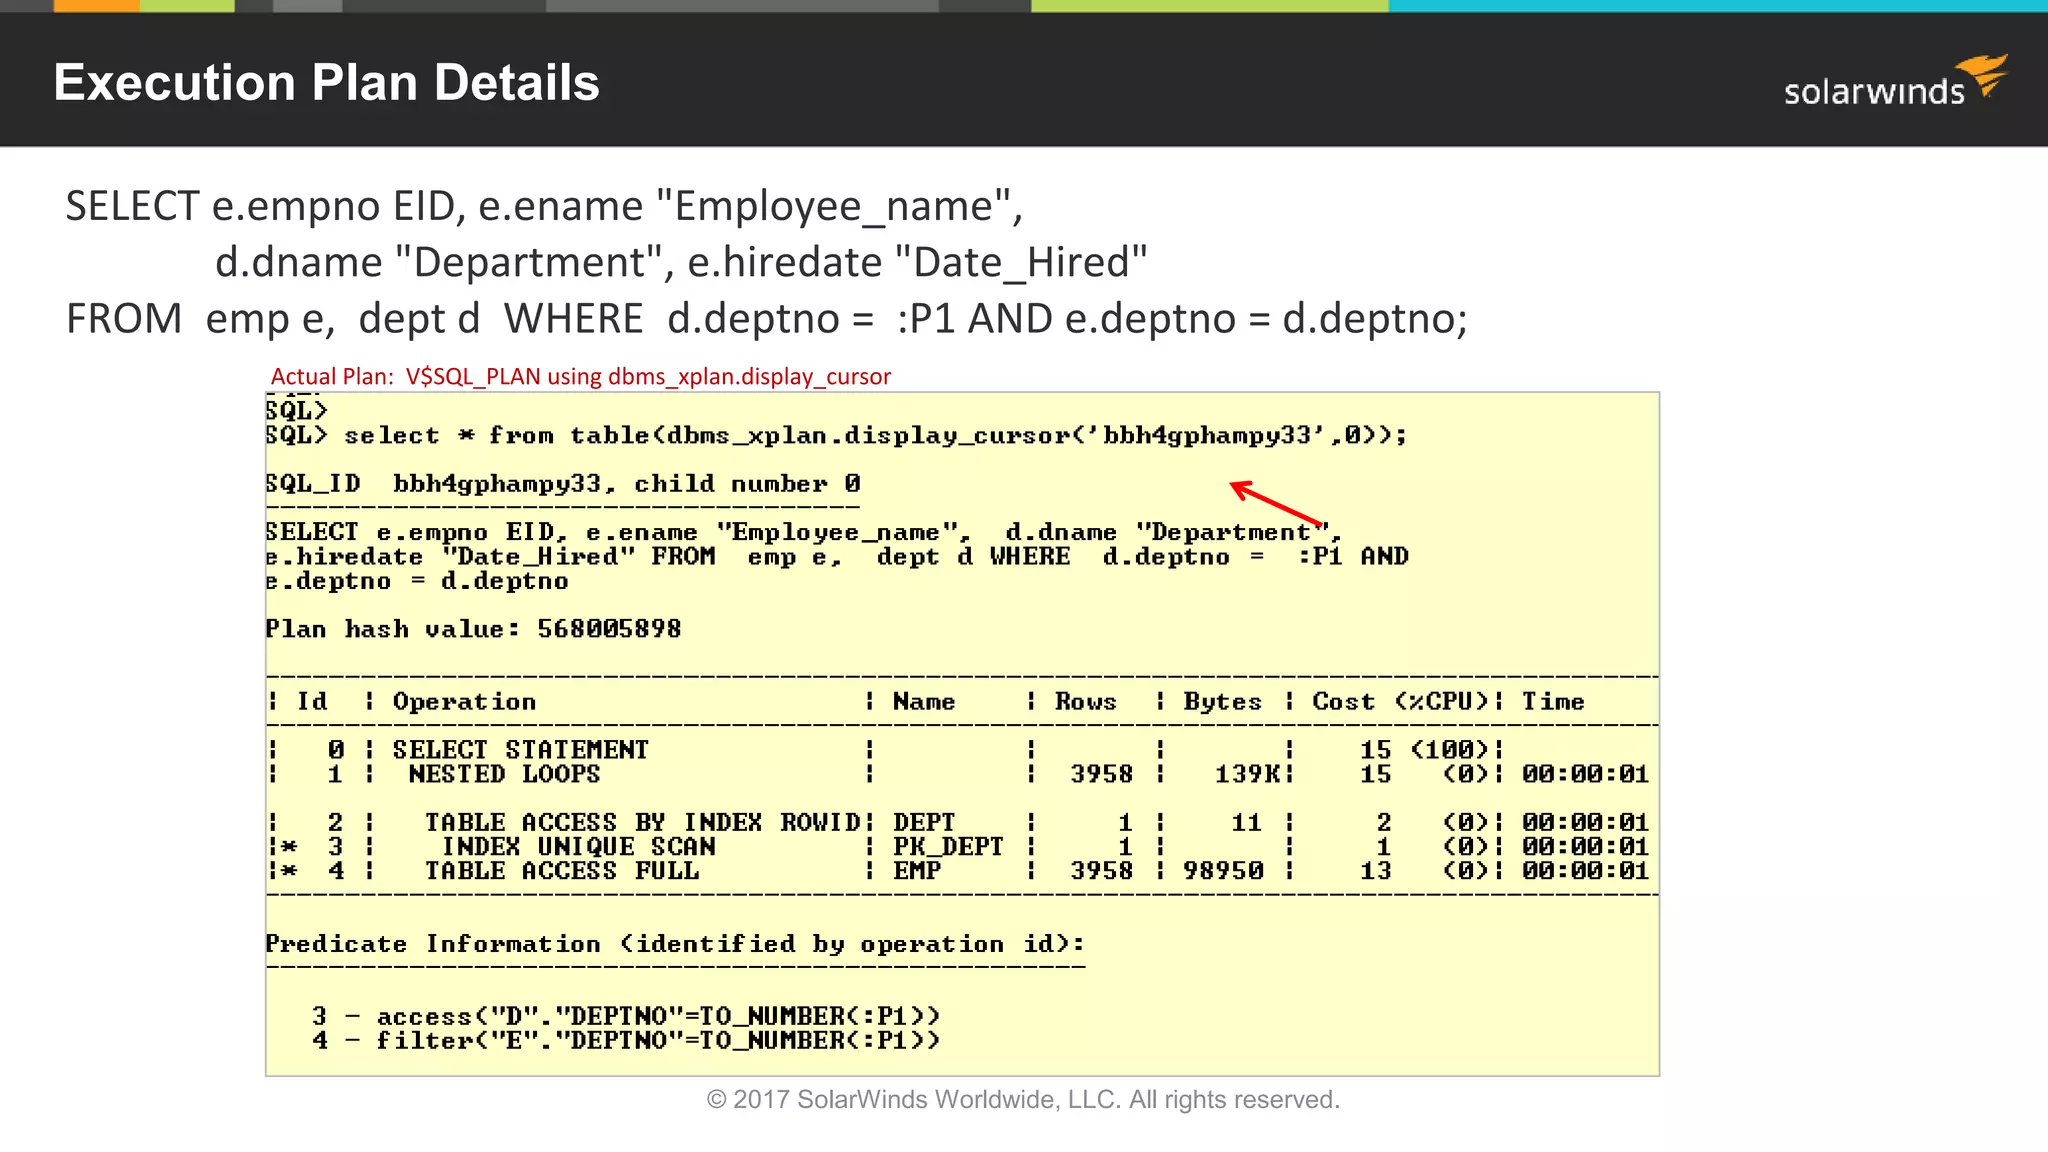
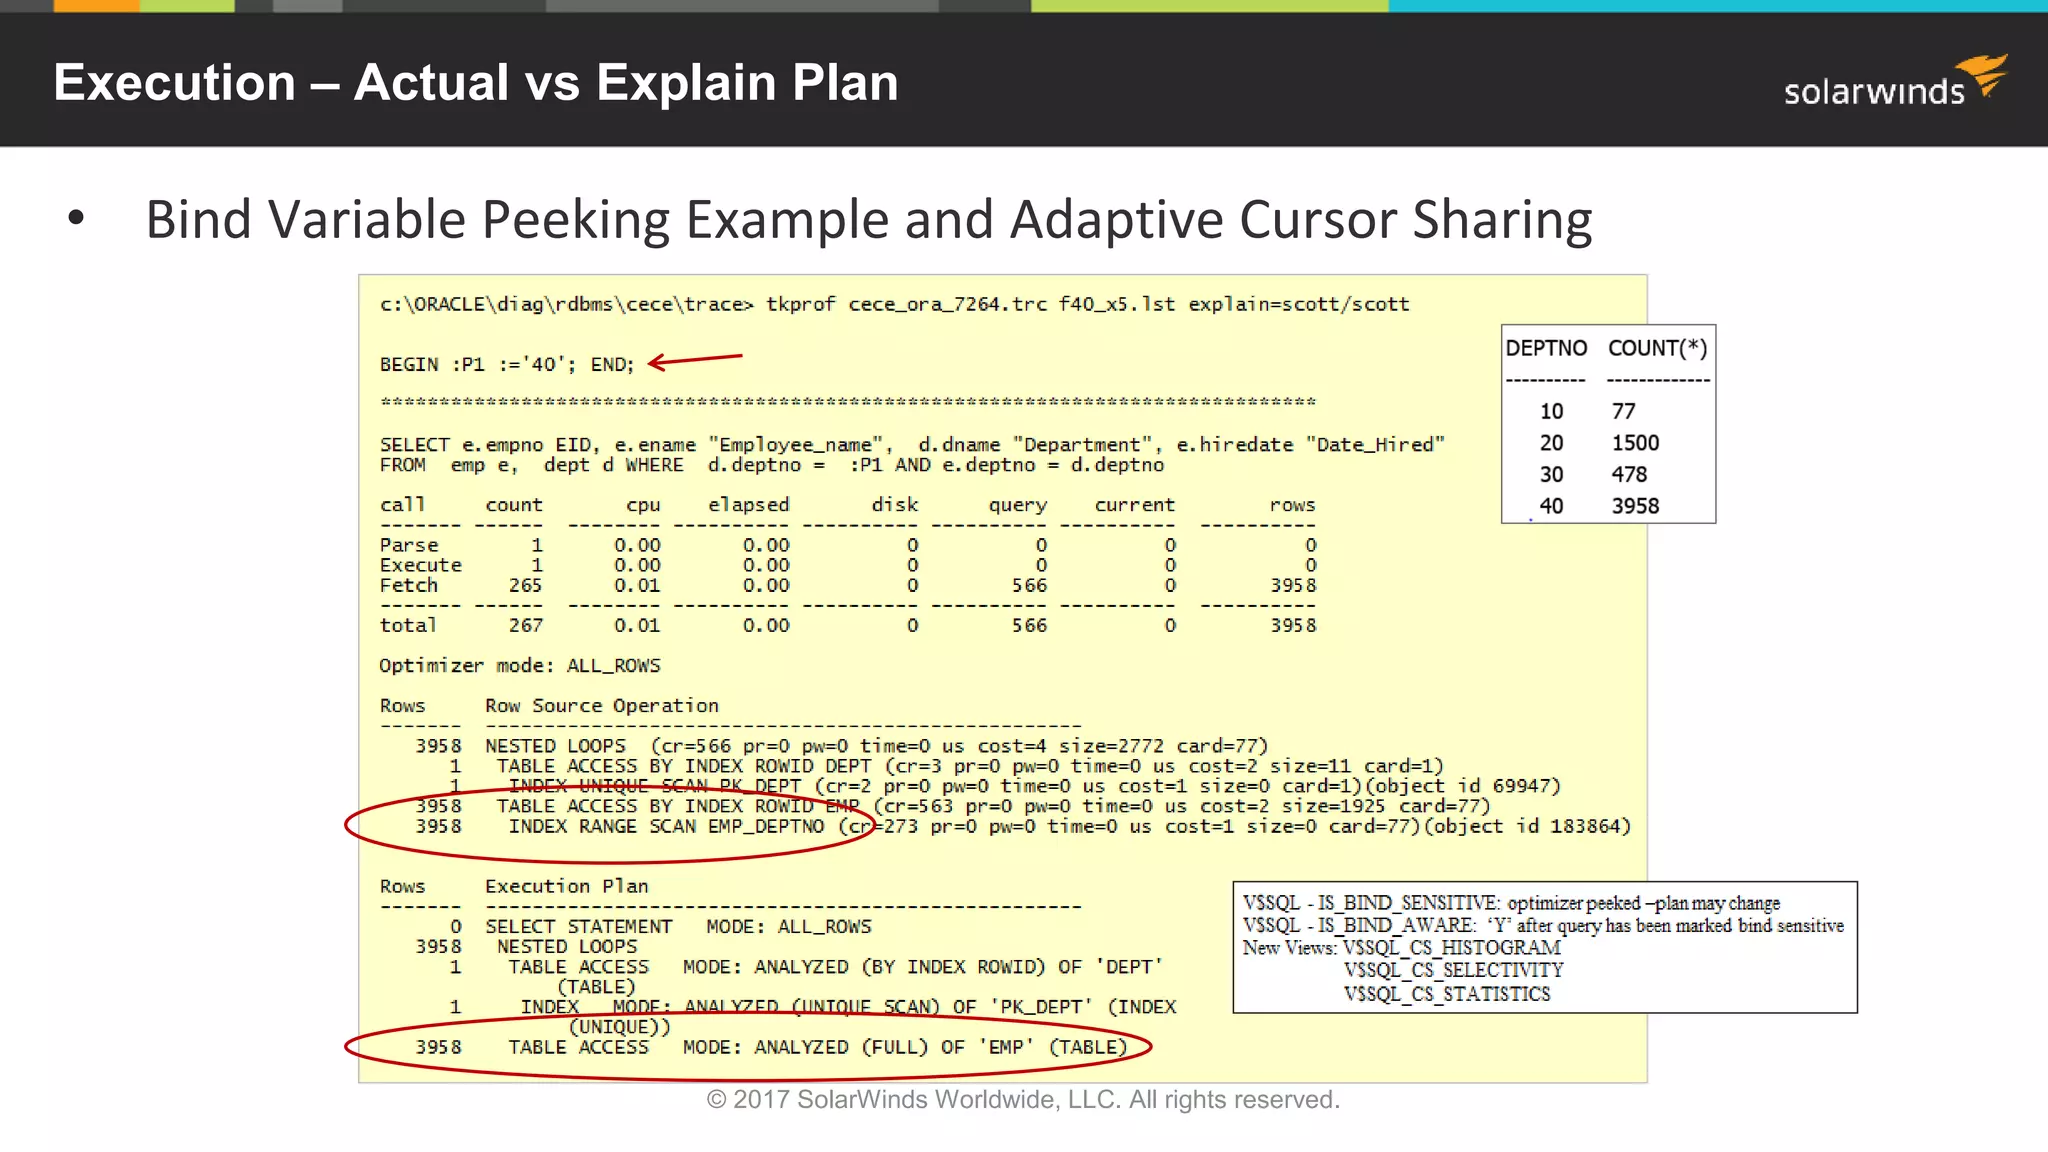
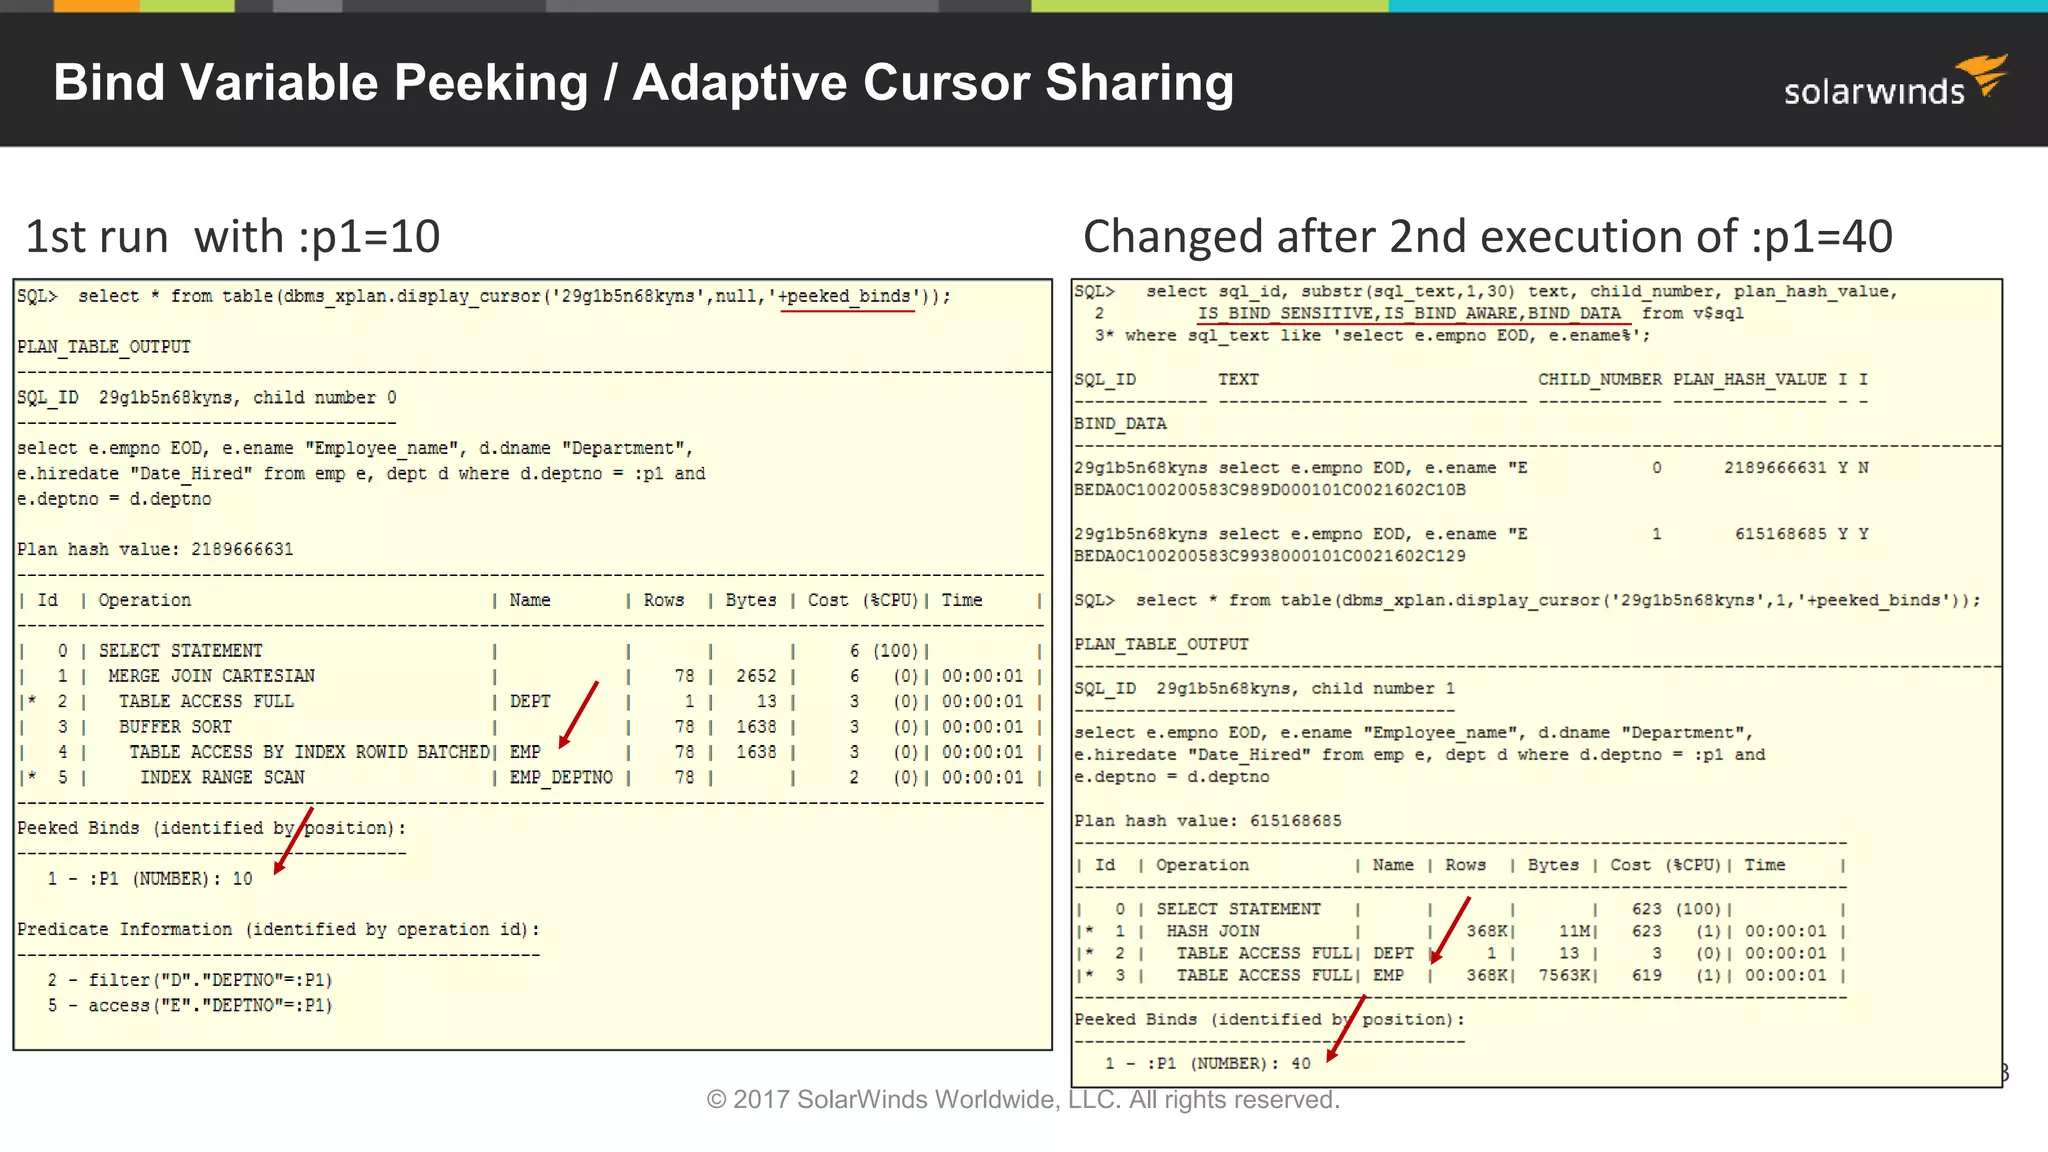
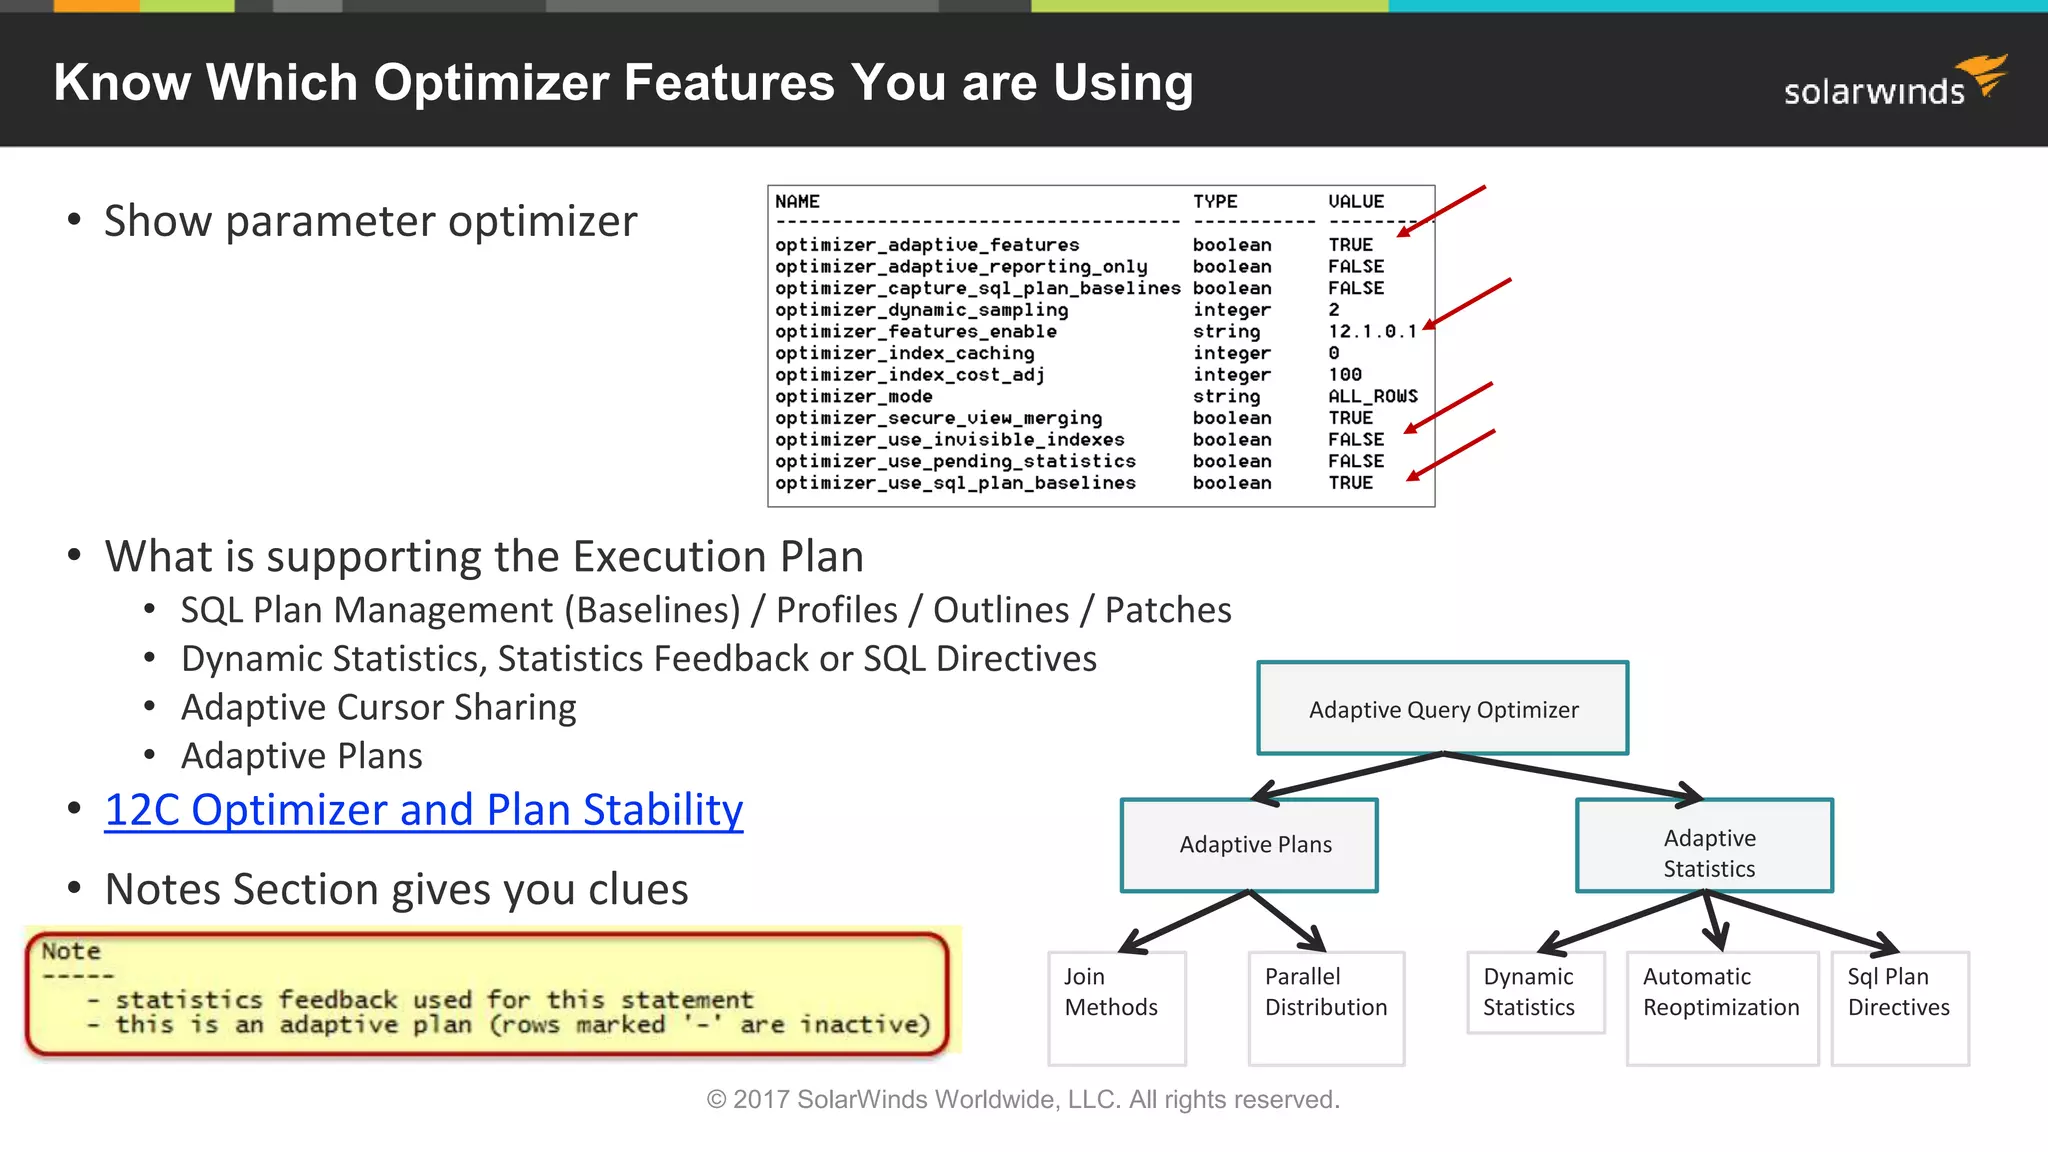
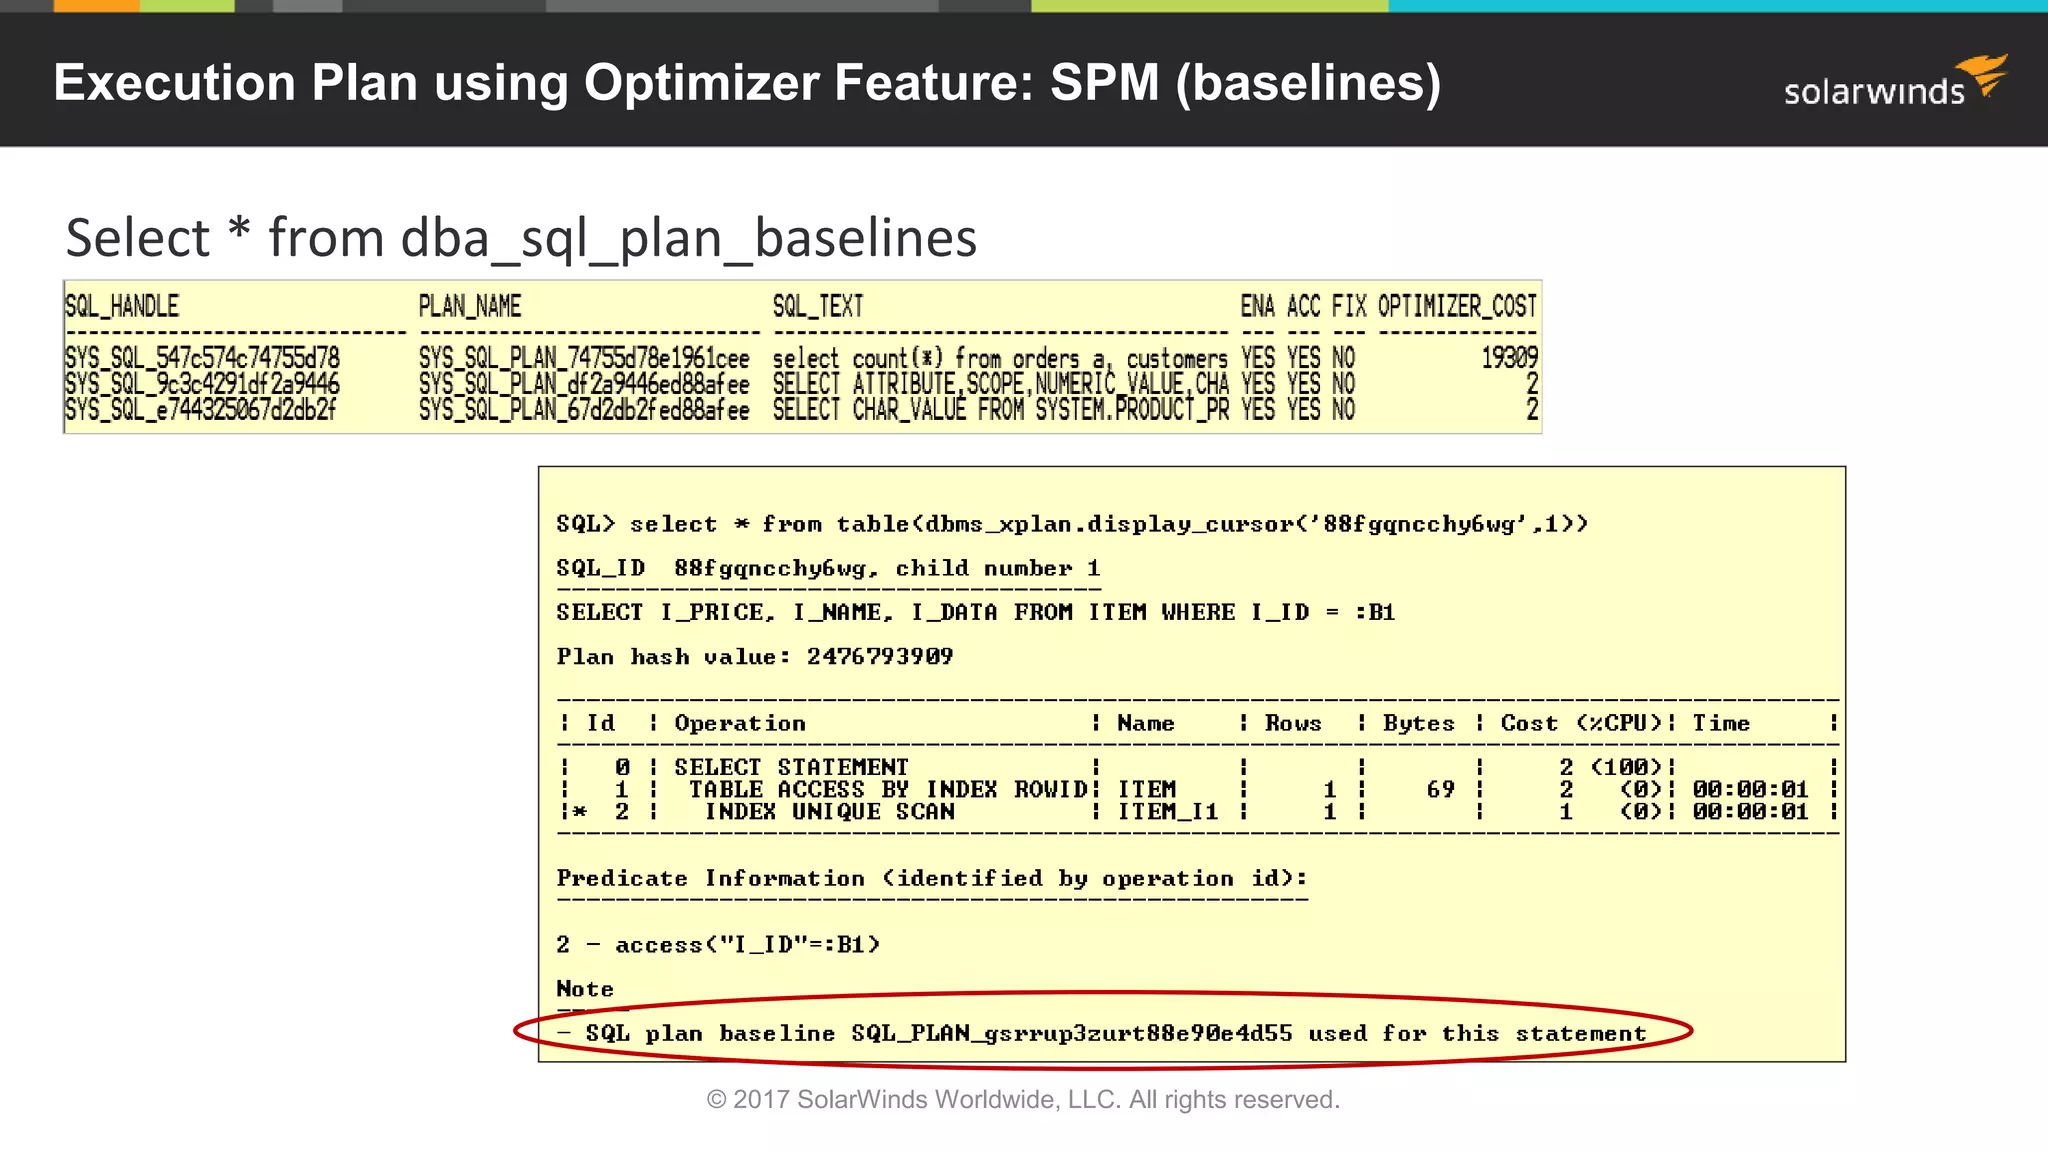
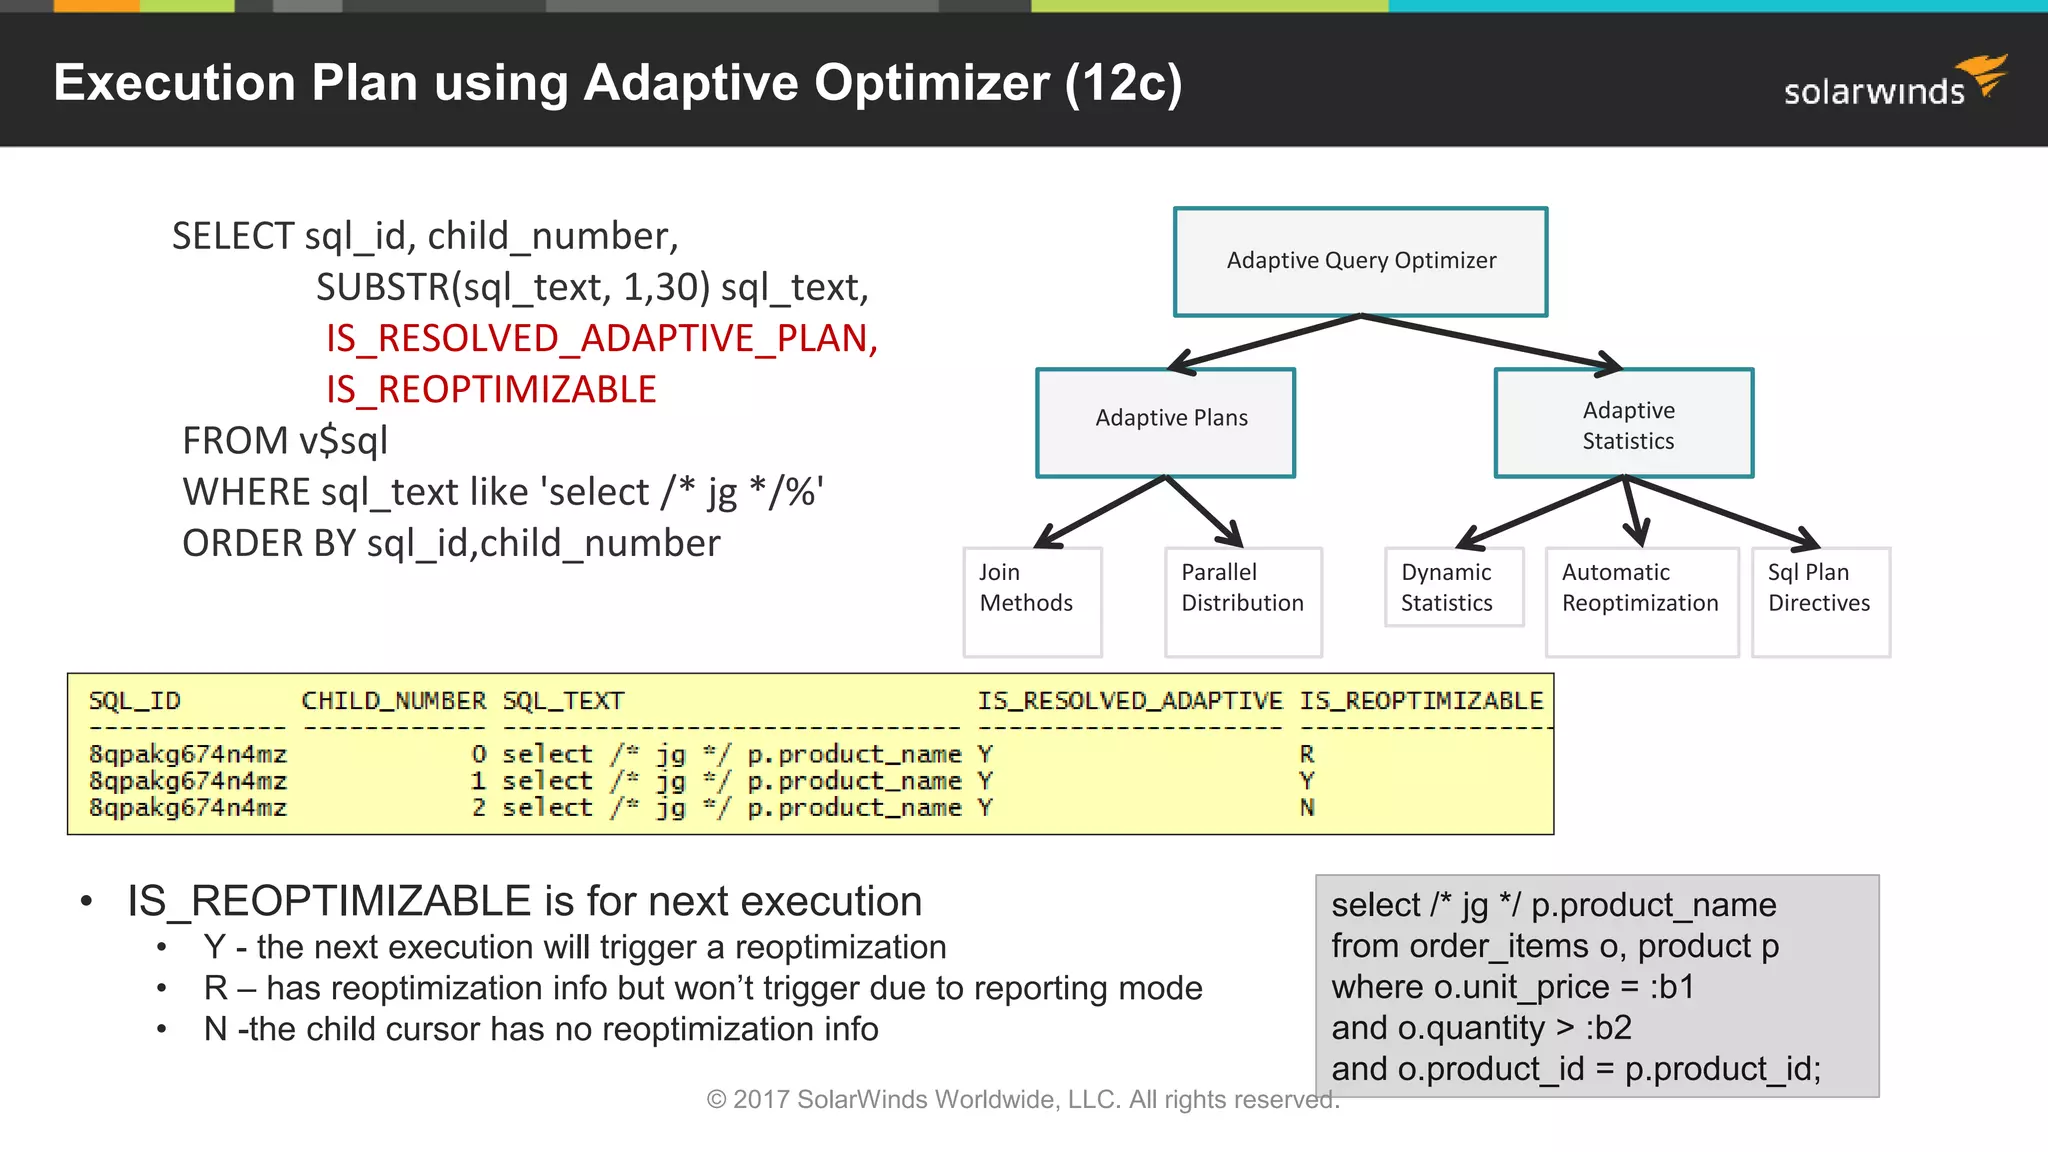
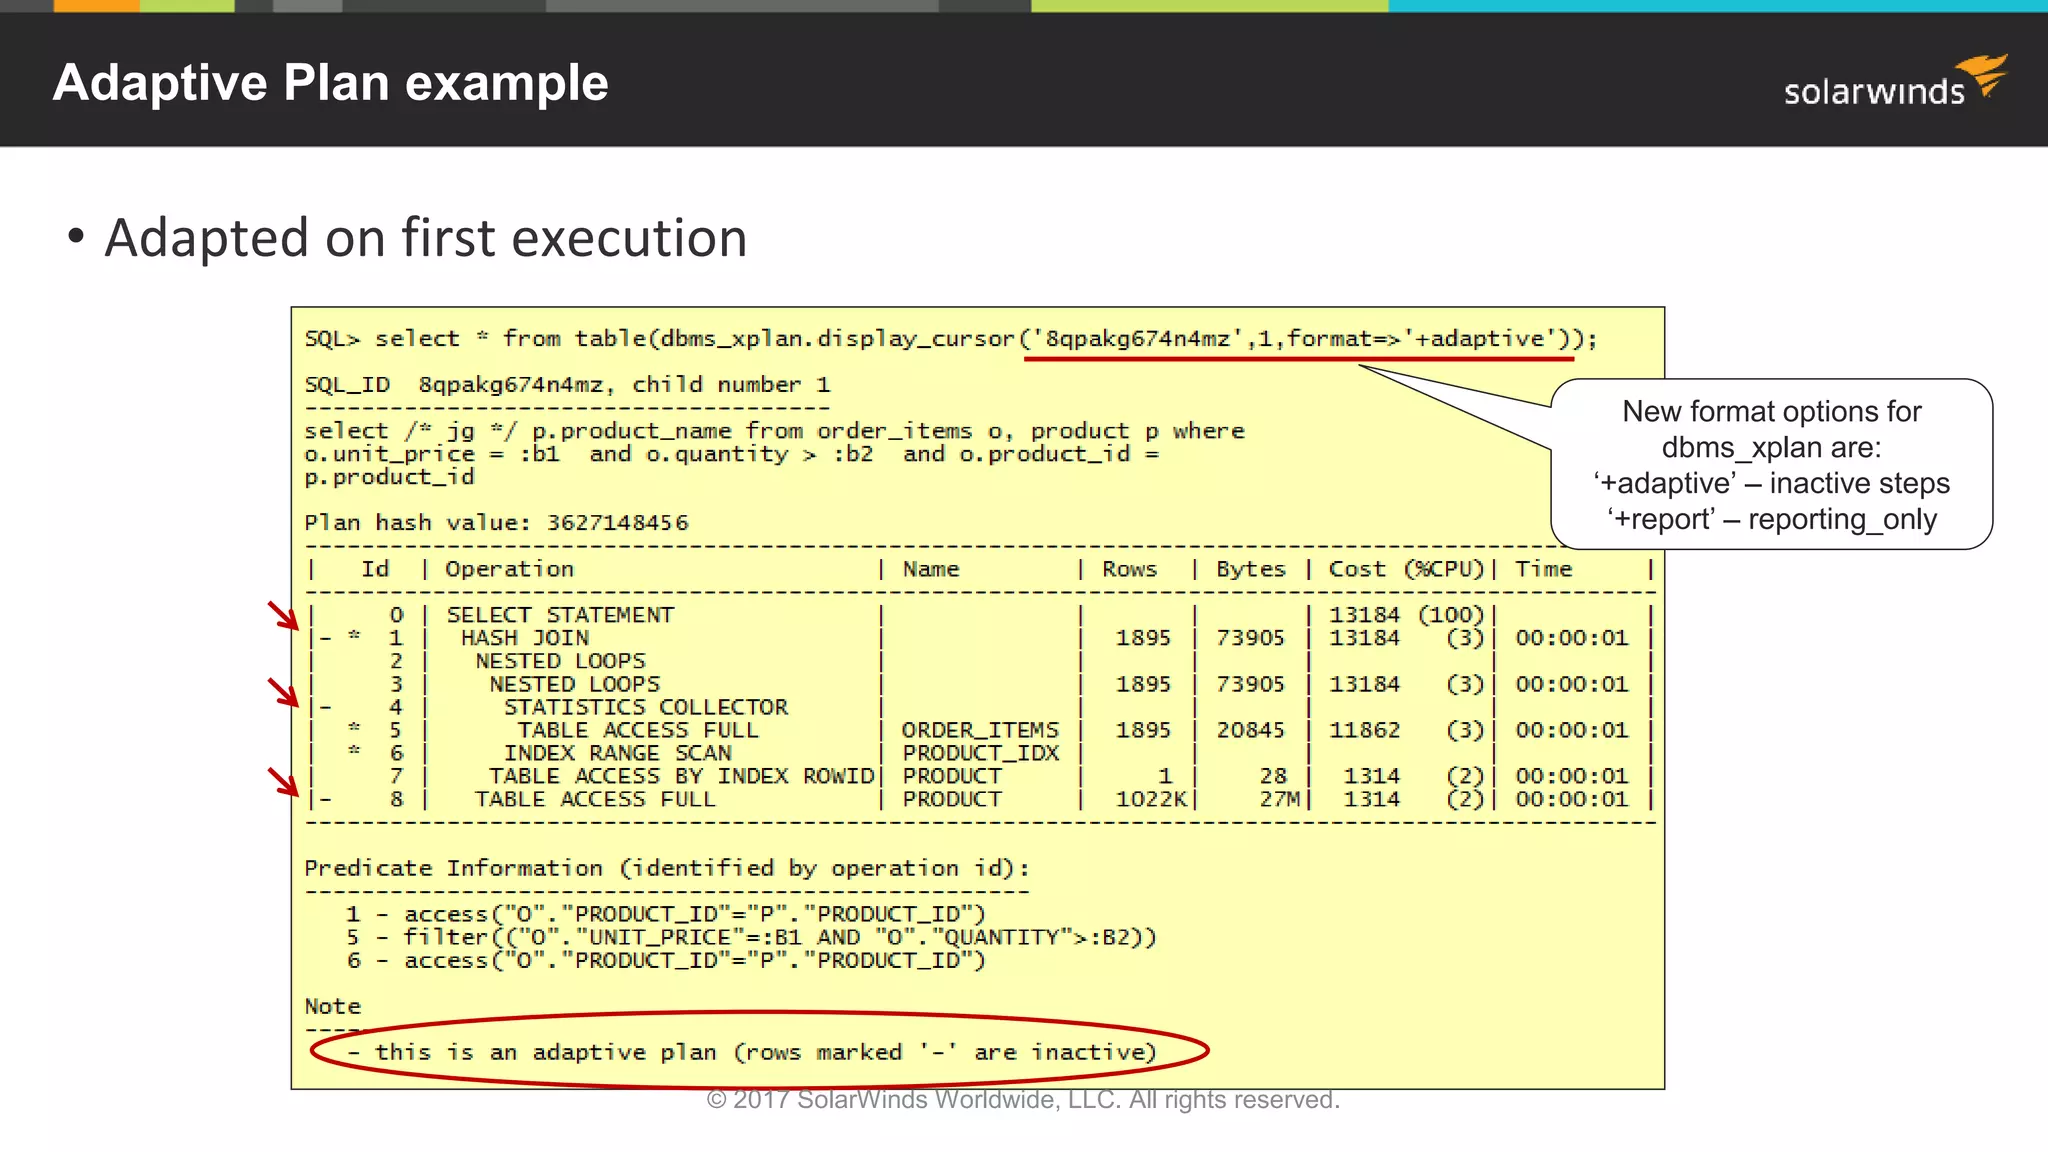
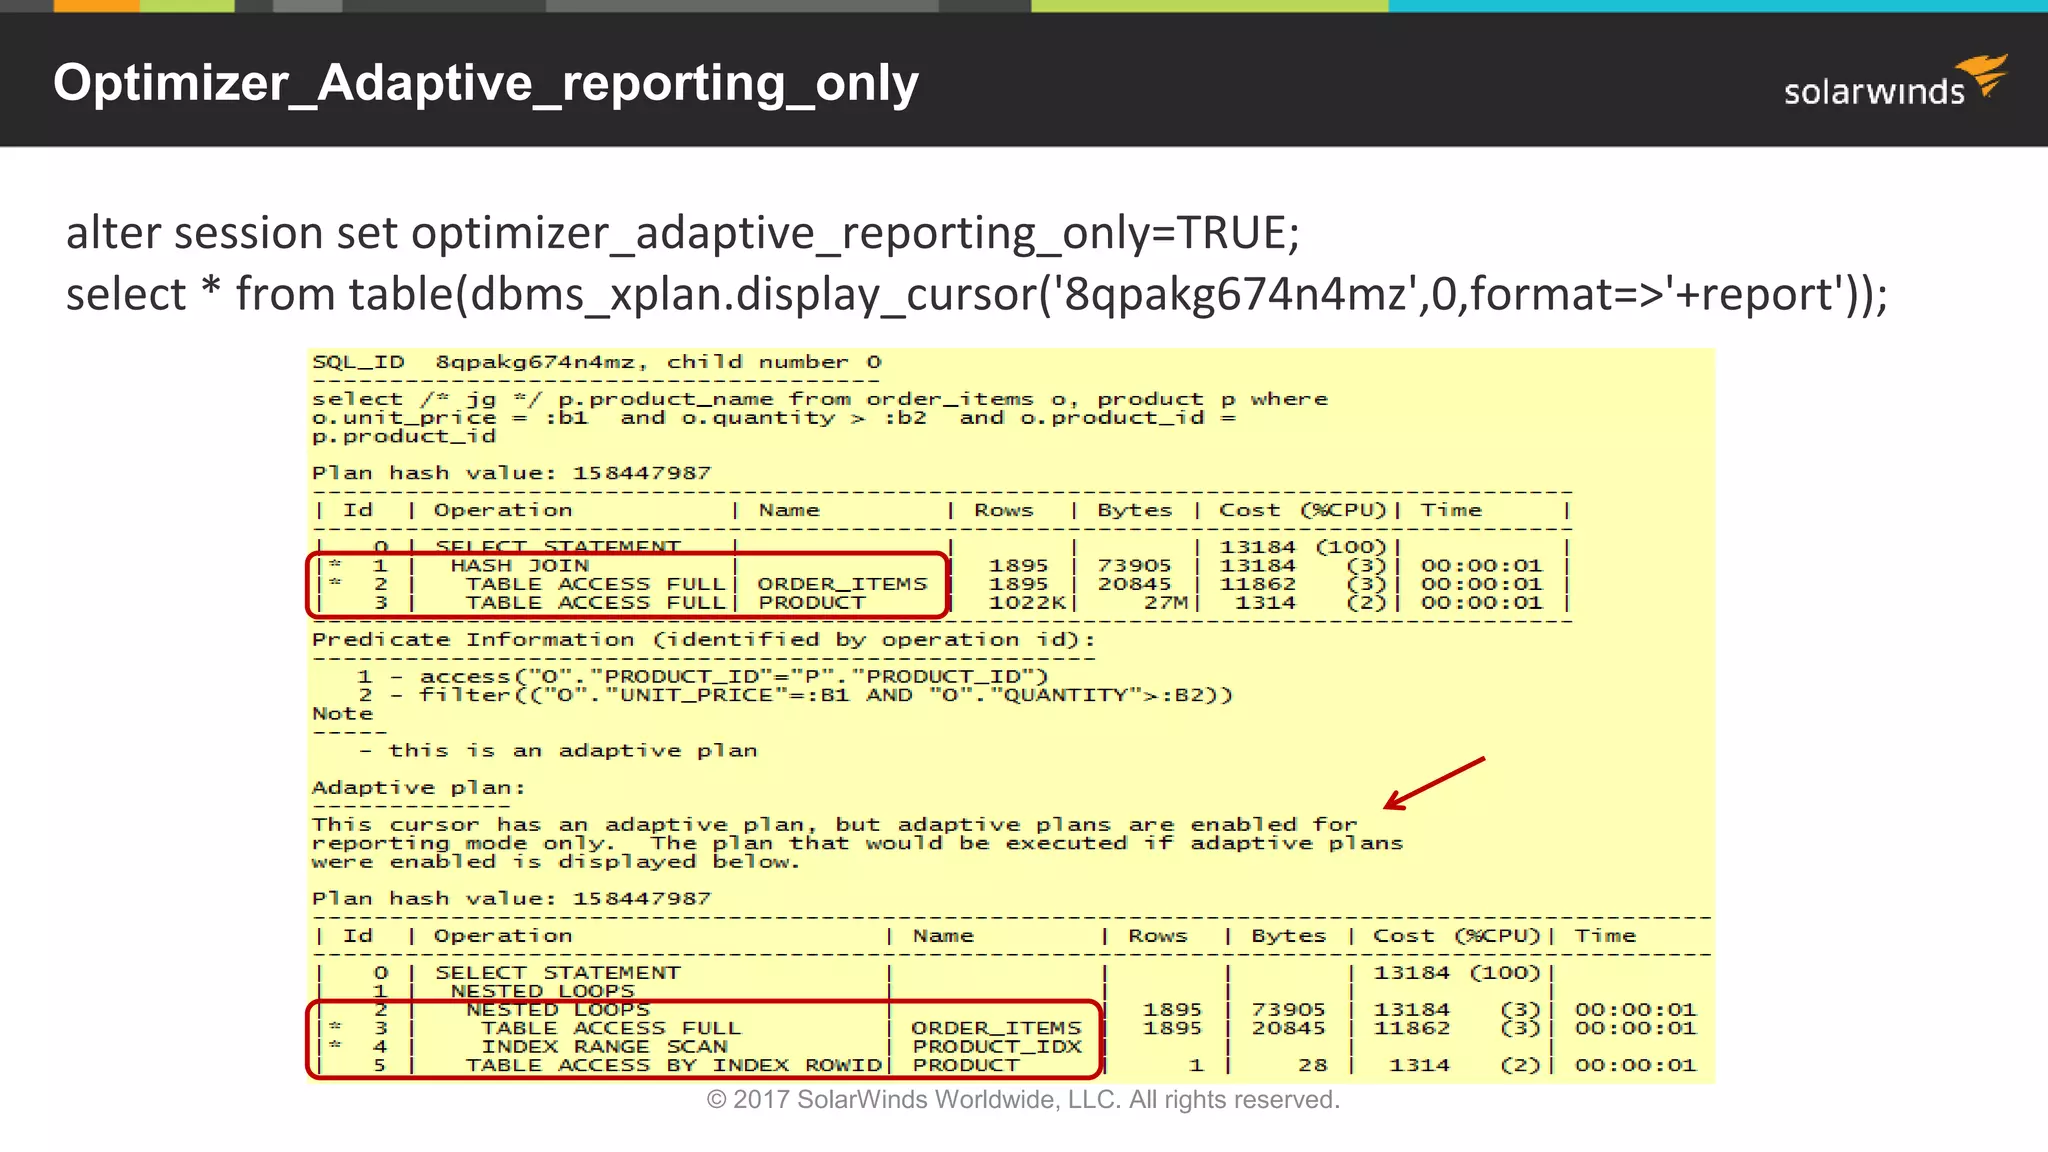
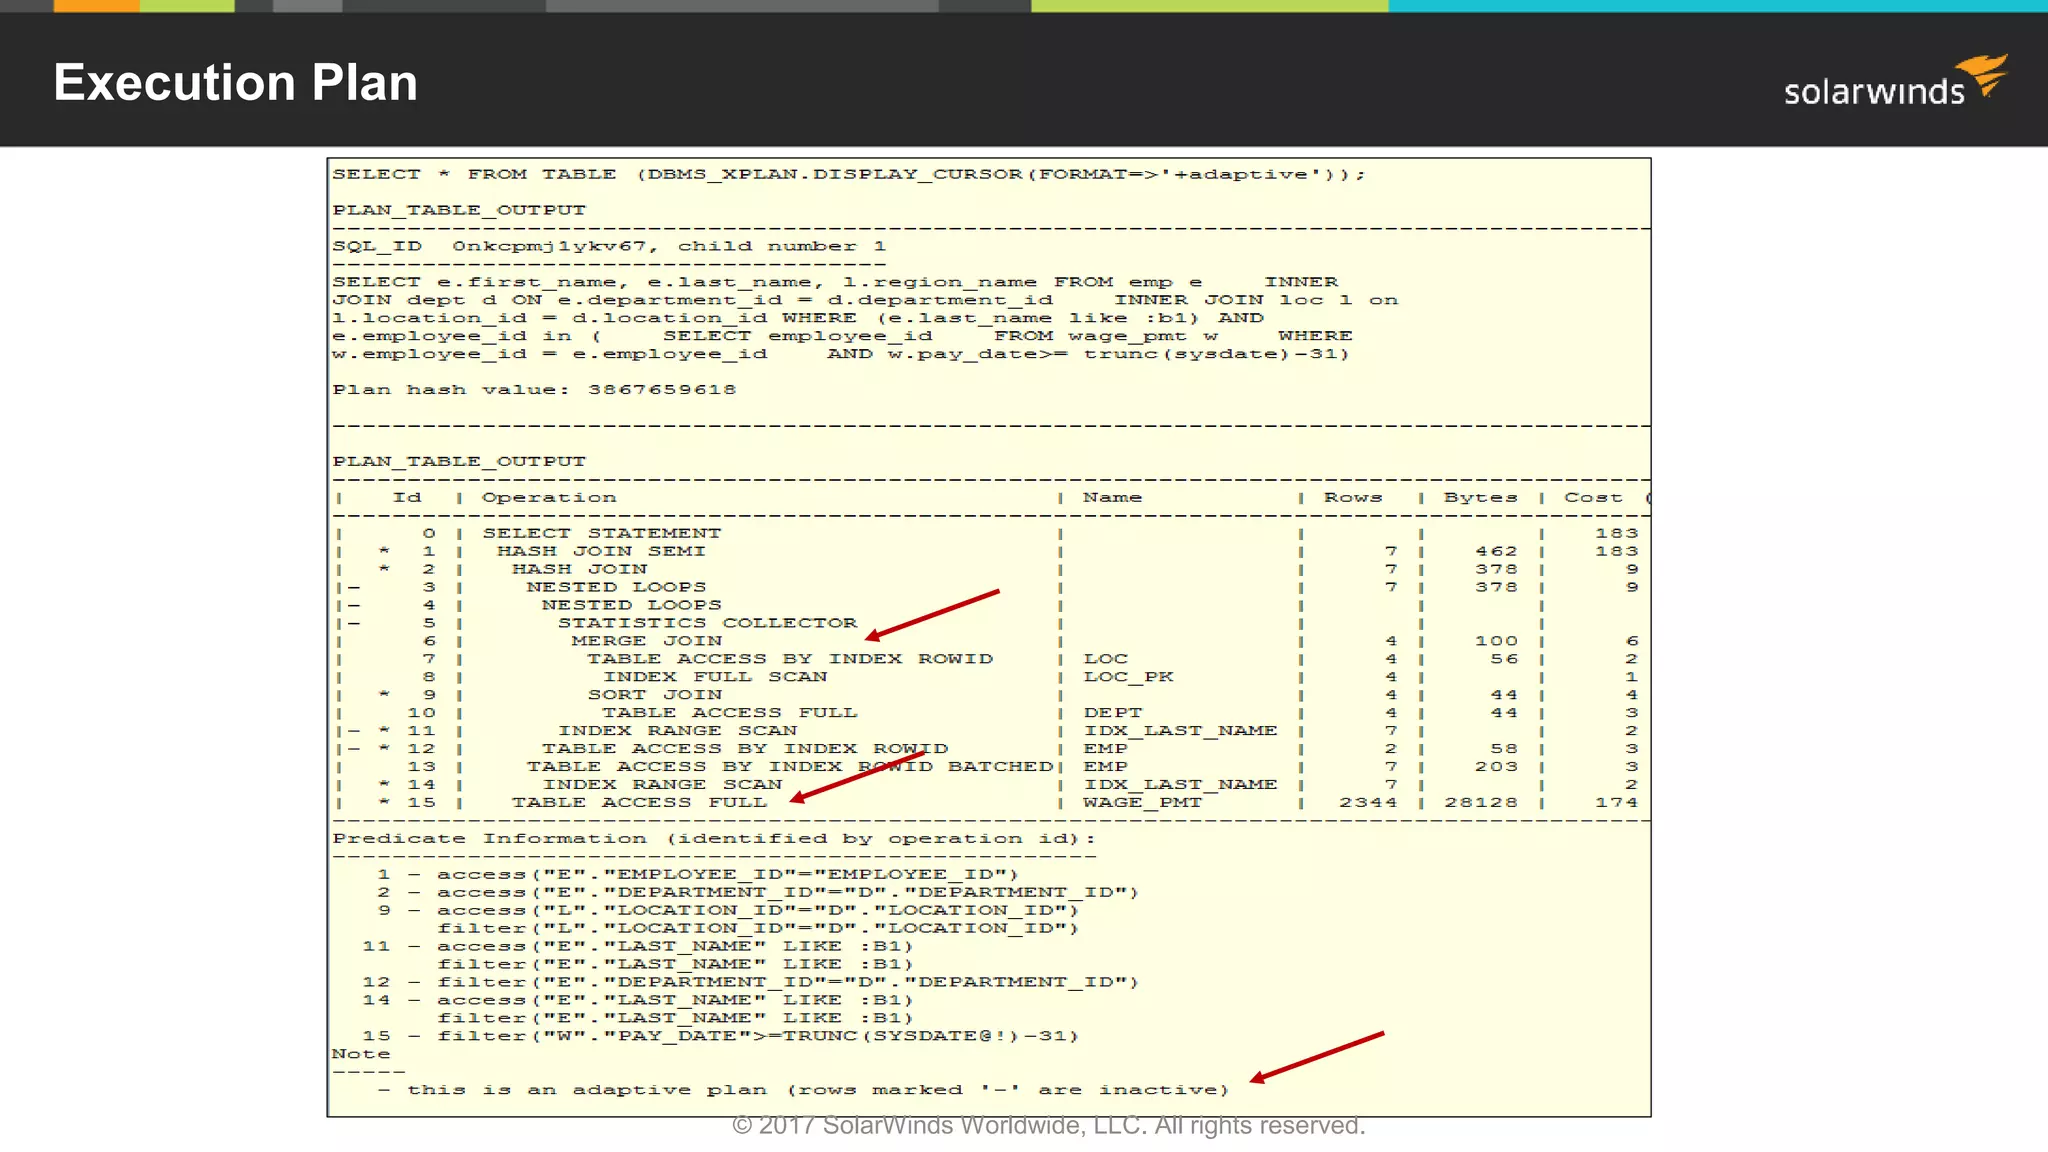
The steps to review execution plans, understanding how they are created and the significance of bind variables and adaptive plans.
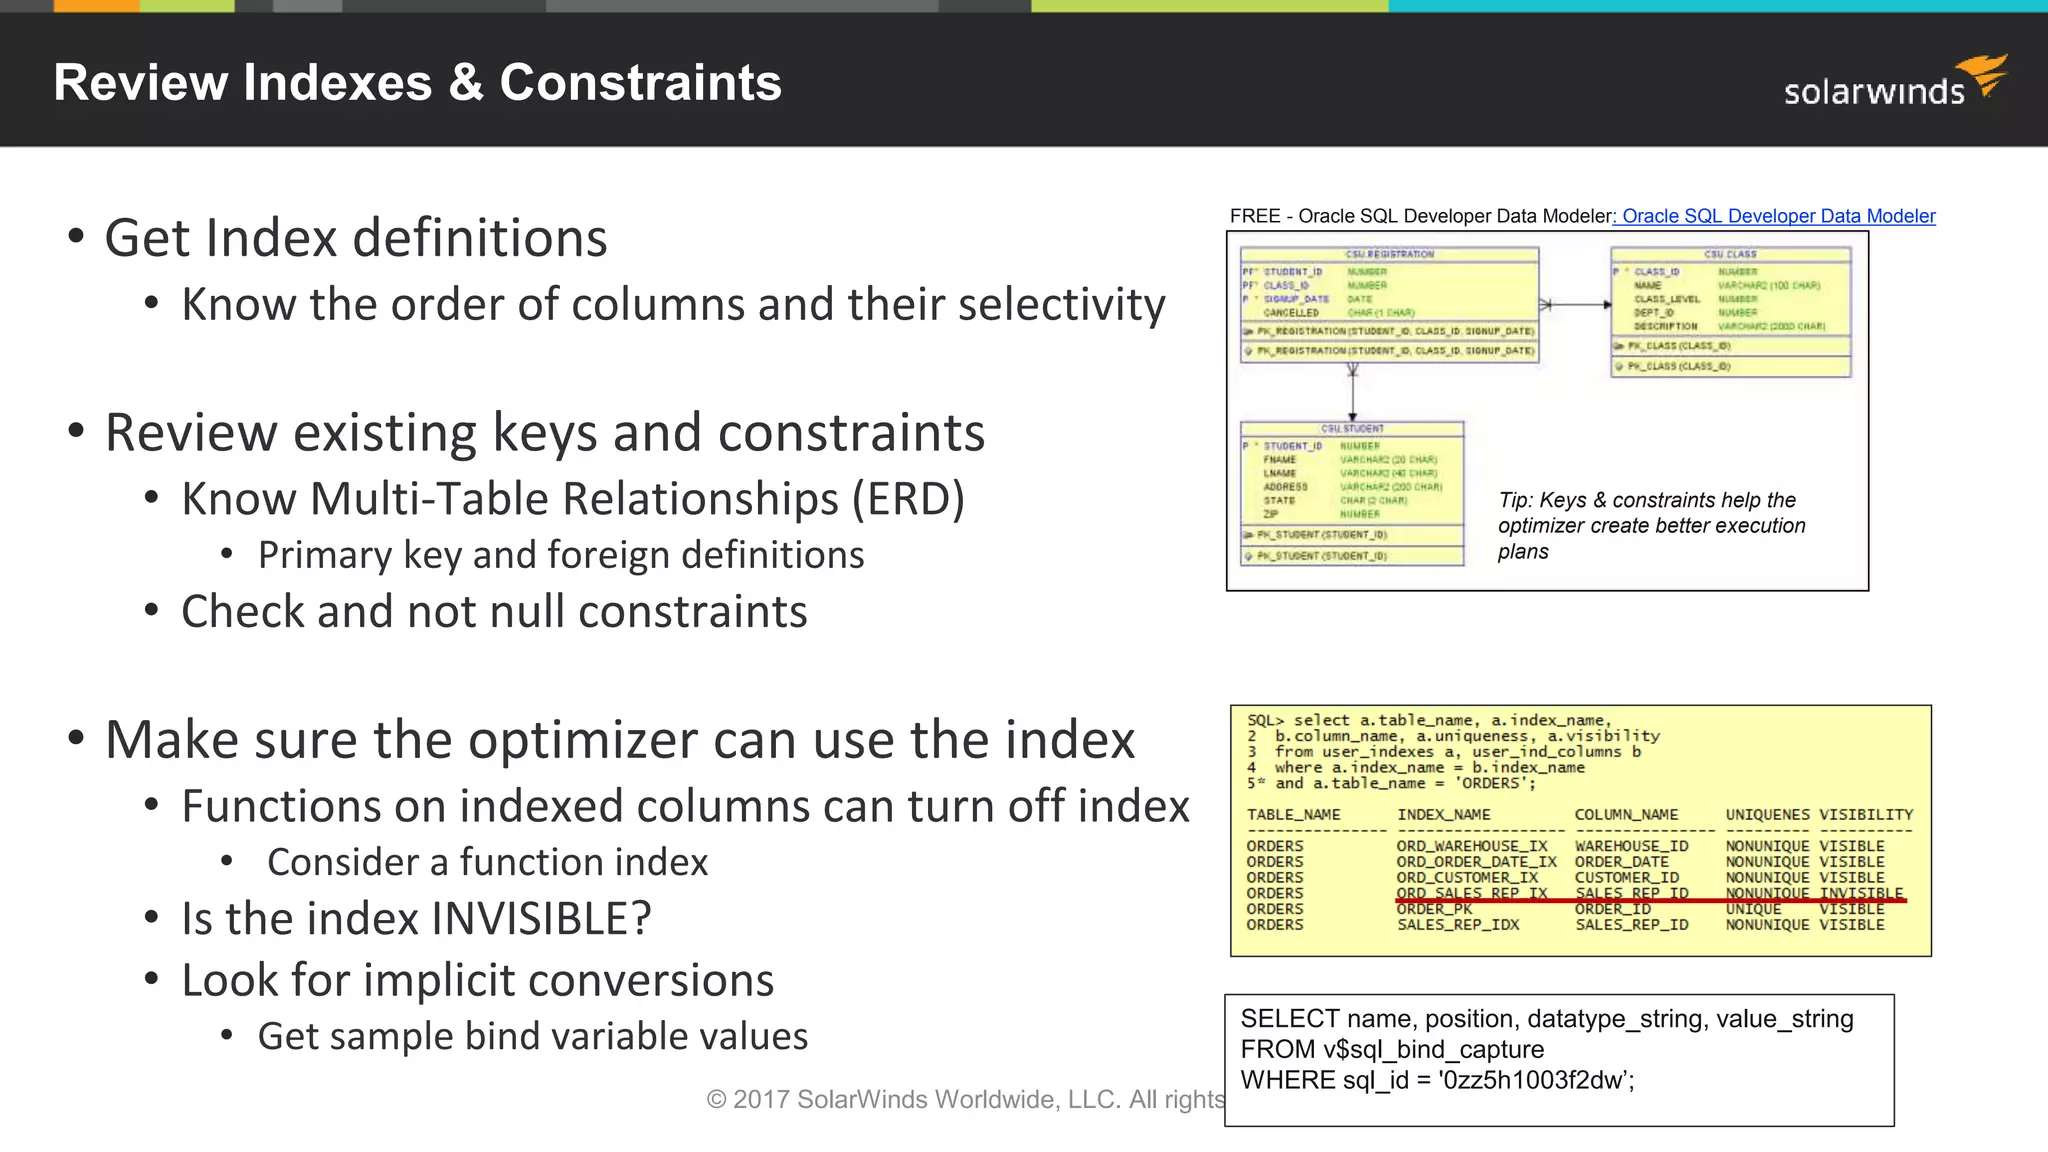
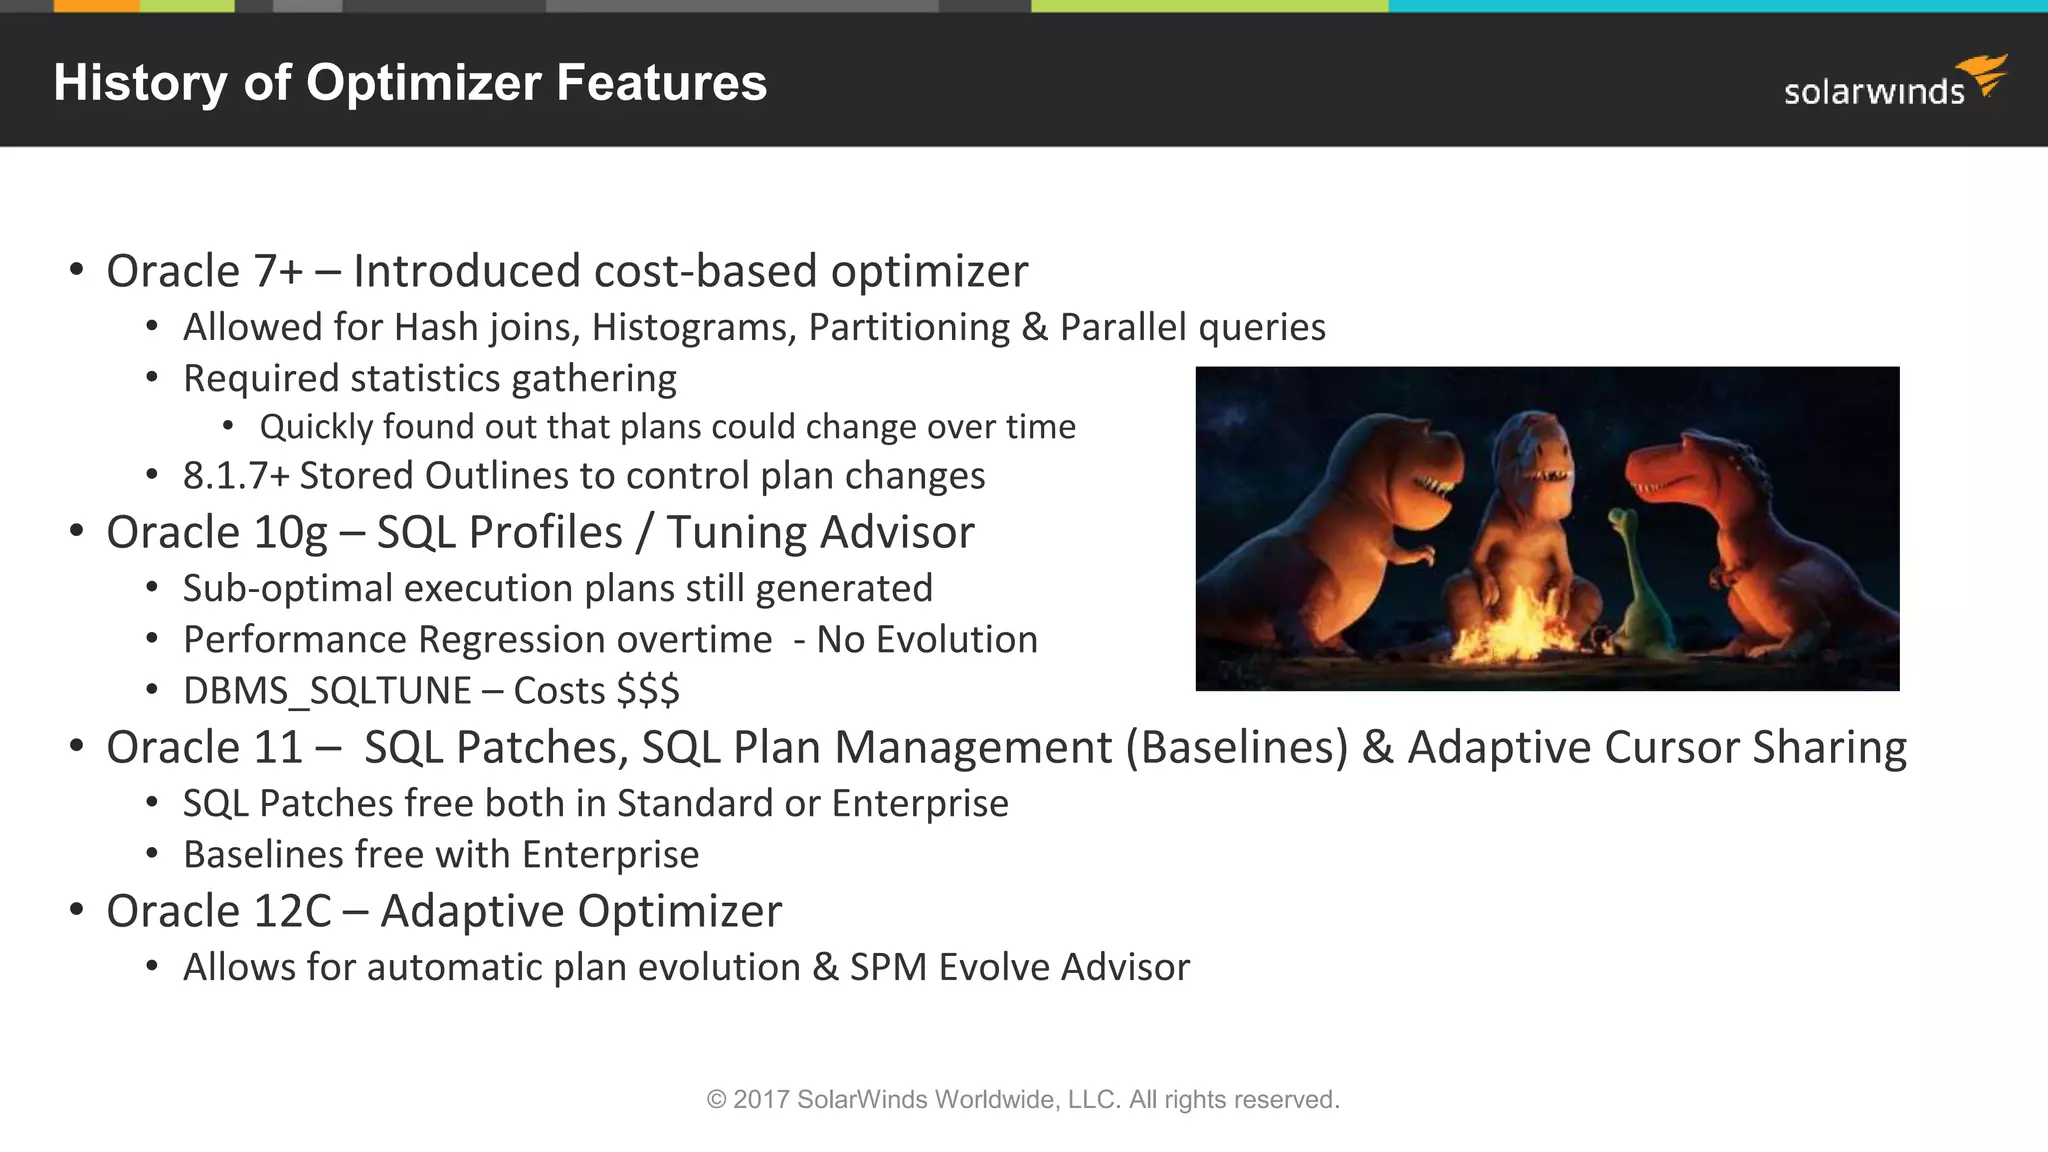
Identification of execution plan features, how to utilize SQL Plan Management and the evolution of optimizer features.
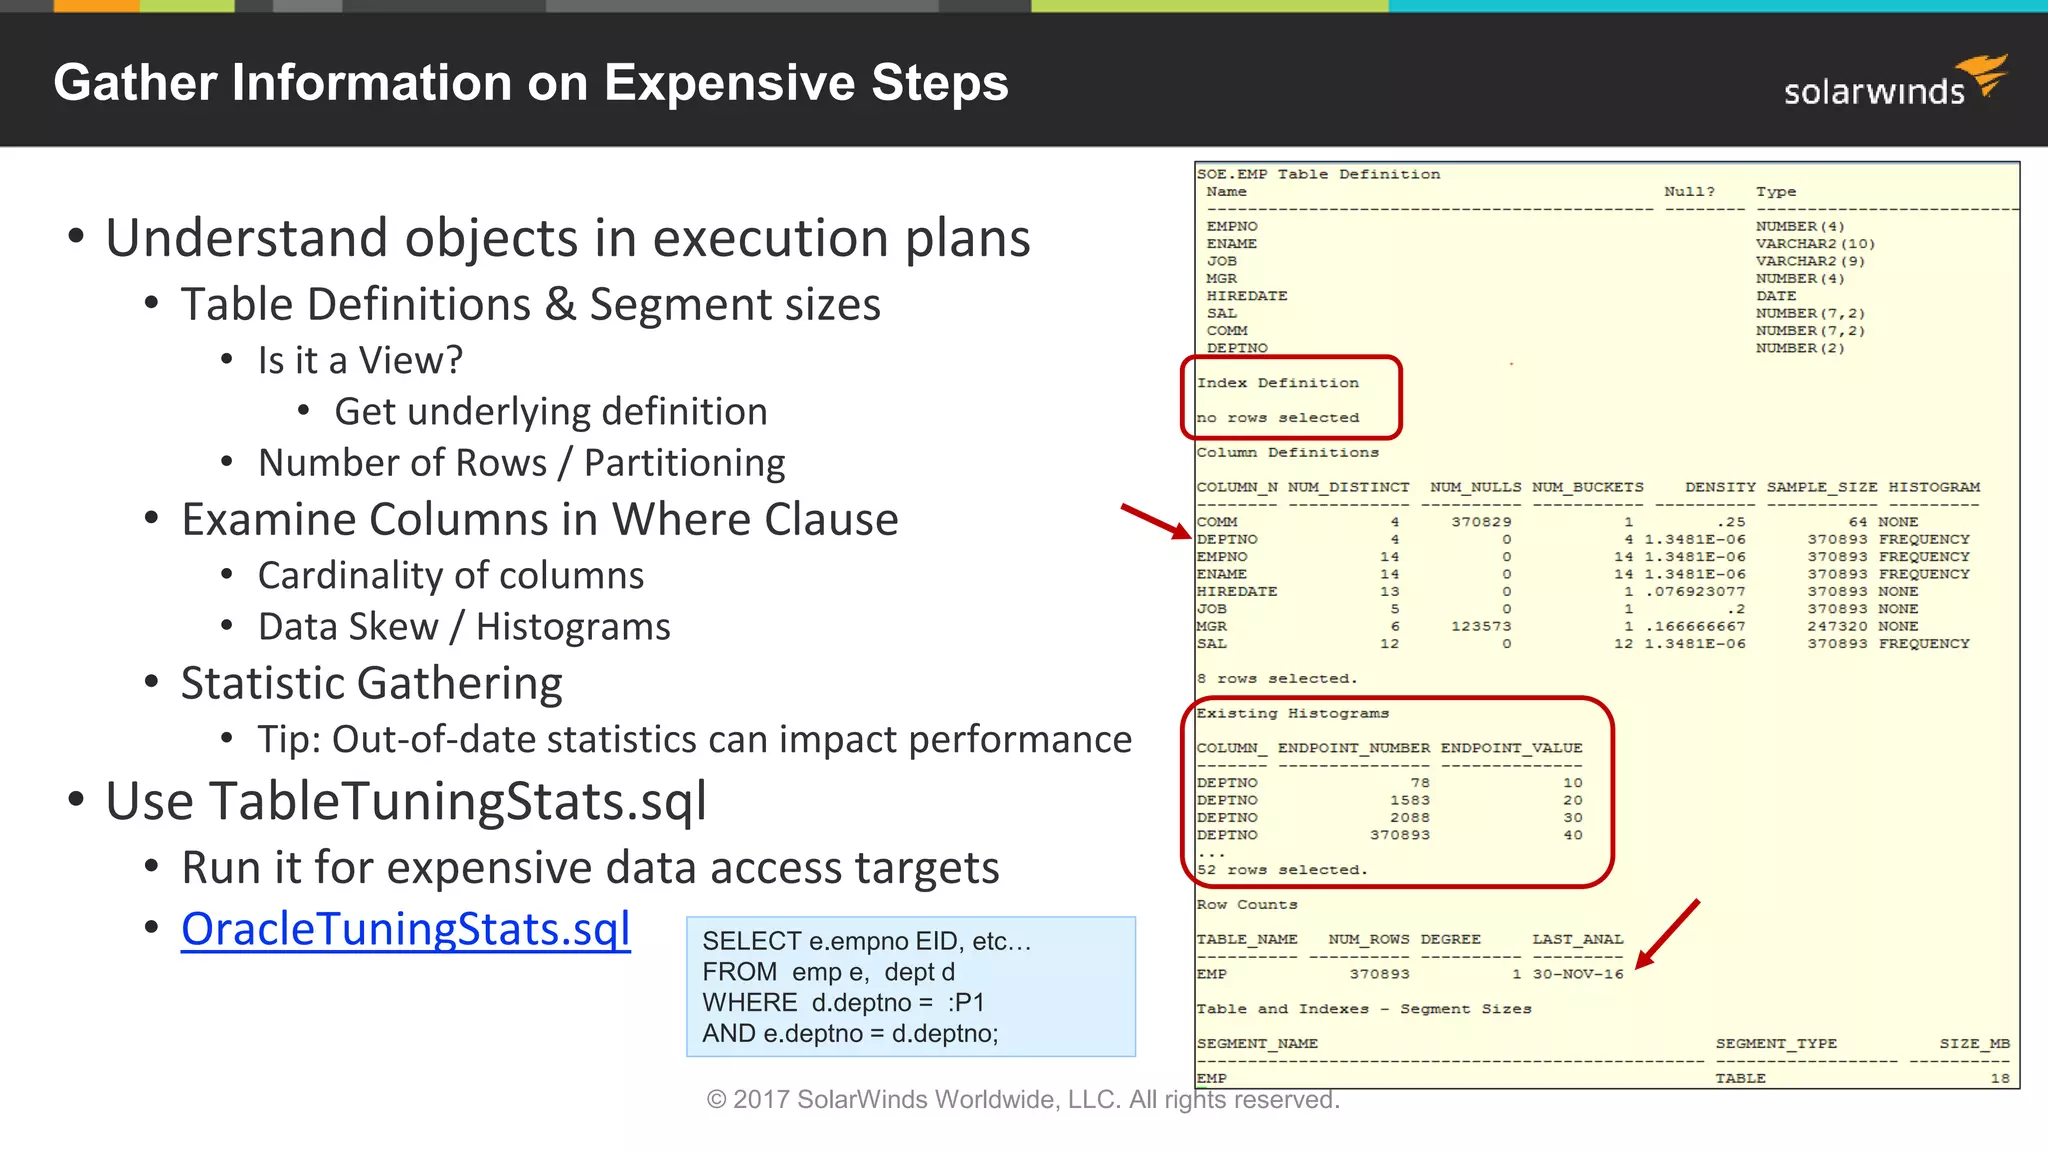
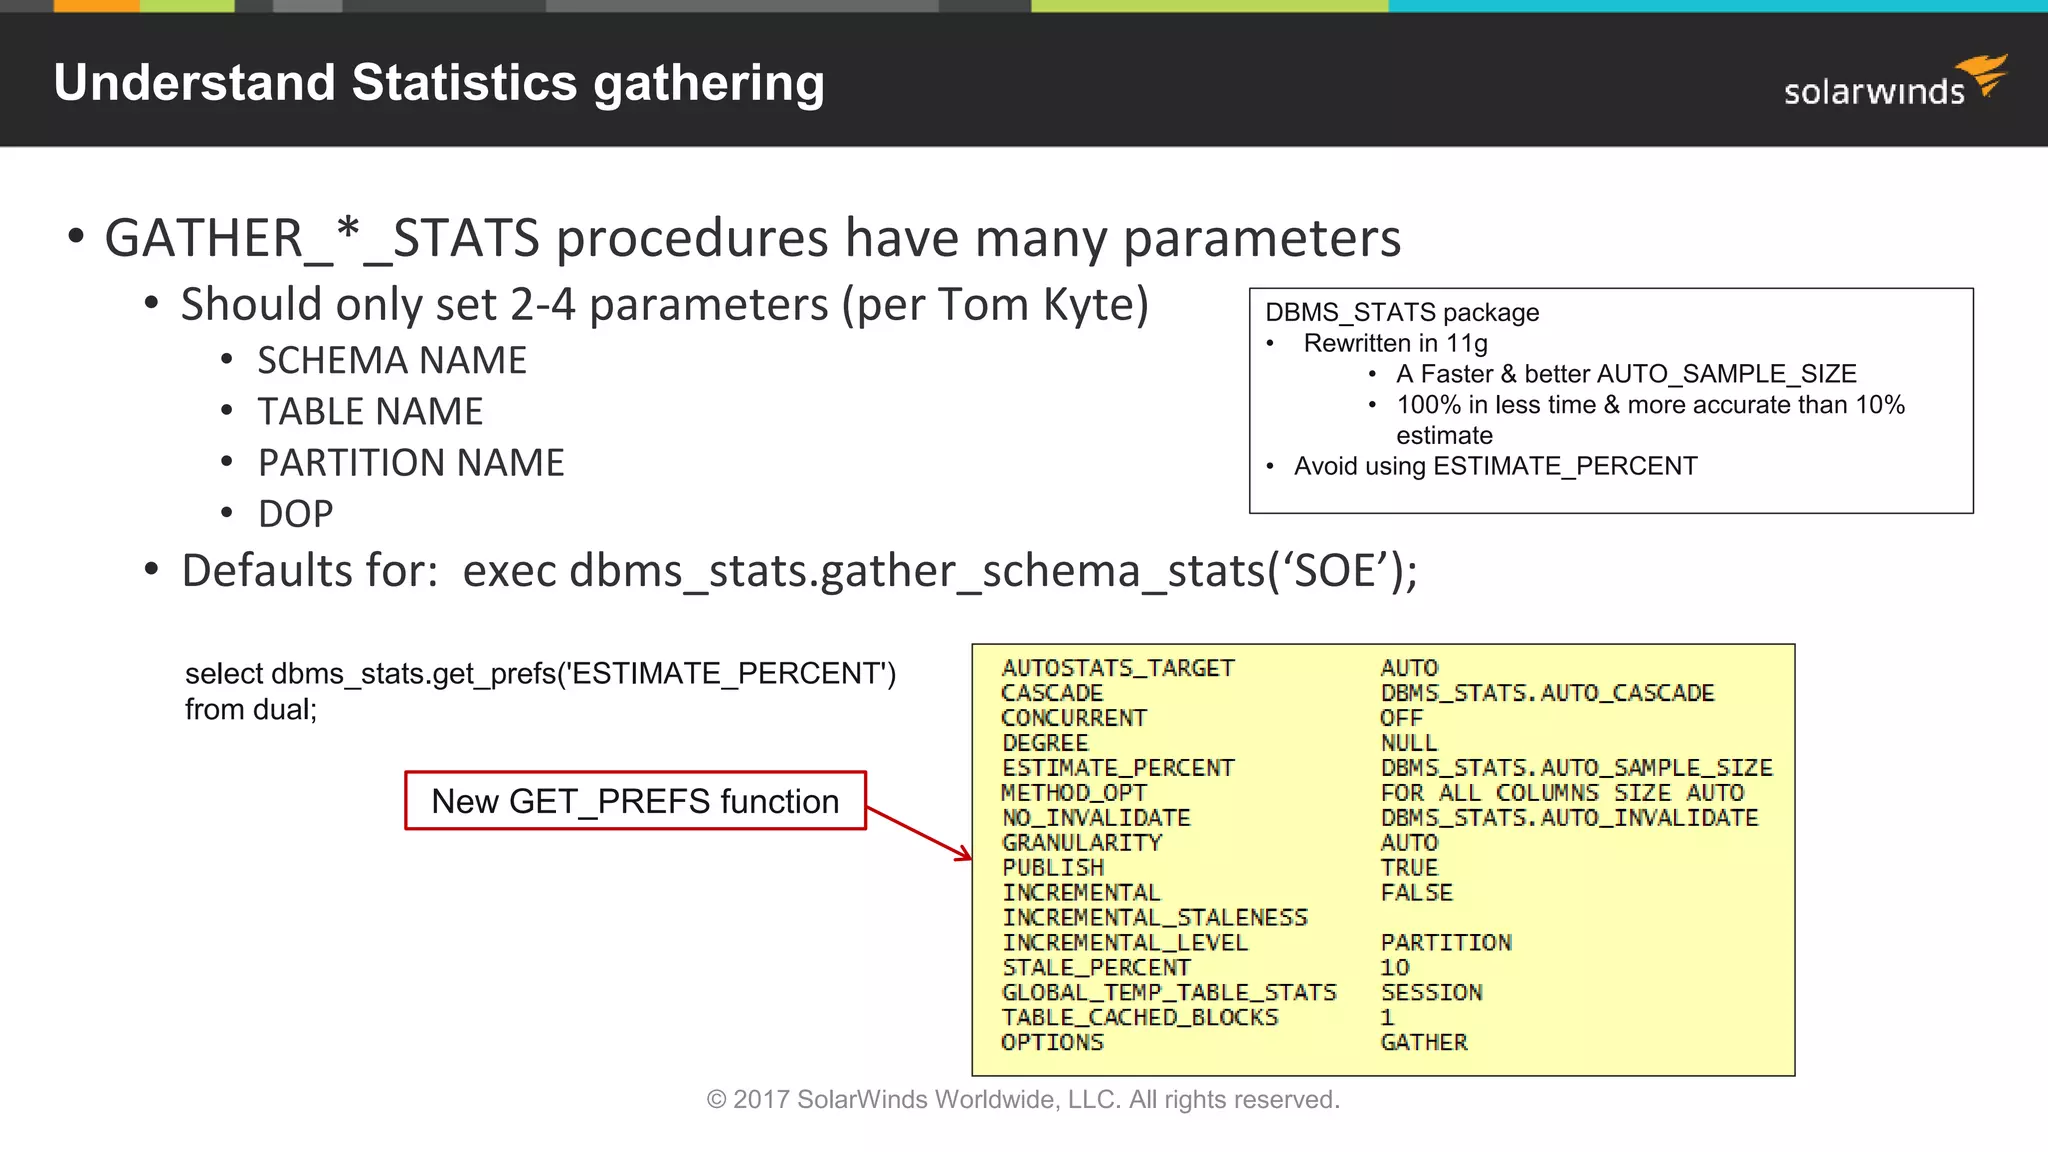
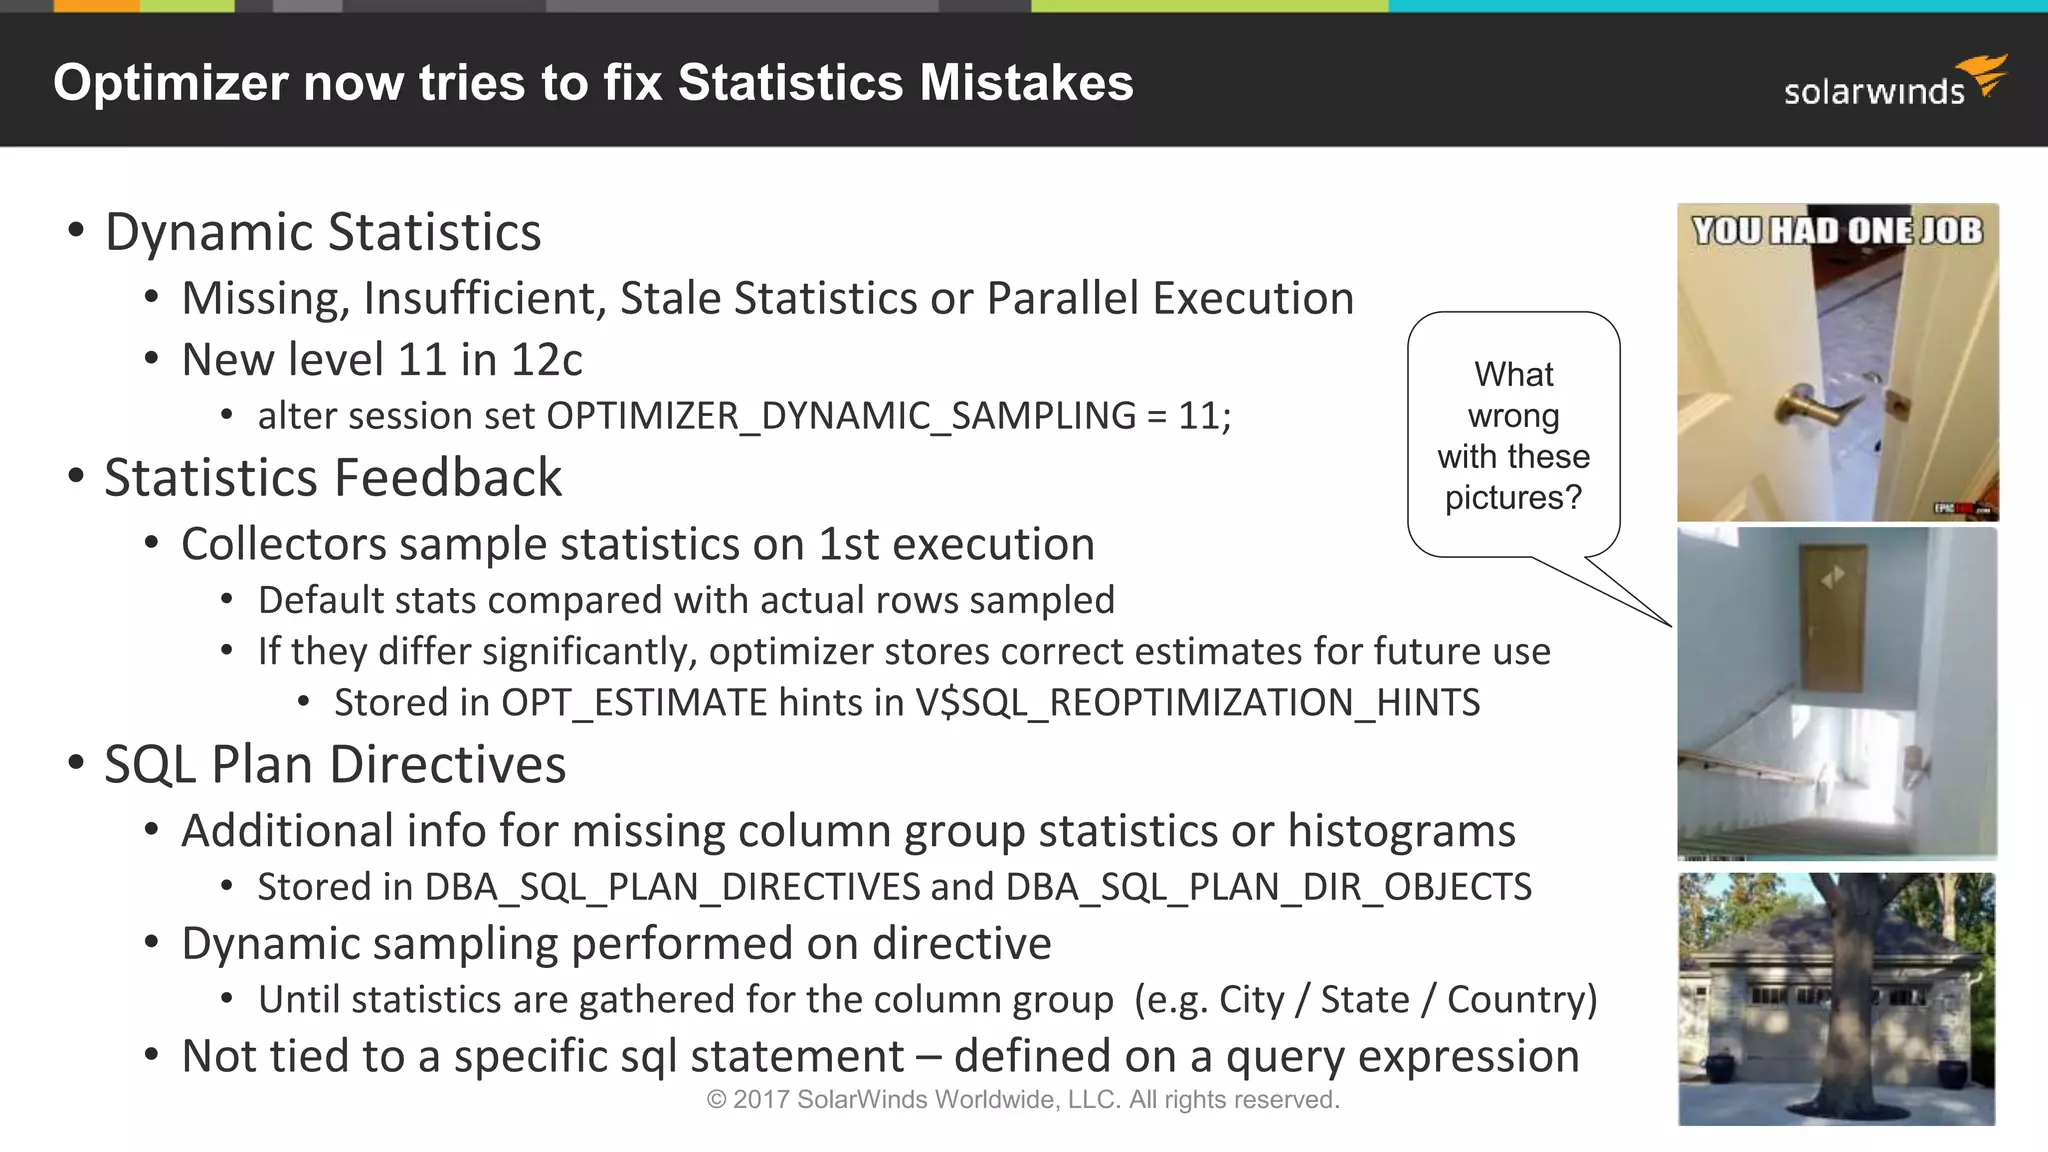
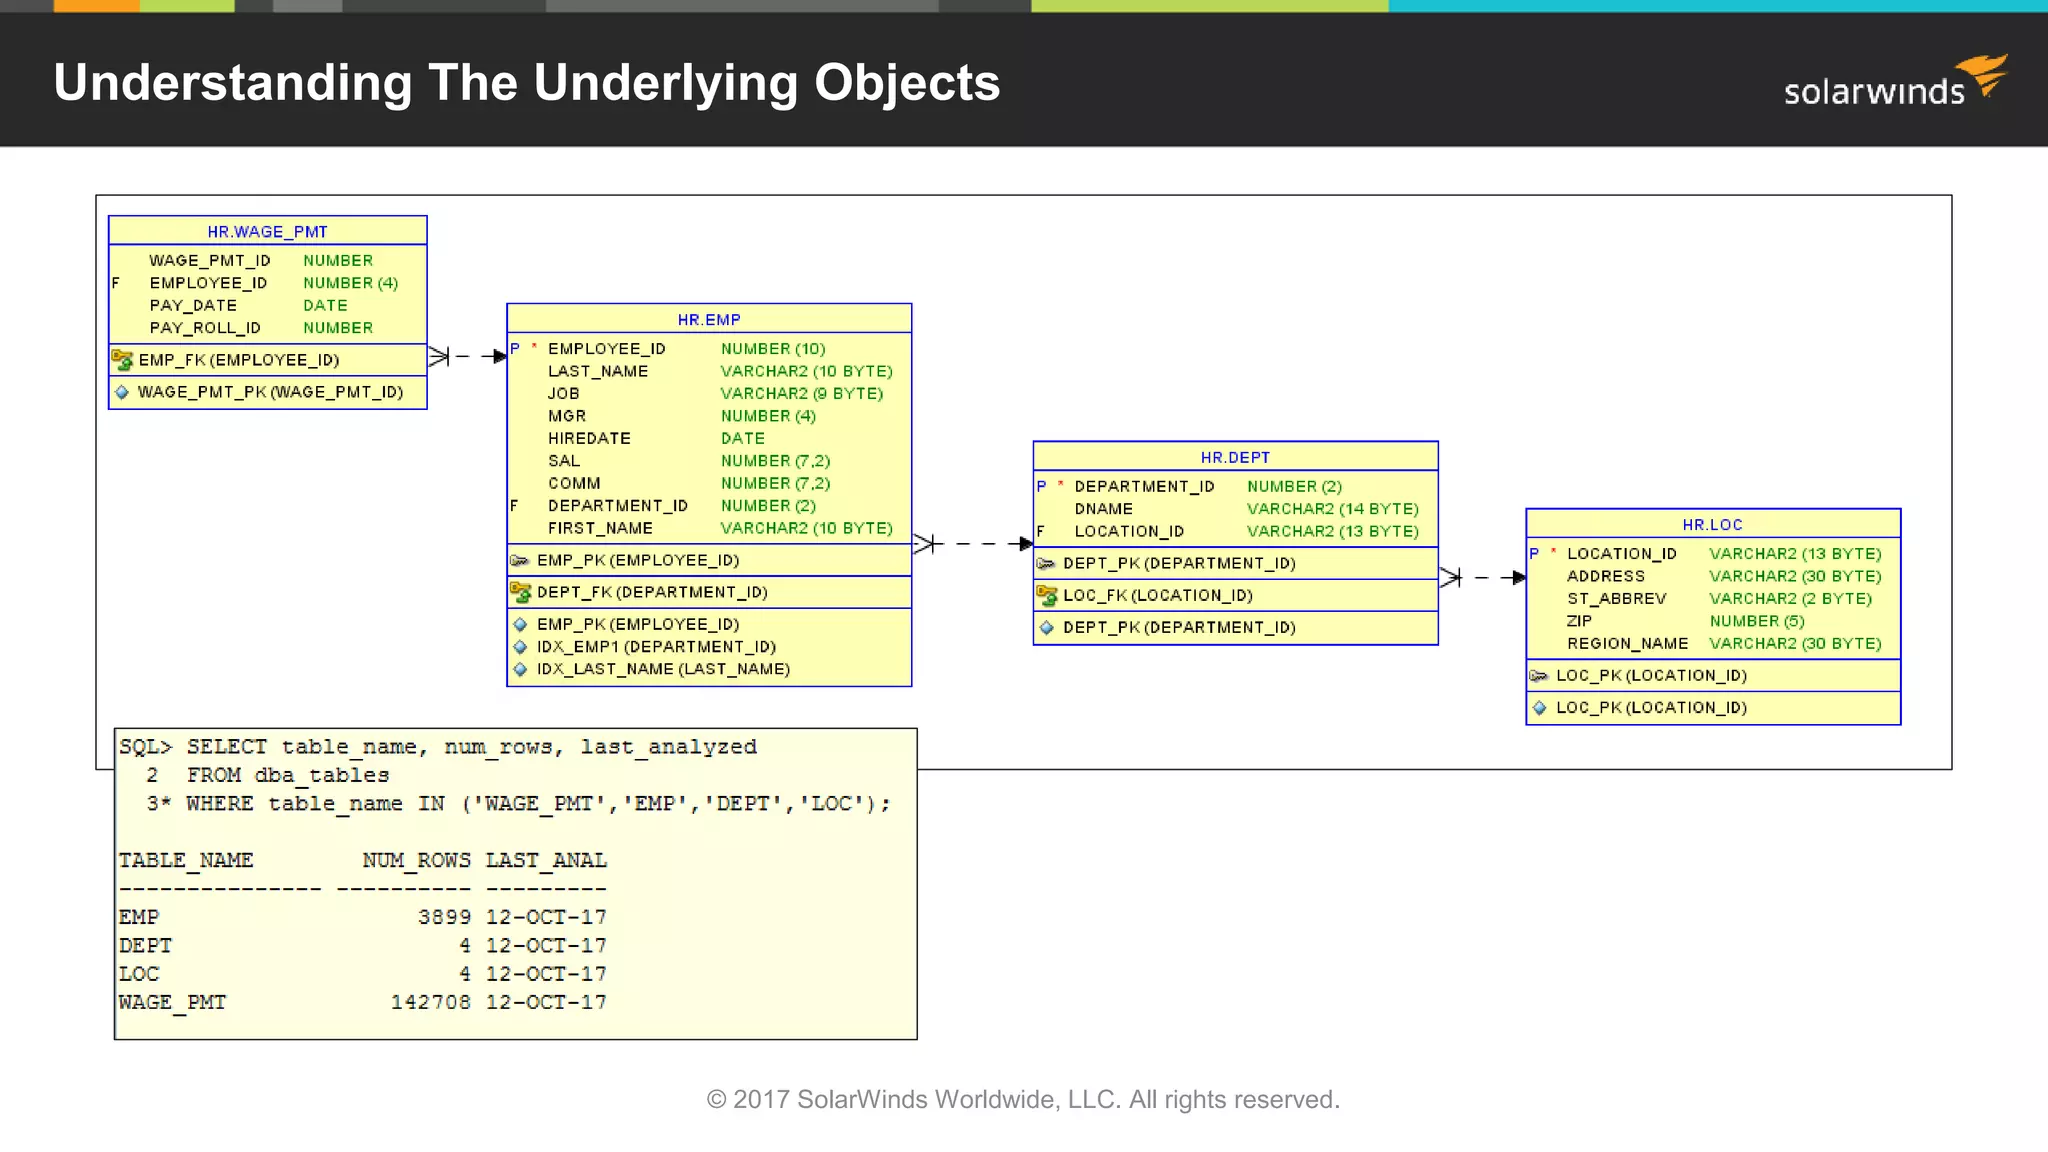
Focus on statistics gathering using Oracle's DBMS_STATS and the importance of accurate statistics for performance tuning.
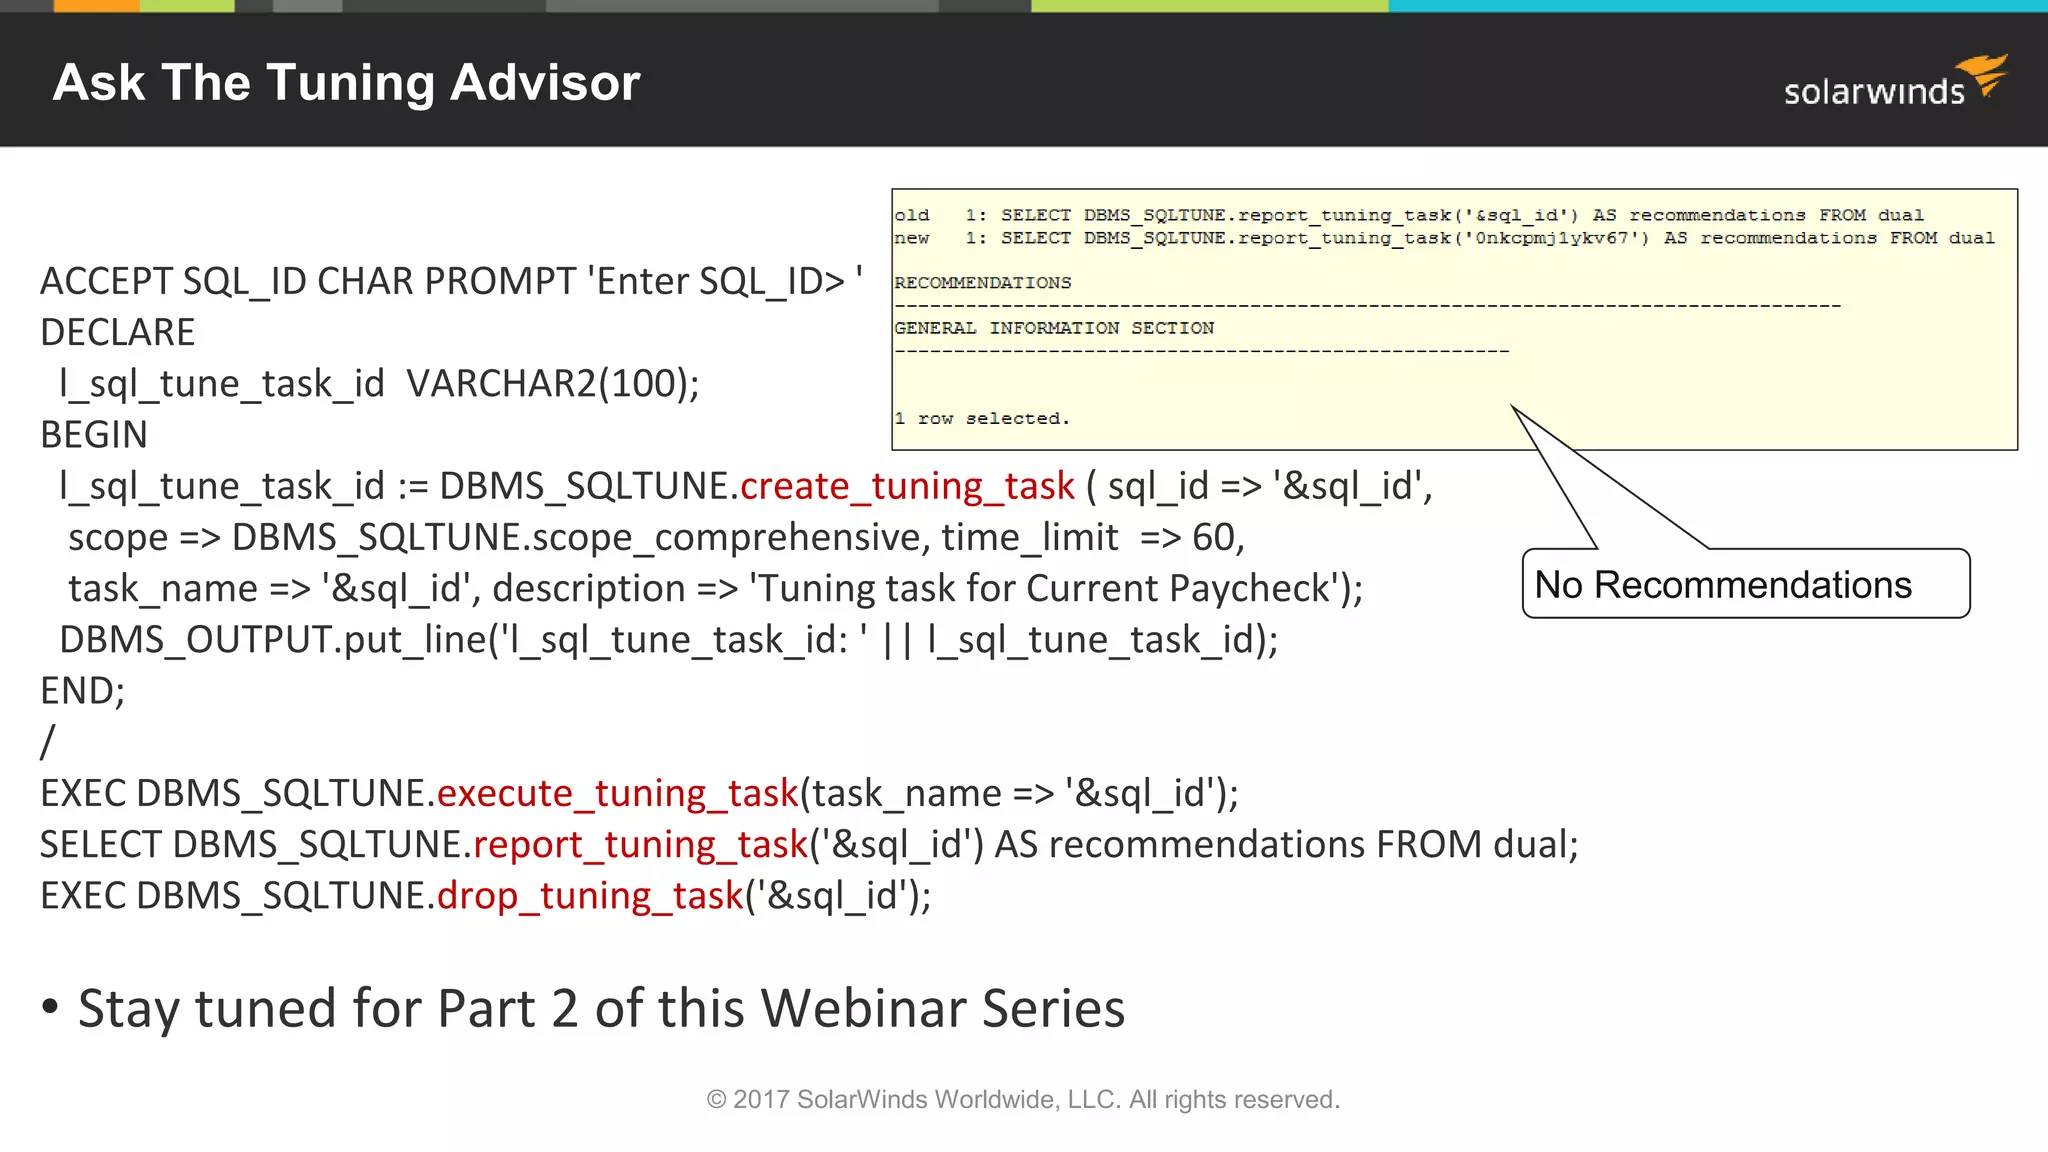
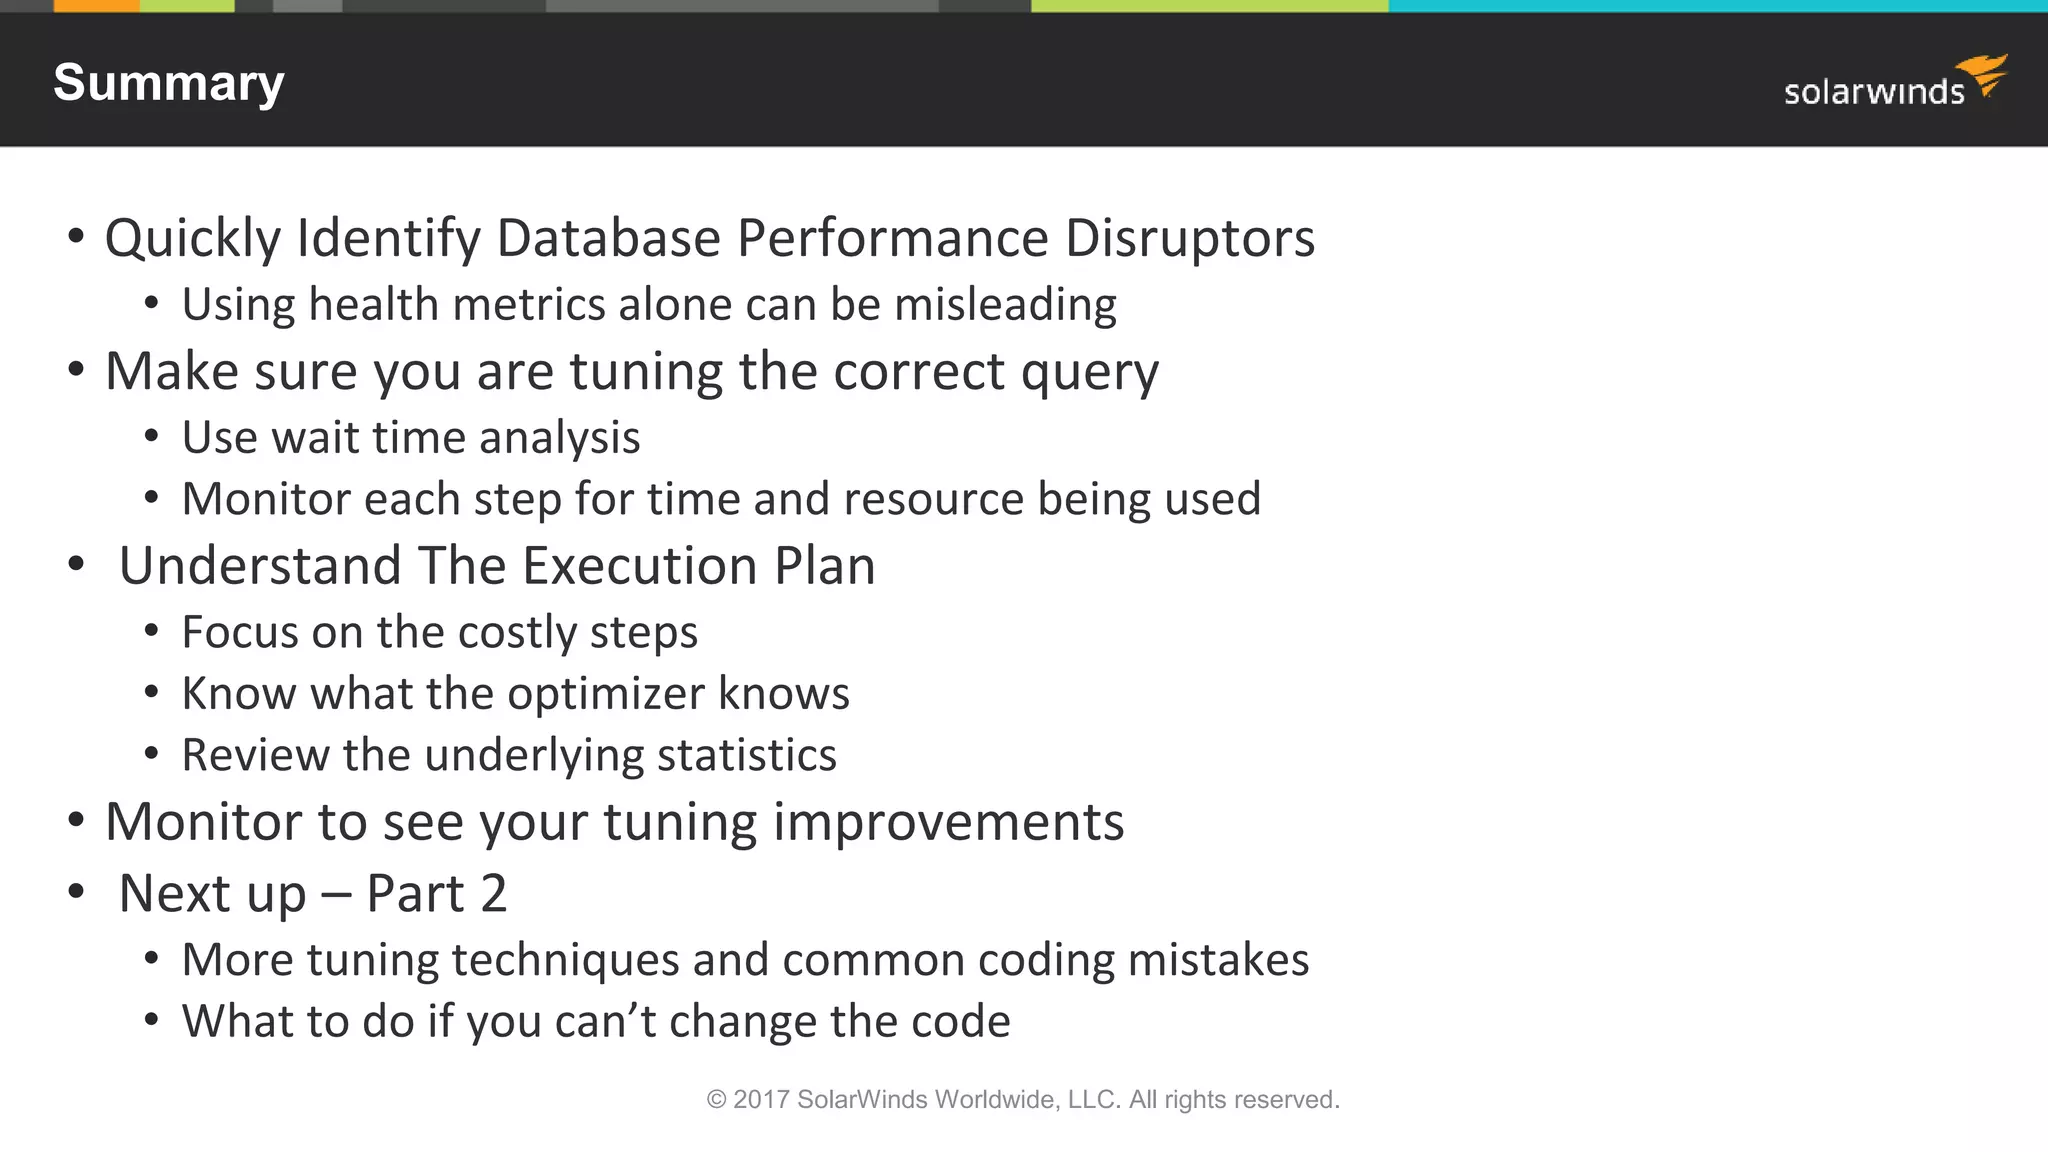
Overview of the tuning process, execution plan analysis, and monitoring improvements to ensure better query performance.
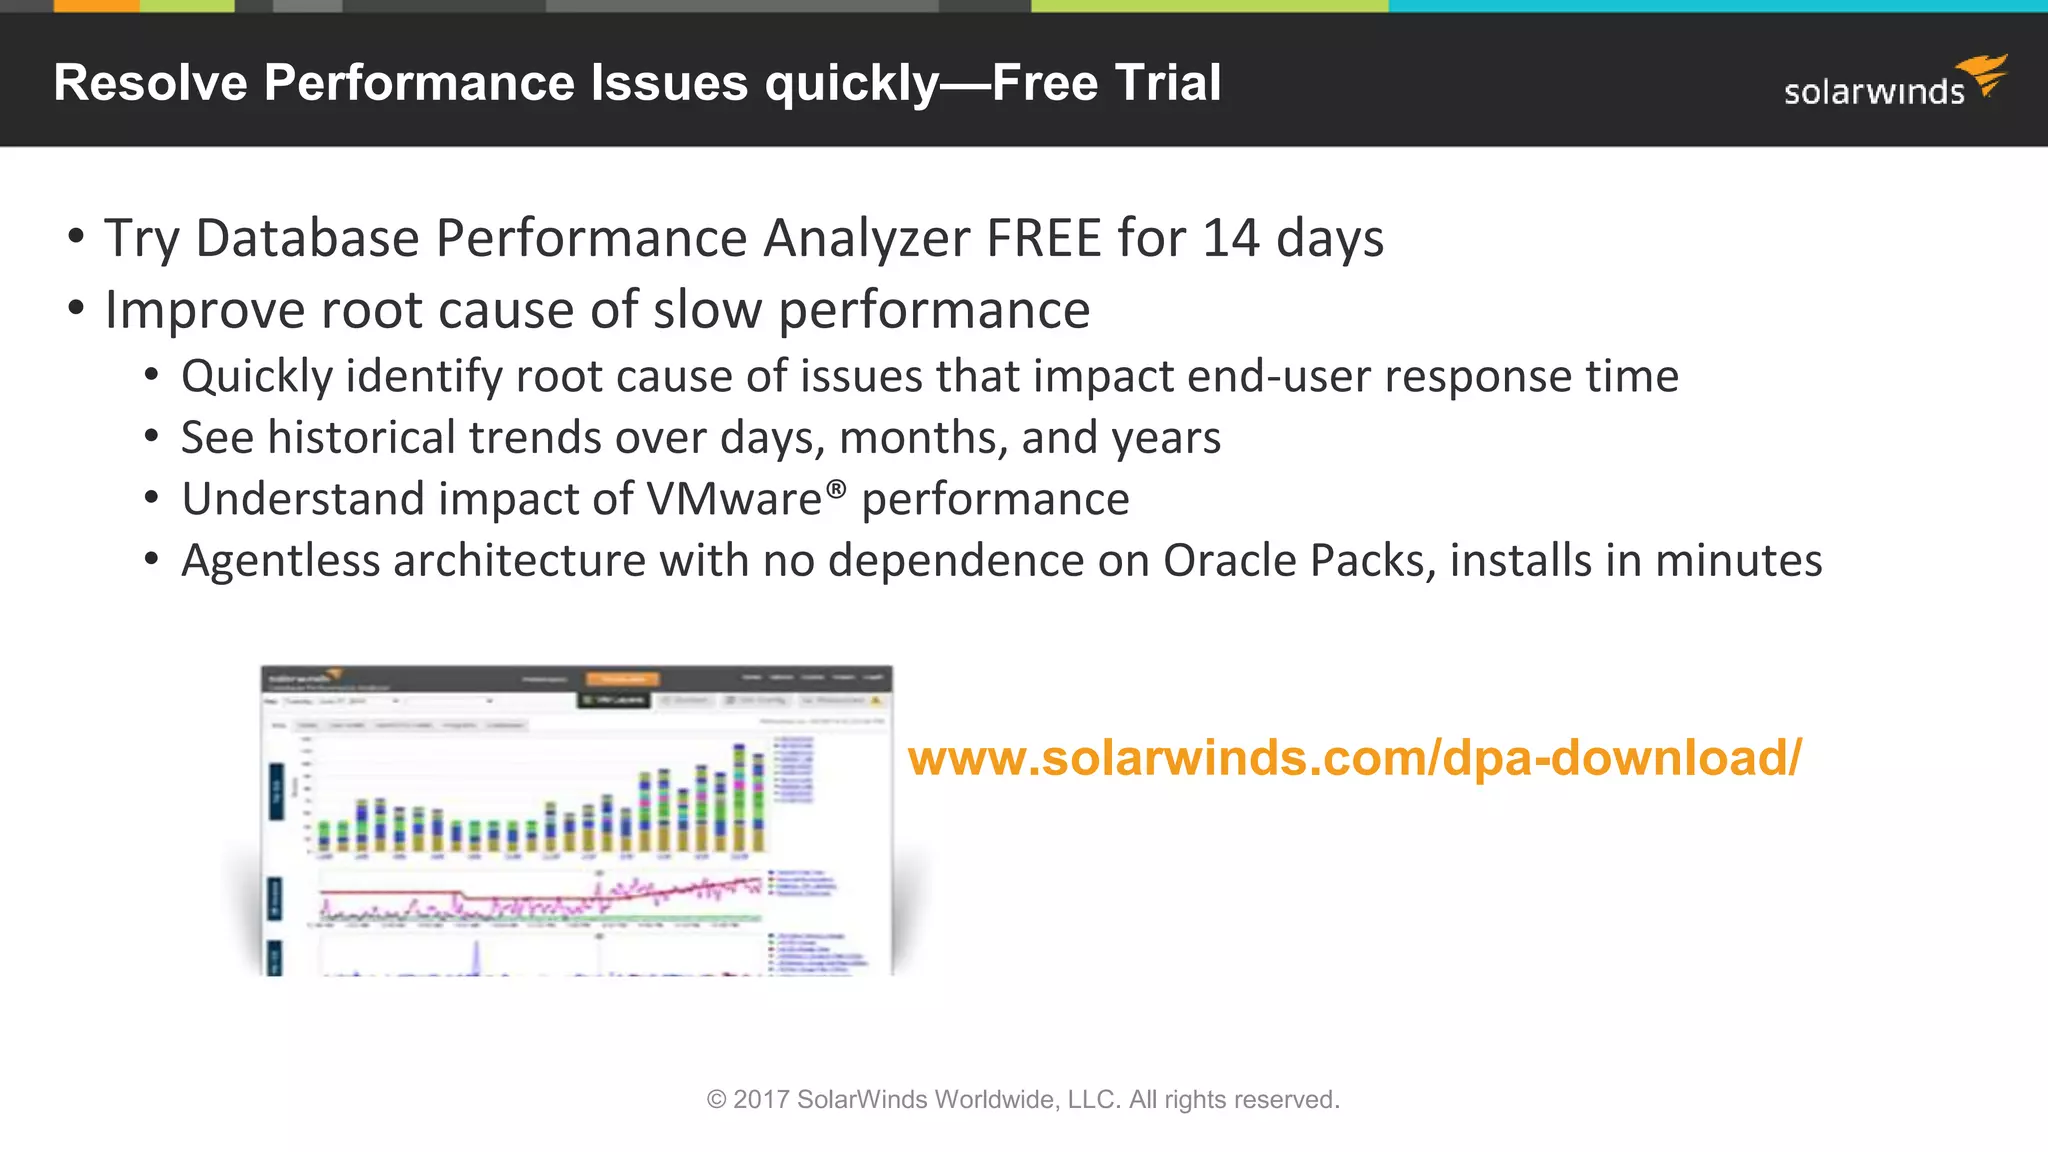
Encouragement to try SolarWinds tools for resolving database performance issues and a summary of the presentation.