I have data points — denoted by Fk— covering quite a large range $(1,\,10^{1010})$. I plotted them with ListLogPlot. Then I tried to fit the data points using NonlinearModelFit, and now I have two problems:
Fitting the data points
fit = NonlinearModelFit[Fk[300], a*k^(B*k), {a, B}, k]gives
1 k^1for the fitted model.However, fitting the data points with:
fit2 = NonlinearModelFit[Fk[300], a*k^(b*c*k), {a, b, c}, k]gives the fitted model
140.714 k^1.16997 kwhich I completely do not unterstand. I mean why should the output change upon inserting the variable $c$, which could also be combined with $b$ such that say $b\,c= B$ andfitshould be equal tofit2.If I now plot the data
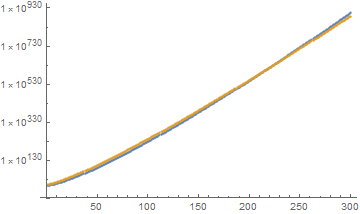
Fkvs.ktogether with the fitted model, the fitted curve ends at some value of $k \approx 120$, and I do not unterstand why. My code for this isShow[{ListLogPlot[Fk[300], PlotStyle -> Red], LogPlot[fit2[k], {k, 0, 300}]}]
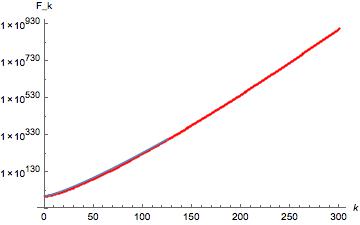
Red dots = data points; blue line = fitted curve
b*csince they're directly correlated into each other.) $\endgroup$WorkingPrecisionfor yourPlotfunction. $\endgroup$a=Fk[0]. (ii) If the fit is 1% off atk=300the absolute error is $10^{800}$ times larger than a 1000% error atk=50. That is, you probably want to specify weights to be some function ofFk. Finally, plotting works withExclusions -> None, see this bug. $\endgroup$