The document proposes a unified framework for iris recognition that addresses challenges in unconstrained acquisition, robust matching, and privacy. It uses random projections and sparse representations to select good quality iris images, recognize iris patterns in a single step, and introduce cancelable templates for enhanced privacy without compromising security or recognition performance. Experimental results on public datasets demonstrate benefits of the proposed approach for robust and accurate iris recognition.
![Secure and Robust Iris Recognition Using Random Projections and Sparse Representations Jaishanker K. Pillai, Student Member, IEEE, Vishal M. Patel, Member, IEEE, Rama Chellappa, Fellow, IEEE, and Nalini K. Ratha, Fellow, IEEE Abstract—Noncontact biometrics such as face and iris have additional benefits over contact-based biometrics such as fingerprint and hand geometry. However, three important challenges need to be addressed in a noncontact biometrics-based authentication system: ability to handle unconstrained acquisition, robust and accurate matching, and privacy enhancement without compromising security. In this paper, we propose a unified framework based on random projections and sparse representations, that can simultaneously address all three issues mentioned above in relation to iris biometrics. Our proposed quality measure can handle segmentation errors and a wide variety of possible artifacts during iris acquisition. We demonstrate how the proposed approach can be easily extended to handle alignment variations and recognition from iris videos, resulting in a robust and accurate system. The proposed approach includes enhancements to privacy and security by providing ways to create cancelable iris templates. Results on public data sets show significant benefits of the proposed approach. Index Terms—Iris recognition, cancelability, secure biometrics, random projections, sparse representations. Ç 1 INTRODUCTION IRIS recognition is one of the most promising approaches for biometric authentication [1]. Existing algorithms based on extracting and matching features from iris have reported very high recognition rates on clean data sets [2]. However, since these methods rely on the fine texture features extracted from the iris, their performances degrade significantly when the image quality is poor [1], [3]. This seriously limits the application of the iris recognition system in practical scenarios where the acquired image could be of low quality due to motion, partial cooperation, or the distance of the user from the scanner. When the acquisition conditions are not constrained, many of the acquired iris images suffer from defocus blur, motion blur, occlusion due to the eyelids, specular reflec- tions, and segmentation errors. Fig. 1 shows some of these distortions on images from the ICE2005 data set [3]. Hence, it is essential to first select the “recognizable” iris images before employing the recognition algorithm. Recently, Wright et al. [4] introduced a sparse representation-based face recognition algorithm, which outperforms many state-of-the-art algo- rithms when a sufficient number of training images are available. In this paper, we analyze the use of sparse representations for selection and recognition of iris images. We extend the original method [4] through a Bayesian fusion framework, where different sectors of the iris images are recognized separately using the above-mentioned technique and the results of different sectors are combined based on their quality. This is significantly faster than the original method as it facilitates parallelization and reduces the size of the dictionary size, as will become apparent. The performance of most existing iris recognition algorithms strongly depends on the effectiveness of the segmentation algorithm. Iris image segmentation normally involves identifying the ellipses corresponding to pupil and iris, and detecting the region inside these ellipses that is not occluded by the eyelids, eyelashes, and specular reflections. Unfortunately, in unconstrained scenarios, correctly seg- menting the iris images is extremely challenging [5]. The proposed selection algorithm removes input images with poorly segmented iris and pupil ellipses. Furthermore, since the introduced recognition scheme is robust to small levels of occlusions, accurate segmentation of eyelids, eyelashes, and specular reflections are no longer critical for achieving good recognition performance. Another important aspect in iris biometrics is the security and privacy of the users. When the texture features of one’s iris are stored in a template dictionary, a hacker could possibly break into the dictionary and steal these patterns. Unlike credit cards, which can be revoked and reissued, biometric patterns of an individual cannot be modified. So, directly using iris features for recognition is extremely vulnerable to attacks. To deal with this, the idea of cancellable iris biometrics has been introduced in [6], [7], IEEE TRANSACTIONS ON PATTERN ANALYSIS AND MACHINE INTELLIGENCE, VOL. 33, NO. 9, SEPTEMBER 2011 1877 . J.K. Pillai and R. Chellappa are with the Department of Electrical and Computer Engineering and Center for Automation Research (CfAR), University of Maryland, A.V. Williams Building, College Park, MD 20742-3275. E-mail: {jsp, rama}@umiacs.umd.edu. . V.M. Patel is with the Center for Automation Research, University of Maryland, A.V. Williams Building, Room 4415, College Park, MD 20742. E-mail: pvishalm@gmail.com. . N.K. Ratha is with IBM Research, 19 Skyline Drive, Hawthorne, NY 10532. E-mail: ratha@us.ibm.com. Manuscript received 2 Nov. 2009; revised 3 May 2010; accepted 18 Aug. 2010; published online 15 Feb. 2011. Recommended for acceptance by S. Belongie. For information on obtaining reprints of this article, please send e-mail to: tpami@computer.org, and reference IEEECS Log Number TPAMI-2009-11-0738. Digital Object Identifier no. 10.1109/TPAMI.2011.34. 0162-8828/11/$26.00 ß 2011 IEEE Published by the IEEE Computer Society](https://image.slidesharecdn.com/ieeeprotechnosolutions-ieeeembeddedprojectsecureandrobustirisrecognition-160128120857/75/Ieeepro-techno-solutions-ieee-embedded-project-secure-and-robust-iris-recognition-1-2048.jpg)
![[8], which can protect the original iris patterns as well as revoke and reissue new patterns when the old ones are lost or stolen. In this paper, we introduce two methods for incorporating security into the proposed iris recognition system, namely, random projections and random permuta- tions. Our methods can issue a different template for each application based on the original iris patterns of the person, generating a new template if the existing one is stolen while retaining the original recognition performance. The repre- sentation prevents extraction of significant information about the original iris patterns from cancelable templates. 1.1 Organization of the Paper The paper is organized as follows: In Section 2, we discuss some of the existing algorithms for iris image selection, recognition, and cancelability. The theory of sparse repre- sentation is summarized in Section 3. The Bayesian fusion framework for selecting and recognizing iris images is described in Section 4. We extend our method to video- based iris recognition in Section 5 and discuss how to handle alignment in Section 6. Two schemes for introducing cancelability into our framework are proposed in Section 7. Experiments and results are presented on simulated and real iris images in Section 8. We briefly outline future work and conclude in Section 9. 2 PREVIOUS WORK In this section, we briefly describe some of the existing methods for iris recognition, image quality estimation, and cancelability. 2.1 Iris Recognition The first operational automatic iris recognition system was developed by Daugman [9] in 1993, in which Gabor features were extracted from scale normalized iris regions and quantized to form a 2K bit iris code. The Hamming distance between the iris code of the test and the training iris images was used for recognition. Wildes [10] used Laplacian of a Gaussian filter at multiple scales to produce a template and used the normalized correlation as the similarity measure. In recent years, researchers have analyzed aspects like utilizing real-valued features for recognition, developing alternate ways of obtaining the binary codes, and combin- ing multiple features. See [1] for an excellent survey of recent efforts on iris recognition. Several studies have shown that accurate quality estima- tion can improve the performance either by rejecting the poor-quality images or by fusing the quality information during matching [1], [11], [12]. Rejection of poor-quality images is useful in numerous practical settings, as explained below: 1. A human-assisted recognition system in which a small fraction of the samples where the system has lower confidence is sent to a human expert or a more accurate recognition system. 2. An active acquisition system in which a new sample from the user is acquired if the originally captured one is of poor quality. 3. High security applications requiring very low false positives, where it is acceptable to reject a small number of poor-quality samples and deny access to individuals rather than obtain wrong results and provide access to unauthorized individuals. We review some of the existing iris image quality estimation schemes in iris literature below. Daugman used the energy of the high-frequency components as a measure of blur [9]. Proenca and Alexandre trained a neural network to identify common noise degradations in iris images [13]. Zhu et al. used the wavelet coefficients to evaluate the quality of iris images [14]. The Fourier spectra of local iris regions was used by Ma et al. to characterize blur and occlusion [15]. Rakshit and Monro used the quality and position of specular reflections for selecting good quality images [16]. With the exception of Daugman’s method, these algorithms are specialized for image selection, which requires a separate method for recognizing iris images. Also, these algorithms utilize some property of the iris image to measure image quality and cannot handle the wide variety of common artifacts, such as specular reflections and occlusion. In contrast to these methods, the image quality measure introduced in this paper can handle segmentation errors, occlusion, specular reflections, and blurred images. The proposed method also performs both selection and recognition in a single step. 2.2 Iris Recognition from Videos Though research in iris recognition has been extremely active in the past decade, most of the existing results are based on recognition from still iris images [17]. Multiple iris images have been used in the past to improve performance. Du [18] demonstrated higher rank one recognition rates by using three gallery images instead of one. Ma et al. [19] also enrolled three iris images and averaged the three Hamming distances to obtain the final score. Krischen et al. [20] used the minimum of the three Hamming distance as the final score. Schmid et al. [21] demonstrated that fusing the scores using log likelihood ratio gave superior performance when compared to average Hamming distance. Liu and Xie [22], and Roy and Bhattacharya [23] used multiple iris images for training classifiers. The distortions common in iris image acquisition-like occlusion due to eyelids, eye lashes, blur, and specular reflections will differ in various frames of the video. So by efficiently combining the different frames in the video, the performance could be improved. Temporal continuity in iris videos was used for improving the performance by Hollings- worth et al. [17]. The authors introduced a feature-level fusion by averaging the corresponding iris pixels and a score- level fusion algorithm combining all the pairwise matching 1878 IEEE TRANSACTIONS ON PATTERN ANALYSIS AND MACHINE INTELLIGENCE, VOL. 33, NO. 9, SEPTEMBER 2011 Fig. 1. Some poorly acquired iris images from the ICE data set [3]. Note that image (a) has specular reflections on the iris and is difficult to segment correctly due to the tilt and noncircular shape. Images (b) and (d) suffer from blurring, whereas image (c) is occluded by the shadow of the eyelids.](https://image.slidesharecdn.com/ieeeprotechnosolutions-ieeeembeddedprojectsecureandrobustirisrecognition-160128120857/75/Ieeepro-techno-solutions-ieee-embedded-project-secure-and-robust-iris-recognition-2-2048.jpg)
![scores. Though averaging reduces the noise and improves the performance, it requires images to be well segmented and aligned, which may often not be possible in a practical iris recognition system. We will introduce a quality-based matching score that gives higher weight to the evidence from good-quality frames, yielding superior performance even when some video frames are poorly acquired. 2.3 Cancelable Iris Biometrics The concept of cancelable biometrics was first introduced by Ratha et al. in [7], [8]. A cancelable biometric scheme intentionally distorts the original biometric pattern through a revocable and noninvertible transformation. The objec- tives of a cancelable biometric system are as follows [6]: . Different templates should be used in different applications to prevent crossmatching. . Template computation must be noninvertible to prevent unauthorized recovery of biometric data. . Revocation and reissue should be possible in the event of compromise. . Recognition performance should not degrade when a cancelable biometric template is used. In [24], Hash functions were used to minimize the compromise of the private biometric data of the users. Cryptographic techniques were applied in [25] to increase the security of iris systems. In [26], error correcting codes were used for cancelable iris biometrics. A fuzzy commit- ment method was introduced in [27]. Other schemes have also been introduced to improve the security of iris biometric. See [6], [24], [25], [26], [27], [28], and the references therein for more details. The pioneering work in the field of cancelable iris biometric was done by Zuo et al. [29]. They introduced four noninvertible and revocable transformations for cancelability. While the first two methods utilized random circular shifting and addition, the other two methods added random noise patterns to the iris features to transform them. As noted by the authors, the first two methods gradually reduce the amount of information available for recognition. Since they are essentially linear transforma- tions on the feature vectors, they are sensitive to outliers in the feature vector that arise due to eyelids, eye lashes, and specular reflections. They also combine the good and bad- quality regions in the iris image leading to lower perfor- mance. The proposed random projections-based cancel- ability algorithm works on each sector of the iris separately, so outliers can only affect the corresponding sectors and not the entire iris vector. Hence, it is more robust to common outliers in iris data when compared to [29]. 3 IRIS IMAGE SELECTION AND RECOGNITION Following [4], in this section, we briefly describe the use of sparse representations for the selection of good-quality iris images and their subsequent recognition. 3.1 Sparse Representations Suppose that we are given L distinct classes and a set of n training iris images per class. We extract an N-dimen- sional vector of Gabor features from the iris region of each of these images. Let Dk ¼ ½xk1; . . . ; xkj; . . . ; xknŠ be an N Â n matrix of features from the kth class, where xkj denote the Gabor feature from the jth training image of the kth class. Define a new matrix or dictionary D, as the concatenation of training samples from all the classes as D ¼ ½D1; . . . ; DLŠ 2 IRNÂðn:LÞ ¼ ½x11; . . . ; x1njx21; . . . ; x2nj . . . . . . jxL1; . . . ; xLnŠ: We consider an observation vector y 2 IRN of unknown class as a linear combination of the training vectors as y ¼ XL i¼1 Xn j¼1 ijxij ð1Þ with coefficients ij 2 IR. The above equation can be written more compactly as y ¼ D; ð2Þ where ¼ ½11; . . . ; 1nj21; . . . ; 2nj . . . . . . jL1; . . . ; LnŠT ; ð3Þ and :T denotes the transposition operation. We assume that given sufficient training samples of the kth class, Dk, any new test image y 2 IRN that belongs to the same class will lie approximately in the linear span of the training samples from the class k. This implies that most of the coefficients not associated with class k in (3) will be close to zero. Hence, is a sparse vector. 3.2 Sparse Recovery In order to represent an observed vector y 2 IRN as a sparse vector , one needs to solve the system of linear equations (2). Typically, L:n ) N and hence the system of linear equations (2) is underdetermined and has no unique solution. It has been shown that if is sparse enough and D satisfies certain properties, then the sparsest can be recovered by solving the following optimization problem [30], [31], [32], [33]: ^ ¼ arg min 0 k 0 k1 subject to y ¼ D0 ; ð4Þ where k x k1¼ P i jðxiÞj. This problem is often known as Basis Pursuit (BP) and can be solved in polynomial time [34].1 When noisy observations are given, Basis Pursuit DeNoising (BPDN) can be used to approximate ^ ¼ arg min 0 k 0 k1 subject to ky À D0 k2 ; ð5Þ where we have assumed that the observations are of the following form: y ¼ D þ ð6Þ with k k2 . Finally, in certain cases, greedy algorithms such as orthogonal matching pursuit [35] can also be used to recover sparse images. Such an algorithm for face recogni- tion has been proposed in [36]. PILLAI ET AL.: SECURE AND ROBUST IRIS RECOGNITION USING RANDOM PROJECTIONS AND SPARSE REPRESENTATIONS 1879 1. Note that the ‘1 norm is an approximation of the the ‘0 norm. The approximation is necessary because the optimization problem in (4) with the ‘0 norm (which seeks the sparsest ) is NP-hard and computationally difficult to solve.](https://image.slidesharecdn.com/ieeeprotechnosolutions-ieeeembeddedprojectsecureandrobustirisrecognition-160128120857/75/Ieeepro-techno-solutions-ieee-embedded-project-secure-and-robust-iris-recognition-3-2048.jpg)
![3.3 Sparse Recognition Given an observation vector y from one of the L classes in the training set, we compute its coefficients ^ by solving either (4) or (5). We perform classification based on the fact that high values of the coefficients ^ will be associated with the columns of D from a single class. We do this by comparing how well the different parts of the estimated coefficients, ^, represent y. The minimum of the representa- tion error or the residual error is then used to identify the correct class. The residual error of class k is calculated by keeping the coefficients associated with that class and setting the coefficients not associated with class k to zero. This can be done by introducing a characteristic function, Åk : IRn ! IRn , that selects the coefficients associated with the kth class as follows: rkðyÞ ¼ ky À DÅkð^Þk2: ð7Þ Here, the vector Åk has value one at locations corresponding to the class k and zero for other entries. The class, d, which is associated with an observed vector is then declared as the one that produces the smallest approximation error: d ¼ arg min k rkðyÞ: ð8Þ We now summarize the sparse recognition algorithm as follows: Given a matrix of training samples D 2 IRNÂðn:LÞ for L classes and a test sample y 2 IRN : 1. Solve the BP (4) or BPDN (5) problem. 2. Compute the residual using (7). 3. Identify y using (8). 3.4 Image Quality Measure For classification, it is important to be able to detect and then reject the test samples of poor quality. To decide whether a given test sample has good quality, we use the notion of Sparsity Concentration Index (SCI) proposed in [4]. The SCI of a coefficient vector 2 IRðL:nÞ is defined as SCIðÞ ¼ L: max kÅiðÞk1 kk1 À 1 L À 1 : ð9Þ SCI takes values between 0 and 1. SCI values close to 1 correspond to the case where the test image can be approximately represented by using only images from a single class. The test vector has enough discriminating features of its class, so has high quality. If SCI ¼ 0, then the coefficients are spread evenly across all classes. So the test vector is not similar to any of the classes and is of poor quality. A threshold can be chosen to reject the iris images with poor quality. For instance, a test image can be rejected if SCIð^Þ and otherwise accepted as valid, where is some chosen threshold between 0 and 1. 4 BAYESIAN FUSION-BASED IMAGE SELECTION AND RECOGNITION Different regions of the iris have different qualities [11]. So instead of recognizing the entire iris image directly, we recognize the different regions separately and combine the results depending on the quality of the region. This reduces the computational complexity of the above method as the size of the dictionary is greatly reduced, and the recognition of the different regions can be done in parallel. Also, since occlusions affect only local regions on the iris which can only lower the quality of certain regions, the robustness of the recognition algorithm to occlusion due to eyelids and eye lashes is improved. A direct way of doing this would be to recognize the sectors separately and combine the results by voting [37]. This, however, does not account for the fact that different regions are recognized with different confidences. In what follows, we propose a score-level fusion approach for recognition where we combine the recognition results of different sectors based on the recognition confidence using the corresponding SCI values. Fig. 2 illustrates the different steps involved in the proposed approach. Consider the iris recognition problem with L distinct classes. Let C ¼ fc1; c2; . . . ; cLg be the class labels. Let y be the test vector whose identity is to be determined. Let us divide the vector y into ^M nonoverlapping regions, each called a sector. Each of the sectors is individually solved using the sparse representation-based recognition algorithm dis- cussed in Section 3. The sectors with SCI values below the threshold are rejected. Let M be the number of sectors retained, where M ^M. Let d1; d2; . . . ; dM be the class labels of the retained sectors. Ideally, if the data are noise-free, all the returned labels will be equal to the true label c. That is, d1 ¼ d2 ¼ Á Á Á ¼ dM ¼ c: However, in the presence of noise in the training and test iris images, the returned labels will not necessarily be the same. Let IPðdijcÞ be the probability of the ith sector returns a label di when the true class is c. It is reasonable to assume that the probability of the recognition system returning the true label c is high. But, given the noise in the iris images, all of the classes other than c will still have a low probability of being identified as the true class. SCI is a measure of the confidence in recognition, so the higher the SCI value, the higher the probability that the true class will be the same as 1880 IEEE TRANSACTIONS ON PATTERN ANALYSIS AND MACHINE INTELLIGENCE, VOL. 33, NO. 9, SEPTEMBER 2011 Fig. 2. A block diagram illustrating the Bayesian Fusion-based image selection and recognition.](https://image.slidesharecdn.com/ieeeprotechnosolutions-ieeeembeddedprojectsecureandrobustirisrecognition-160128120857/75/Ieeepro-techno-solutions-ieee-embedded-project-secure-and-robust-iris-recognition-4-2048.jpg)
![Let eijk be the sum of squared error between the ith matched filter impulse response and the jth training image of the kth class. eijk ¼ khi À xkjk2 2: ð20Þ The alignment error associated with the ith alignment is computed as ei ¼ min k¼1;2;...L;j¼1;2;...n eijk: ð21Þ The top K alignments are selected as the ones producing the least alignment error ei. 6.2 Score Estimation Robust to Alignment Errors From each test vector y, we can generate K new test vectors by shifting it according to the corresponding alignments obtained from the method described above. So instead of the J original frames in the video, we now have JK frames. Using arguments similar to the ones in the previous section, we can obtain the CSCI of the lth class cl as CSCIðclÞ ¼ PJK i¼1 PMi j¼1 SCI À di j Á : À di j ¼ cl Á PJK i¼1 PMi j¼1 SCIðdi jÞ ; ð22Þ where Mi are the number of sectors retained in the ith frame. The MAP estimate of the output class is the one with the highest CSCI value. Note that this score estimation handles the global alignment errors and not the local deformations in the iris pattern. Since our method weighs different sectors based on their quality, sectors having significant local deformations will not have high influence on the final CSCI value due to their lower quality. 7 SECURE IRIS BIOMETRIC For a biometric system to be deployed successfully in a practical application, ensuring security and privacy of the users is essential. In this section, we propose two cancelable methods to improve security of our recognition system. 7.1 Cancelability through Random Projections The idea of using Random Projections (RPs) for cancel- ability in biometrics has been previously introduced in [28], [38], [39]. In [28] and [38], RPs of discriminative features were used for cancelability in face biometrics. RPs on different regions of the iris were applied for cancel- ability in [39]. In what follows, we show how RPs can be extended into the sparse representation-based approach for ensuring cancelability, as illustrated in Fig. 4. Let È be an m  N random matrix with m N such that each entry i;j of È is an independent realization of q, where q is a random variable on a probability measure space ð; Þ. Consider the following observations: a ¼ : Èy ¼ ÈD þ 0 ; ð23Þ where 0 ¼ È with k 0 k2 0 . a can be thought of as a transformed version of the biometric y. One must recover the coefficients to apply the sparse recognition method explained in Section 3. As m is smaller than N, the system of equations (23) is underdetermined and a unique solution of is not available. Given the sparsity of , one can approximate by solving the BPDN problem. It has been shown that for sufficiently sparse and under certain conditions on ÈD, the solution to the following optimiza- tion problem will approximate the sparsest near-solution of (23) [40]: 1882 IEEE TRANSACTIONS ON PATTERN ANALYSIS AND MACHINE INTELLIGENCE, VOL. 33, NO. 9, SEPTEMBER 2011 Fig. 3. A block diagram illustrating the different modes of operation of the proposed algorithm. Both the probe and the gallery can be individual iris images or iris video. Here, S.R. stands for Sparse Representation.](https://image.slidesharecdn.com/ieeeprotechnosolutions-ieeeembeddedprojectsecureandrobustirisrecognition-160128120857/75/Ieeepro-techno-solutions-ieee-embedded-project-secure-and-robust-iris-recognition-6-2048.jpg)
![^ ¼ arg min 0 k 0 k1 s:t: ka À ÈD0 k2 0 : ð24Þ One sufficient condition for (24) to stably approximate the sparsest solution of (23), is the Restricted Isometry Property (RIP) [41], [32], [33]. A matrix ÈD satisfies the RIP of order K with constants K 2 ð0; 1Þ if ð1 À KÞ k v k2 2 k ÈDv k2 2 ð1 þ KÞ k v k2 2; ð25Þ for any v such that k v k0 K. When RIP holds, ÈD approximately preserves the euclidean length of K-sparse vectors. When D is a deterministic dictionary and È is a random matrix, the following theorem on the RIP of ÈD can be stated. Theorem 1 ([40]). Let D 2 IRNÂðn:LÞ be a deterministic dictionary with restricted isometry constant KðDÞ; K 2 IN. Let È 2 IRmÂN be a random matrix satisfying PðjkÈvk2 À kvk2 j ! kvk2 Þ 2eÀcn 22 ; 2 0; 1 3 ð26Þ for all v 2 IRN and some constant c 0 and assume m ! CÀ2 K logððn:LÞ=KÞ þ logð2eð1 þ 12=ÞÞ þ tð Þ ð27Þ for some 2 ð0; 1Þ and t 0. Then, with probability at least 1 À eÀt , the matrix ÈD has restricted isometry constant KðÈDÞ KðDÞ þ ð1 þ KðDÞÞ: ð28Þ The constant satisfies C 9=c. The above theorem establishes how the isometry constants of D are affected by multiplication with a random matrix È. Note that one still needs to check the isometry constants for the dictionary D to use this result. However, for a given dictionary, D, it is difficult to prove that D satisfies a RIP. One can alleviate this problem by using the phase transition diagrams [42], [43]. See Section 7.1 for more details. The following are some matrices that satisfy (26) and hence can be used as random projections for cancelability. . m  N random matrices È whose entries i;j are independent realizations of Gaussian random vari- ables i;j $ Nð0; 1 mÞ. . Independent realizations of Æ1 Bernoulli random variables i;j ¼ : þ1= ffiffiffiffiffi m p ; with probability 1 2 ; À1= ffiffiffiffiffi m p ; with probability 1 2 : . Independent realizations of related distributions such as i;j ¼ : þ ffiffiffiffiffiffiffiffiffiffi 3=m p ; with probability 1 6 ; 0; with probability 2 3 ; À ffiffiffiffiffiffiffiffiffiffi 3=m p ; with probability 1 6 : 8 : . Multiplication of any m  N random matrix È with a deterministic orthogonal N  N matrix ~D, i.e., È ~D. Note that RPs meet the various constraints required for cancelability, mentioned in Section 1. By using different RP matrices, we can issue different templates for different applications. If a transformed pattern is compromised, we can reissue a new pattern by applying a new random projection to the iris vector. The RIP properties together with the sparsity of ensure that the recognition performance is preserved. In the application database, only the transformed dictionary ÈD is stored. If a hacker illegally obtains the transformed dictionary ÈD and the transformed iris patterns of the user, a, he or she will have access to the person’s identity. However, it is extremely difficult to obtain the matrix D from ÈD, and without D one cannot obtain the original iris patterns y. Hence, our cancelable scheme is noninvertible as it is not possible to obtain the original iris patterns from the transformed patterns. Furthermore, since our method is based on pseudorandom number generation, we only consider the state space corresponding to the value taken by the seed of the random number generator. Hence, instead of storing the entire matrix, one only needs to store the seed used to generate the RP matrix. 7.2 Cancelability through Random Permutations of Dictionary Columns As explained in Section 3, when the iris image has good quality, only the training images corresponding to the correct class will have high coefficients. If the training images of different classes are randomly arranged as columns of the dictionary, both the dictionary and the order of the training images are required for correct recognition. In this section, we explain how this idea can enhance the security of our iris recognition system. When a new user is enrolled, his training images are divided into sectors and placed at random locations in the dictionary. In Fig. 5, we show the dictionary for a trivial example of four users. Note that the different sectors of each training image of the user are kept at different random locations in the dictionary. Without prior knowledge of these locations, it is impossible to perform recognition. An array indicating the column numbers of the training images of the correct class is generated for each user. This array is stored in a hash table, and the corresponding hash code is given to the user during enrollment. During verification, the system acquires the iris image of the person and extracts the features. For each sector of the iris vector, the sparse coefficients are obtained using this shuffled dictionary, as explained in Section 3. The user also has to present the hash code to the system. Using the hash PILLAI ET AL.: SECURE AND ROBUST IRIS RECOGNITION USING RANDOM PROJECTIONS AND SPARSE REPRESENTATIONS 1883 Fig. 4. Block Diagram of the Random Projections-based cancelable system.](https://image.slidesharecdn.com/ieeeprotechnosolutions-ieeeembeddedprojectsecureandrobustirisrecognition-160128120857/75/Ieeepro-techno-solutions-ieee-embedded-project-secure-and-robust-iris-recognition-7-2048.jpg)
![code, the indices of training images are obtained from the hash table and the coefficients belonging to different classes are grouped. Then, SCI is computed and used to retain or reject the images. If the image is retained, the CSCI values of the different classes are computed and the class having the lowest CSCI value is assigned as the class label of the user, as explained in Section 4. A block diagram of the security scheme is presented in Fig. 6. If the hash code presented is incorrect, then the obtained indices of the training images for each class will be wrong. So the coefficients will be grouped in a wrong way, and all of the classes will have similar energy, leading to a low SCI value and the subsequent rejection of the image. Even if, by chance, one of the classes happened to have high energy and the image is retained, the probability of that class being the correct class is very low ( 1 N ). Thus, with high probability, the user will not be verified. Hence, if a hacker illegally acquires the iris patterns of a legitimate user, without having the hash code he or she will not be able to access the system. Also, even if the hacker obtains the iris dictionary stored in the application database, the iris patterns of the user cannot be accessed without knowing the correct hash codes because different sectors of an iris’ patterns reside at different random locations. If the hash code is compromised, the dictionary indices of the user can then be stored at a new location, and a new hash code can be issued to the user. Also, different applications can have different dictionaries. Thus, the user will have a different hash code for each application, preventing crossmatching. It should be noted that the additional security and privacy introduced by these techniques come at the expense of storing additional seed values. In applications requiring higher security, this can be stored with the user so that a hacker will not get the original templates even if he gets hold of the cancelable patterns in the template database. For applications with greater emphasis on usability, the seed can be stored securely in the template database so that the user will not have to carry it. 8 RESULTS AND DISCUSSION In the following sections, we present iris image selection, recognition, and cancelability results on the ICE2005 data set [3], ND-IRIS-0405 (ND) data set [44], and the MBGC videos [45]. The ND data set is a superset of the ICE2005 and ICE2006 iris data sets. It contains about 65,000 iris images belonging to 356 persons, with a wide variety of distortions, facilitating the testing and performance evaluation of our algorithm. In all of our experiments, we employed a highly efficient algorithm suitable for large-scale applications, known as the Spectral Projected Gradient (SPGL1) algorithm [46], to solve the BP and BPDN problems. 8.1 Empirical Verification of ‘0=‘1 Equivalence Our sparse recognition algorithm’s performance depends on certain conditions on the dictionary such as incoherence and RIP. However, as stated earlier, it is very difficult to prove any general claim that D, GD, ÈD, or ÈGD satisfies an RIP or an incoherence property. To address this, one can use the phase transition diagrams [42]. A phase transition diagram provides a way of checking ‘0=‘1 equivalence, indicating how sparsity and indeterminacy affect the success of ‘1 minimization [42], [43]. Let ¼ M N be a measure of undersampling factor and ¼ K M be a measure of sparsity. A plot of the pairing of the variables and describes a two-dimensional phase space ð; Þ 2 ½0; 1Š2 . The values of and ranged through 40 equispaced points in the interval ½0; 1Š and N ¼ 800. At each point on the grid, we recorded the mean number of coordinates at which original and reconstruction differed by more than 10À3 , averaged over 20 independent realizations (see [42], [43] for more details). In Figs. 7a and 7b, we show the phase transition diagrams corresponding to the case when the dictionary is GD and ÈGD, respectively. Here, G is the Gabor transformation matrix and È is an m  N matrix whose entries i;j are independent realizations of Gaussian random variables i;j $ Nð0; 1 mÞ. For each value of , the 1884 IEEE TRANSACTIONS ON PATTERN ANALYSIS AND MACHINE INTELLIGENCE, VOL. 33, NO. 9, SEPTEMBER 2011 Fig. 5. Sample dictionary and hash table for a four-user example. The four users A, B, C, and D are indicated by colors green, blue, black, and red, respectively. A1 and A2 are the two training images corresponding to the first user. Sij denote that the jth location and the ith sector. D1 at S14 means that the first sector of the user D is at location S14. Fig. 6. Block diagram of the proposed cancelability scheme using random permutations. Fig. 7. Phase transition diagrams corresponding to the case when the dictionary is (a) GD and (b) ÈGD, where G is the Gabor transformation matrix and È is the random projection matrix for cancelability. In both figures, we observe a phase transition from the lower region, where the ‘0=‘1 equivalence holds, to the upper region, where one must use combinatorial search to recover the sparsest solution.](https://image.slidesharecdn.com/ieeeprotechnosolutions-ieeeembeddedprojectsecureandrobustirisrecognition-160128120857/75/Ieeepro-techno-solutions-ieee-embedded-project-secure-and-robust-iris-recognition-8-2048.jpg)
![values of below the curve are the ones where the ‘0=‘1 equivalence holds. As can be observed, for most values of , there is at least one value of below the curve, satisfying the equivalence. So the vector can be recovered if it is sparse enough and enough measurements are taken. 8.2 Image Selection and Recognition In this section, we evaluate our selection and recognition algorithms on ND and ICE2005 data sets. To illustrate the robustness of our algorithm to occlusion due to eyelids and eye lashes, we perform only a simple iris segmentation scheme, detecting just the pupil and iris boundaries and not the eyelids and eye lashes. We use the publicly available code of Masek and Kovesi [47] for detecting these boundaries. 8.2.1 Variation of SCI with Common Distortions during Image Acquisition To study the variation of SCI in the presence of common distortions during image acquisition like occlusion and blur, we simulate them on the clean iris images from the ND data set. Description of the experiment. We selected 15 clean iris images of the left eye of 80 people. Twelve such images per person formed the gallery and distortions were simulated on the remaining images to form the probes. We consider seven different levels of distortion for each case, with level one indicating no distortion and level seven indicating maximum distortion. We obtain the dictionary using the gallery images, and evaluate the SCI of the various sectors of the test images. Fig. 8 shows some of the simulated images from the ND data set. The first column includes images with distortion level one (no distortion). The middle column contains images with distortion level three (moderate distortions). The rightmost column contain images with distortion level five (high distortion). The first row contains images with blur while the second contains images with occlusion. Images with simulated segmentation error and specular reflections are shown in the third and fourth rows, respectively. Fig. 9a illustrates the variation of SCI with the common acquisition distortions. It can be observed that good images have high SCI values whereas the ones with distortion have lower SCI values. So by suitably thresholding the SCI value of the test image, we can remove the bad images before the recognition stage. The relative stability in SCI values with occlusion and specular reflection demonstrates the increased robustness attained by our algorithm, by separately recog- nizing the individual sectors and combining the results, as mentioned in Section 4. 8.2.2 Image Selection Results on the ND Data Set In this section, we illustrate the performance of our image selection algorithm on images from the ND data set. Description of the experiment. We selected the left iris images of 80 subjects that had sufficiently large number of iris images with different distortions like blur, occlusion, and segmentation errors. Fifteen clean images per person were hand chosen to form the gallery. Up to 15 images with blur, occlusion, and segmentation errors were also selected. As mentioned before, we perform a simple segmentation scheme, retaining possible occlusion due to eyelids and eyelashes in the iris vector. The Gabor features of the iris PILLAI ET AL.: SECURE AND ROBUST IRIS RECOGNITION USING RANDOM PROJECTIONS AND SPARSE REPRESENTATIONS 1885 Fig. 8. Simulated distortions on the images from the ND data set. The detected pupil and iris boundaries are indicated as red circles. Fig. 9. (a) Plot of the variation in SCI values with common distortions in iris image acquisition. Note that the SCI falls monotonically with increasing levels of blur and segmentation errors in the iris images. It is also robust to occlusions and specular reflections. (b) Plot of the recognition rate versus the number of sectors. Observe the significant improvement in the results as the number of sectors is improved from one to eight. (c) Plot of the recognition rate versus the number of training images. Note that the recognition rate increases monotonically with the number of training images. Also, sectoring achieves the same recognition rate as the case with sectoring using far fewer training images.](https://image.slidesharecdn.com/ieeeprotechnosolutions-ieeeembeddedprojectsecureandrobustirisrecognition-160128120857/75/Ieeepro-techno-solutions-ieee-embedded-project-secure-and-robust-iris-recognition-9-2048.jpg)
![vector form the input. Our algorithm creates the dictionary, finds the sparse representation for each test vector, evaluates the SCI of the sectors, and rejects the images for which all the sectors have SCI value below a threshold of 0.6. Measure the selection performance. The quality of the input iris feature vector should be a function of the performance of the recognition algorithm on that sample [1]. An ideal image selection algorithm should retain images which can be correctly recognized by the recognition algorithm and reject the ones on which the subsequent recognition algorithm will perform poorly. To measure it, we define the Modified False Positive Rate (MFR) and a Modified Verification Rate (MVR) as follows: Modified False Positive rate is the fraction of the test vectors retained by the image selection algorithm, which are wrongly classified by the subsequent recognition algorithm. Mod- ified Verification Rate is defined as the fraction of the images correctly classified by the recognition algorithm, which are retained by the selection scheme. To obtain these values, we find the CSCI for each test sample and also the class assigned to the samples by our algorithm. We obtain the Receiver Operating Characteristics (ROCs) of the image selection algorithm by plotting MVR versus MFR for different values of threshold. Note that this measures the performance of the quality estimation stage and is different from the ROC curve of the recognition algorithm. MFR ¼ No: of Images selected and wrongly classified No: of images selected ; MV R ¼ No: of Images selected and correctly classified No: of images correctly classified : Fig. 10a shows the ROC of our image selection algorithm (black), compared to that using directly the Hamming distance-based on the publicly available iris recognition system of Masek et al. [47] (red) when the probe images are blurred. Since the data have occlusion, direct application of Masek’s algorithm performed poorly. For a fair compar- ison, we modified the algorithm, recognizing the different sectors of the iris separately and fusing the results through voting. Note that our ROC curve is significantly sharper than that of Masek’s recognition system, indicating superior performance. The effects of occlusion in iris images due to eyelids, eye lashes, and specular reflections are illustrated in Fig. 10b. Images with occlusion were obtained for each of the 80 classes under consideration and used as probes. The ROC curve of our algorithm is shown in black and that of Masek’s system appears in red. Note that for the same MFR, the proposed image selection scheme has a higher MVR. This indicates that the proposed selection method retains more images that will be correctly classified by the subsequent recognition algo- rithm and rejects more images that will be wrongly classified by the recognition algorithm. To study the effects of segmentation error, the gallery images were verified to be well segmented. Up to 15 images with segmentation errors were chosen for each person under consideration, which formed the probes. Fig. 10c shows the ROC curves of our method (black) and Masek’s (red) in case of wrongly segmented images. Again, using our image selection algorithm improves the performance of the system even with wrongly segmented images, a feature lacking in many existing quality estimation methods. 8.2.3 Recognition Results on Images from the ND Data Set In this section, we illustrate the performance of our recognition algorithm on images from the ND data set. Performance on clean images—description of the experiment. Eighty subjects were selected from the data set. Fifteen clean images of the left iris were hand selected for each person. Of these 15 images per person, 12 were randomly selected to form the gallery and the remaining three images per person were used as probes. No image selection is performed because we want to evaluate the performance of the recognition algorithm separately. We compare our algorithm to a nearest neighbor (NN)- based recognition algorithm that uses the Gabor features and the Masek’s implementation. Since we use tough segmentation conditions retaining the eyelids and eye lashes in the iris vector, direct application of NN and Masek’s method produced poor results. For a fair comparison, we divided the iris images into different sectors, obtained the results using these methods separately on each sectors, and combined the results by voting. We obtained a recognition rate of 99.15 percent compared to 98.33 percent for the NN and 97.5 percent for Masek’s method. Performance on poorly acquired images—description of the experiment. To evaluate the recognition performance of our algorithm on poorly acquired images, we hand- picked images with blur, occlusion, and segmentation 1886 IEEE TRANSACTIONS ON PATTERN ANALYSIS AND MACHINE INTELLIGENCE, VOL. 33, NO. 9, SEPTEMBER 2011 Fig. 10. Comparison of the ROC curves of the proposed image selection algorithm (CSCI-based) and one using Hamming distance as the quality measure (Hamming distance-based) using clean iris images in the gallery and probe images containing (a) blurring, (b) occlusions, and (c) segmentation errors. Note that CSCI-based image selection performs significantly better than Hamming distance-based selection when the image quality is poor.](https://image.slidesharecdn.com/ieeeprotechnosolutions-ieeeembeddedprojectsecureandrobustirisrecognition-160128120857/75/Ieeepro-techno-solutions-ieee-embedded-project-secure-and-robust-iris-recognition-10-2048.jpg)
![errors as explained in the previous section. Fifteen clean images per person were used to form the gallery. Probes containing each type of distortion were applied separately to the algorithm. We perform image selection followed by recognition. The recognition rates are reported in Table 1. In Fig. 11, we display the iris images having the least SCI value for the blur, occlusion, and segmentation error experiments performed on the real iris images in the ND data set as mentioned above. As can be observed, images with low SCI values suffer from high amounts of distortion. 8.2.4 Recognition Performance on the ICE 2005 Data Set In this section, we compare the performance of our algorithm with the existing results on the ICE 2005 data set corresponding to Experiment 1. Experiment 1 has 1,425 iris images corresponding to 120 different classes. Description of the experiment. We have used 10 images per class in the gallery and remaining iris images as the test vectors. We perform segmentation using Masek’s code and apply the Gabor features of the segmented iris images to our recognition algorithm. No image selection was per- formed. We compare our performance with existing results in Table 2, where the verification rates are indicated at a false acceptance rate of 0.001. The results of the existing methods are obtained from [48]. 8.2.5 Dependence of Recognition Rate on the Number of Sectors Fig. 9b plots the variation of the recognition rates for the proposed method with changes in the number of sectors. As can be observed, the performance of the recognition system improves significantly as the number of sectors is increased from one to eight. Beyond eight, the recognition rate does not increase significantly. 8.2.6 Effect of the Number of Training Images on Performance In this section, we study the effect of the number of training images on recognition rate of our algorithm. We vary the number of training images from one per class to 11 per class on the ND data set. The test images consisting of three iris images per person are used to test each of these cases. The variation of recognition rate is plotted in Fig. 9c for the case of no sectoring and sectoring with eight sectors, respec- tively. As can be observed, recognition performance increases with the number of training images. This is hardly surprising as our assumption that the training images span the space of testing images becomes more valid as the number of training images increases. In the unconstrained iris recognition systems which we are interested in, this is not a bottleneck because we can obtain a significant number of iris images from the incoming iris video. Also, sectoring achieves the same recognition rate as the nonsectoring case with a much lower number of training images. 8.2.7 CSCI as a Measure of Confidence in Recognition We have empirically observed that the higher the CSCI value for the test image, the higher the probability that it is correctly classified. This is illustrated in Fig. 12a. This observation is expected as high CSCI means that the reconstructed vector in most of the sectors will be sparse. If the training images span the space of possible testing images, the training images of the correct class will have high coefficients. So the only possible sparse vector is the one in which the correct class has high coefficients and others have zero coefficients, which will be correctly classified by our algorithm. 8.3 Cancelability Results Using Random Projections We present cancelability results on the clean images from the ND data set obtained as explained in Section 8.2.3. The iris region obtained after segmentation was unwrapped into a rectangular image of size 10 Â 80. The real parts of the Gabor features were obtained and concatenated to form an iris vector of length 800. We used the random Gaussian matrix in our experiments, though other random matrices mentioned in Section 7.1 also gave similar results. In [39], it was shown that separate application of the random projections performed better when compared to the application of a single random projection on the entire iris vector. So we vectorized the real part of the Gabor features of each sector of the iris image, applied the random projections, and then concatenated the random projected vectors to obtain our cancelable iris biometric. We applied either the same random Gaussian matrix for all of the users or different random matrices for different users to obtain the RP “Same Matrix” and “Different Matrix” vectors, respectively. Having obtained the random vectors from the PILLAI ET AL.: SECURE AND ROBUST IRIS RECOGNITION USING RANDOM PROJECTIONS AND SPARSE REPRESENTATIONS 1887 TABLE 1 Recognition Rate on ND Data Set TABLE 2 Verification Rate at an FAR of 0.001 on the ICE 2005 Data Set Fig. 11. Iris images with low SCI values in the ND data set. Note that the images in (a), (b), and (c) suffer from high amounts of blur, occlusion, and segmentation errors, respectively.](https://image.slidesharecdn.com/ieeeprotechnosolutions-ieeeembeddedprojectsecureandrobustirisrecognition-160128120857/75/Ieeepro-techno-solutions-ieee-embedded-project-secure-and-robust-iris-recognition-11-2048.jpg)
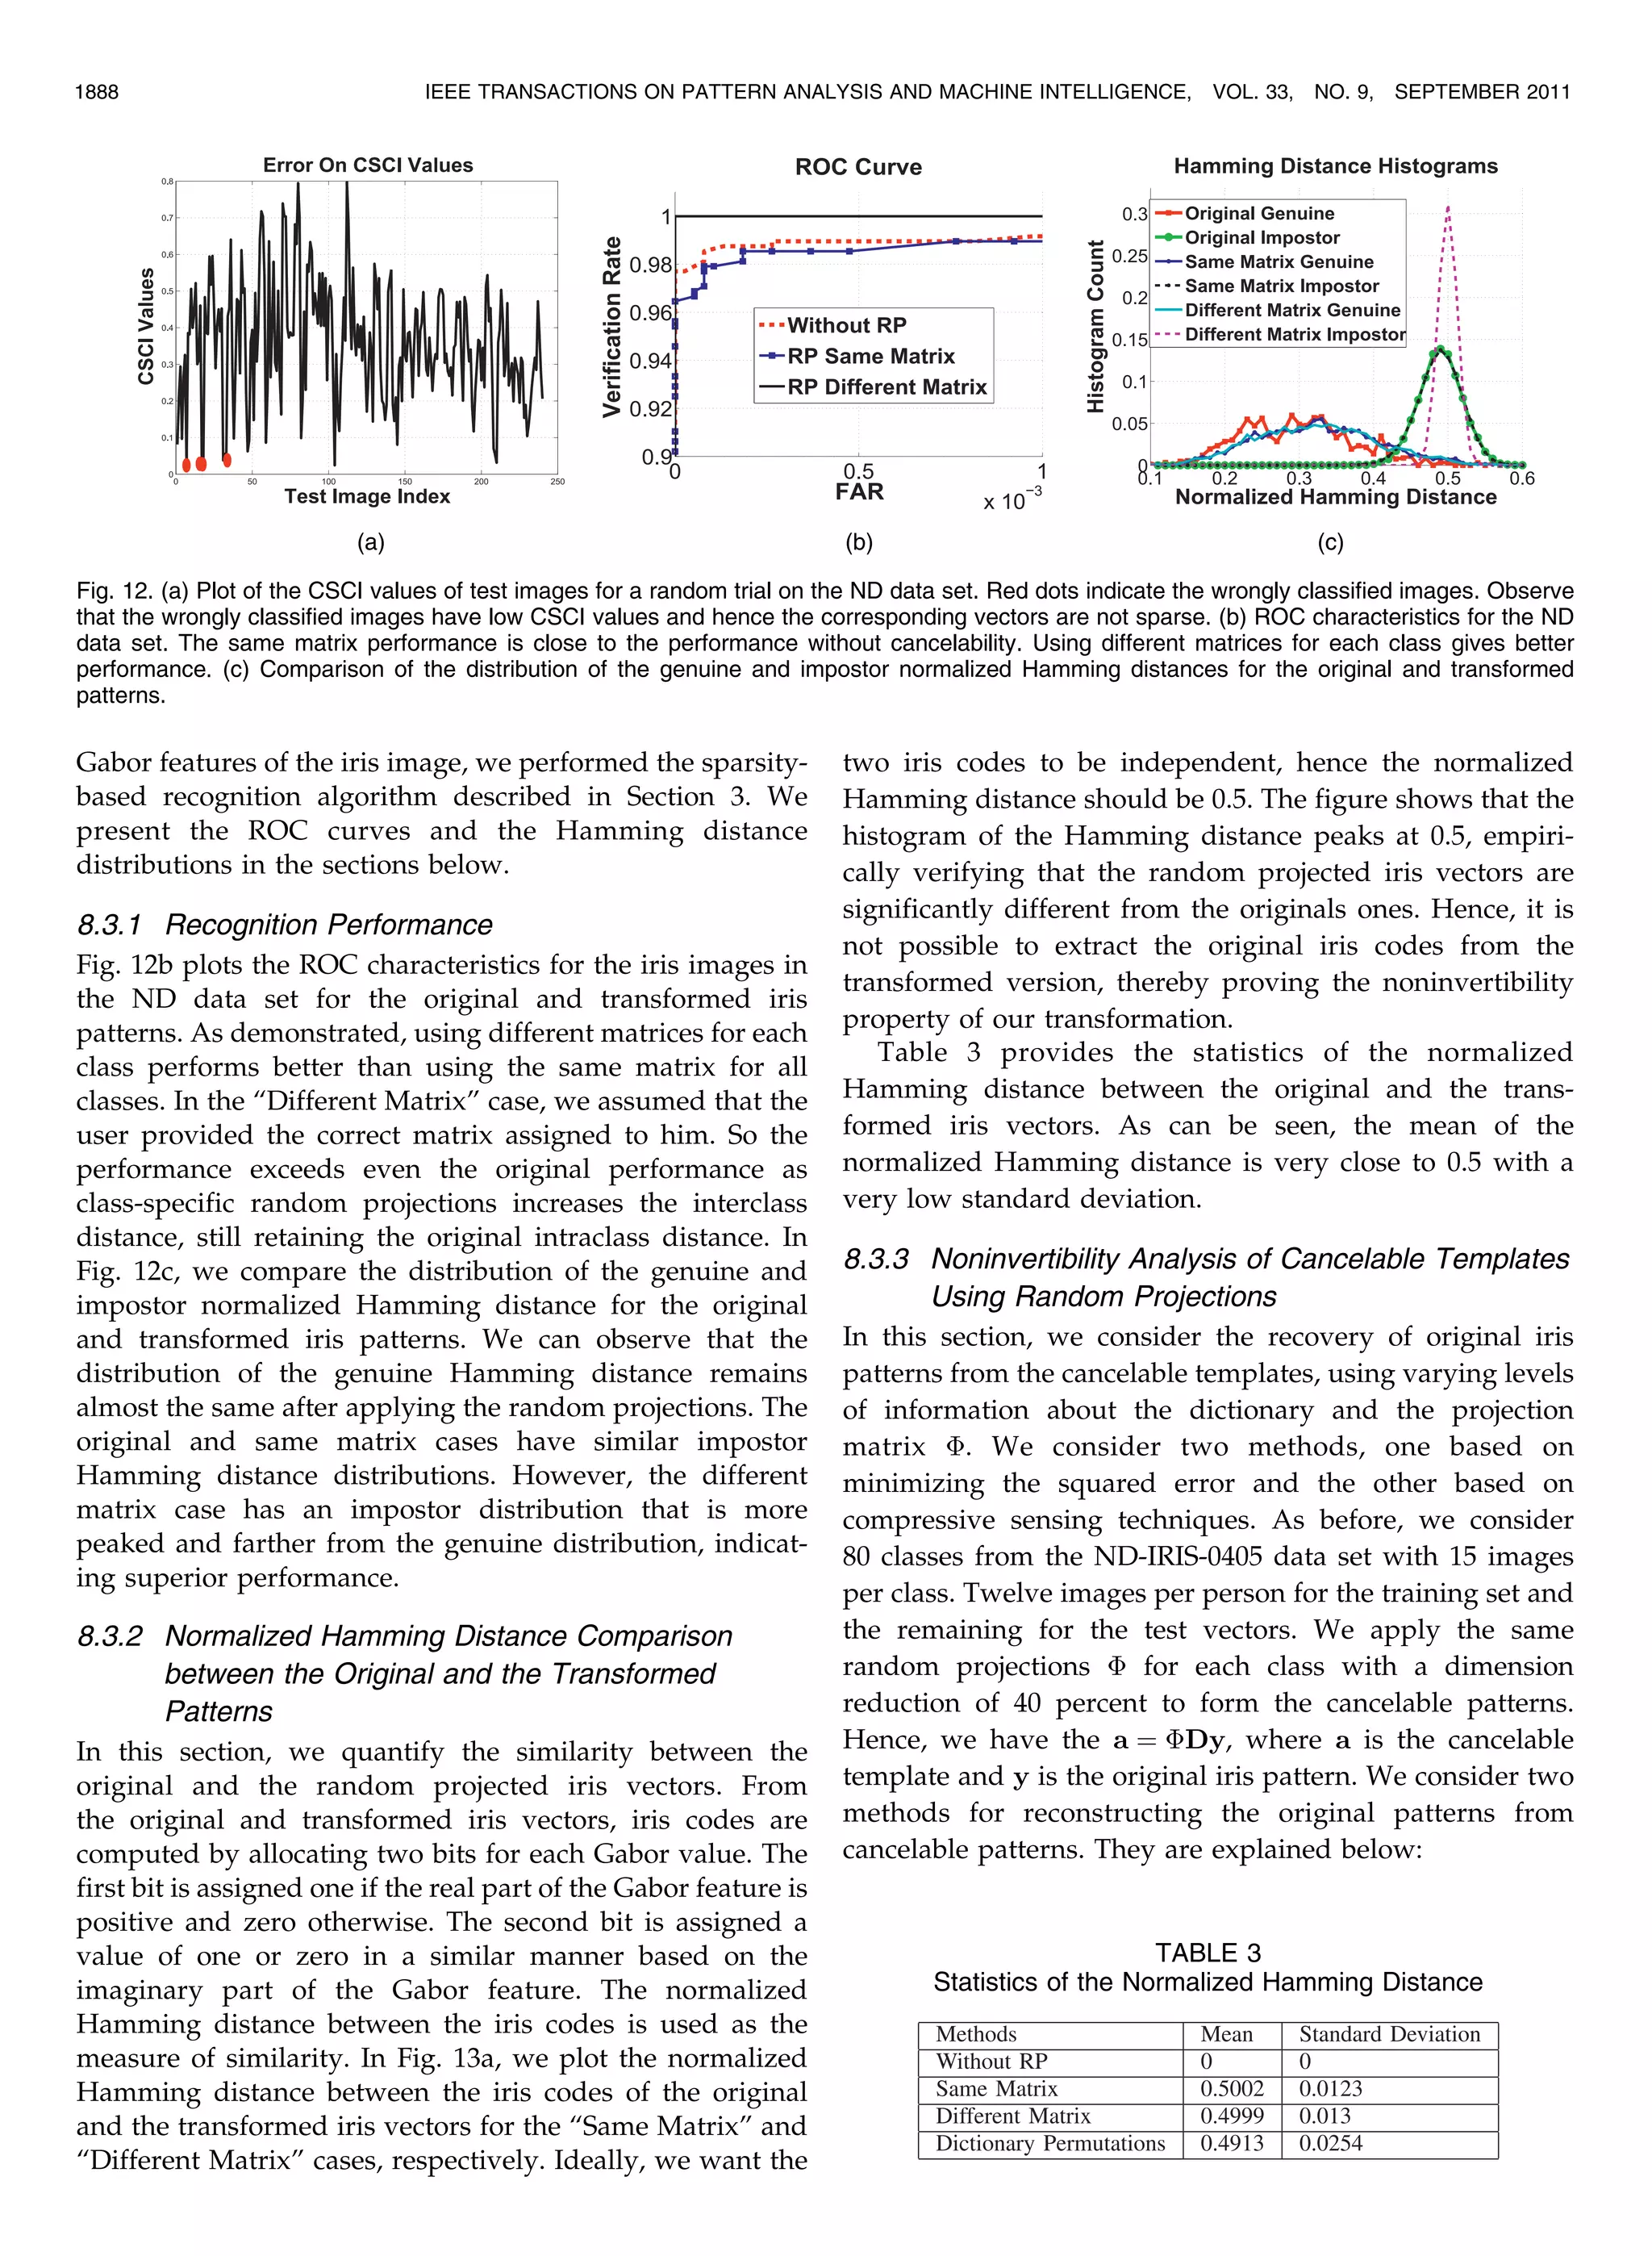
![1. Least Square solution—From (23) in the presence of additive noise, the original template can be recov- ered by minimizing the following squared error: ^y ¼ arg min y ka À Èyk2 2: 2. Compressive Sensing-based solution—Since È is a random Gaussian matrix having good RIP, one possible way of reconstructing the iris patterns is by solving the following L1 minimization problem: ^y ¼ arg min y k y k1 s:t: ka À Èyk2 0 : ð29Þ We computed the error in reconstruction of the original patterns and the recognition rate on the reconstructed patterns for different levels of information known about the cancelable template dictionary and the random projection matrix È. The results are shown in Tables 4 and 5. As can be observed, the recognition performance is close to chance when either of the random matrix or the dictionary entries are not known. Even when the random matrix and the dictionary entries are fully known, the recognition perfor- mance on the reconstructed template is significantly lower than that on the original iris templates. This result empirically verifies that it is difficult to extract significant information about the original iris templates from the cancelable ones. In Fig. 14, we display the Gabor features of one of the iris images in the dictionary and the corresponding recovered pattern. As can be observed, the recovered pattern appears as random noise and does not contain any of the information in the original iris pattern. 8.3.4 Effect of Dimension Reduction In Fig. 13b, we demonstrate the robustness of random projections to reduction in the original dimension of the feature vector. The random projected vectors retain their original performance for up to 30 percent reduction in the original dimension for both the same and different matrix cases. Dimension reduction further strengthens the non- invertibility of our transformation as there will be infinite possible iris vectors corresponding the reduced dimension random vectors obtained by RP. 8.3.5 Comparison with Salting In Table 6, we present the recognition rates and the corresponding mean Hamming distance for the salting method proposed in [29] for various noise levels. The best recognition rate and the best Hamming distance for the PILLAI ET AL.: SECURE AND ROBUST IRIS RECOGNITION USING RANDOM PROJECTIONS AND SPARSE REPRESENTATIONS 1889 TABLE 5 Reconstruction Error and Recognition Rate Knowing the Exact Projection Matrix and Fraction of Entries in the Cancelable Template Fig. 14. (a) Gabor features of the original iris image. (b) Gabor features of the recovered iris image from the cancelable patterns in the dictionary and a randomly generated projection matrix. Fig. 13. (a) Plot of the histograms of the normalized Hamming distance between the original and transformed vectors. Note that the histogram peaks around 0.5 indicating that the original and transformed iris codes are significantly different. (b) Plot of the recognition rate with dimension reductions for the ND data set. Note that the performance remains the same up to 30 percent of the original dimension. (c) ROC plots for video-based iris recognition. Method 1 treats each frame in the video as a different probe. Method 2 averages all of the frames in the probe video. Methods 3 and 4 use the average and minimum of all the pairwise Haming distance between the frames of the probe and gallery videos, respectively. The proposed method uses CSCI as the matching score. Note that the introduced quality-based matching score outperforms the existing fusion schemes, which do not incorporate the quality of the individual frames in the video. TABLE 4 Reconstruction Error and Recognition Rate Knowing the Exact Cancelable Template and Fraction of Entries in the Projection Matrix](https://image.slidesharecdn.com/ieeeprotechnosolutions-ieeeembeddedprojectsecureandrobustirisrecognition-160128120857/75/Ieeepro-techno-solutions-ieee-embedded-project-secure-and-robust-iris-recognition-13-2048.jpg)
![Salting method are 96.6 percent and 0.494, respectively. For the RP same matrix case, we obtained a recognition rate of 97 percent at a Hamming distance of 0.497. Thus, both the recognition performance and security (noninvertibility) are higher for RP when compared to the Salting method. 8.4 Cancelability Results Using Random Permutations To evaluate the performance of the proposed cancelable method using dictionary permutations, we consider the three possible scenarios on the clean images from the ND data set. In the first case, the user provides the iris image and the correct hash code. In this case, the recognition performance was the same as that of the original method on the ND data set, which is 99.17 percent. In the second case, the user provides the iris image but a wrong hash code. Here, the recognition performance dropped to two percent, which is only slightly better than chance. This is equivalent to the case when a hacker illegally obtains the iris image of a valid user and tries to gain access into the system with a guess about the hash code. The low recognition perfor- mance clearly reflects the additional security introduced by the permutations, as a hacker needs to now have not only the iris image but also the hash code of a valid user to gain access. In the third experiment, we found the closeness between the Gabor features of the original iris images and the new feature vectors obtained by permutations of the Gabor features in the dictionary. As before, the normalized Hamming distance between the iris codes obtained from these vectors is used as the measure of similarity. We plot the histogram of the normalized Hamming distance between the original and the randomly permuted iris vectors in Fig. 13a. The mean and standard deviation of the Hamming distance histogram are indicated in the last row of the Table 5. Note that the mean is close to 0.5, indicating that the permutations differ significantly differ- ent from the original iris images. Even if a hacker can use the dictionary from the application database, he or she will be unable to extract information about the original iris images without knowing the hash code of each user. 8.5 Results on Iris Videos In this section, we present the results on the MBGC videos [45]. Given the 30 classes, we used 28 classes that contained at least five good images in our experiments. We hand- picked five clean images from the iris videos in the training set which formed the dictionary. In the test videos, batches of five frames were given as a probe to our algorithm. Using 28 available videos and 60 frames from each test video, we could form 336 probes. We did only a basic segmentation of the iris and pupil using the Masek’s code, as before. Also, we did not remove the poorly segmented iris images manually before performing the recognition algorithm. We compare the performance of our algorithm with four other methods. The ROC plots for the different methods are displayed in Fig. 13c. In Method 1, we consider each frame of the video as a different probe. It gave the worst performance, indicating that using multiple frames avail- able in a video can improve the performance. Method 2 averages the intensity of the different iris images. Though it performs well when the images are clean, a single image which is poorly segmented or blurred could affect the entire average. In Methods 3 and 4, all possible pairwise Hamming distances between the video frames of the probe videos and the gallery videos belonging to the same class are computed. Method 3 uses the average of these Hamming distance as the score. In Method 4, the minimum of the pairwise Hamming distance was used as the score. In the proposed method, the CSCI values were computed for each class for each probe video and the probe video is assigned to the class having the highest CSCI value. For a fair comparison of the proposed quality measure in videos, we did not reject any of the frames. Observe that our method performs better than other methods. One of the reasons for the superior performance could be the fact that we are incorporating the quality of the different frames while computing the CSCI. Frames which are poorly segmented or blurred will have a low SCI value and hence will not affect the score significantly. In all of the other methods, the image quality was not effectively incorporated into the matching score, so all frames are treated equally, irrespective of their quality. 8.6 Effect of Nonlinear Deformations Thornton et al. [49] have studied the in-plane nonlinear deformations possible in iris images. They found that the movement of the pupil is only approximately linear, which leads to minor relative deformations to the normal- ized iris patterns. For BPDN in Section 3.1 to identify the correct class, the fitting error of the true class should be much lower than that due to the other classes. The nonlinear deformations could increase the fitting error for the true class and affect the performance of our algorithm. To analyze this issue empirically, we represent each sector of the test feature as a linear combination of the training images of each class separately. The median of the fitting error for the true class and the other classes is plotted in Fig. 15 for the different sectors. As can be observed, the fitting error for the true class is significantly lower than that using the other classes. Also, the number of training images in the true class is far fewer than the total number of images in the gallery, thereby making the coefficient vector sparse. Empirically, we can thus verify that the proposed method should be returning the correct class even with small nonlinear deformations. Also, the nonlinear deformations will differ for different sectors of the iris. If some sectors have lower deformation and others have higher deformation, the SCI values will be greater for the lesser deformed sectors and lower for the rest. The sectors with lower deformation will be correctly recognized by the Sparse Representation-based method. The introduced Bayesian Fusion framework will give greater weight to the evidence from the lesser deformed 1890 IEEE TRANSACTIONS ON PATTERN ANALYSIS AND MACHINE INTELLIGENCE, VOL. 33, NO. 9, SEPTEMBER 2011 TABLE 6 Comparison with the Salting Method The Recognition Rate (RR) and mean Hamming Distance (HD) are provided for the Salting and SRP methods. The recognition rate obtained using SRP is higher than that of the Salting method. Also, SRP gives mean Hamming distance closer to 0.5 when compared to the Salting method.](https://image.slidesharecdn.com/ieeeprotechnosolutions-ieeeembeddedprojectsecureandrobustirisrecognition-160128120857/75/Ieeepro-techno-solutions-ieee-embedded-project-secure-and-robust-iris-recognition-14-2048.jpg)
![sectors, thereby obtaining the correct class label. So the performance of our method will be affected only when all sectors of the iris have severe nonlinear deformations. We are currently investigating how to handle such severe nonlinear deformations within our framework. 8.7 Computational Complexity In this section, we analyze the complexity of our algorithm and compare it with the Masek’s algorithm for iris recognition. Let us assume that we have L classes, with n training images per class. Let each feature vector be of length N. Let us assume that the number of sectors is ns. In our experiments, it is fixed as 8. So the length of each sector of the feature vector is N ns . The size of the dictionary in each sparse representation is N ns  nL. Numerous methods have been proposed for solving the ‘1 minimization problem [50]. For instance, the complexity of solving an ‘1 minimization problem using a Homotopy- based method is an OðN ns 2 þ N ns nLÞ operation. So the total computational complexity of finding the sparse representa- tion of all the sectors is OðnsðN ns 2 þ N ns nLÞÞ. Let ^A be the number of different alignments used. So the total complexity of our algorithm is Oðns ^AðN ns 2 þ N ns nLÞ. Since ^A and sl are constants in our algorithm, the total complexity of the proposed method is OðN2 þ NnLÞ. Note that computing CSCI given the SCI of the different sectors is an OðL ^AÞ operation. So the complexity of our algorithm is linear in the number of classes and quadratic in the length of the feature vector. The computational complexity of the Masek’s algo- rithm is OðNnLÞ, which is linear in the number of classes and the dimension of the feature vector. So our algorithm is computationally more expensive than the Masek’s algorithm and the difference in complexity increases with the feature dimension. However, since the most computationally ex- pensive component in our algorithm is the ‘1 minimization step, it is possible to make the proposed algorithm faster using greedy pursuit algorithms such as CoSaMP [51]. 9 CONCLUSION In this paper, we proposed a unified approach for iris image selection and recognition which has numerous advantages over existing techniques when a sufficient number of training samples are available. Our experiments indicate that the selection algorithm can handle common distortions in iris image acquisition like blur, occlusions, and segmen- tation errors. Unlike the existing feature-based and score- based fusion algorithms for iris recognition from video, we introduced a quality-based matching score and demon- strated its superior performance on the MBGC iris video data set. Furthermore, we incorporated random projections and random permutations into the proposed method to prevent the compromise of sensitive biometric information of the users. Currently, we are exploring ways to improve the quality of the poorly acquired images, rather than rejecting them using compressed sensing techniques [33], [41]. We are also investigating ways to develop a minimal set of training images spanning the testing image space, which can reduce the memory and computation require- ments of our algorithm. The possibility of adapting algorithms such as elastic net [52] is also being explored. ACKNOWLEDGMENTS The work of J.K. Pillai, V.M. Patel, and R. Chellappa was supported by MURI from the US Office of Naval Research under the Grant N00014-08-1-0638. REFERENCES [1] K.W. Bowyer, K. Hollingsworth, and P.J. Flynn, “Image Under- standing for Iris Biometrics: A Survey,” Computer Vision and Image Understanding, vol. 110, no. 2, pp. 281-307, 2008. [2] J. Daugman, “Probing the Uniqueness and Randomness of Iris Codes: Results from 200 Billion Iris Pair Comparisons,” Proc. IEEE, vol. 94, no. 11, pp. 1927-1935, Nov. 2006. [3] E.M. Newton and P.J. Phillips, “Meta-Analysis of Third-Party Evaluations of Iris Recognition,” IEEE Trans. Systems, Man, and Cybernetics, vol. 39, no. 1, pp. 4-11, Jan. 2009. [4] J. Wright, A.Y. Yang, A. Ganesh, S.S. Sastry, and Y. Ma, “Robust Face Recognition via Sparse Representation,” IEEE Trans. Pattern Analysis and Machine Intelligence, vol. 31, no. 2, pp. 210-227, Feb. 2009. [5] H. Proenca and L.A. Alexandre, “Iris Segmentation Methodology for Non-Cooperative Recognition,” IEE Proc. Vision, Image and Signal Processing, vol. 153, pp. 199-205, 2006. [6] A.K. Jain, K. Nandakumar, and A. Nagar, “Biometric Template Security,” EURASIP J. Advances in Signal Processing, Special Issue on Biometrics, vol. 2008, no. 113, pp. 1-17, 2008. [7] R.M. Bolle, J.H. Connel, and N.K. Ratha, “Biometrics Perils and Patches,” Pattern Recognition, vol. 35, no. 12, pp. 2727-2738, 2002. [8] N.K. Ratha, J.H. Connel, and R.M. Bolle, “Enhancing Security and Privacy in Biometrics-Based Authentication Systems,” IBM Sys- tems J., vol. 40, no. 3, pp. 614-634, 2001. [9] J. Daugman, “High Confidence Visual Recognition of Persons by a Test of Statistical Independence,” IEEE Trans. Pattern Analysis and Machine Intelligence, vol. 15, no. 11, pp. 1148-1161, Nov. 1993. [10] R.P. Wildes, “Iris Recognition: An Emerging Biometric Technol- ogy,” Proc. IEEE, vol. 85, no. 9, pp. 1348-1363, Sept. 1997. [11] Y. Chen, S.C. Dass, and A.K. Jain, “Localized Iris Image Quality Using 2-D Wavelets,” Proc. Int’l Conf. Biometrics, pp. 373-381, 2006. [12] N.D. Kalka, J. Zuo, N.A. Schmid, and B. Cukic, “Image Quality Assessment for Iris Biometric,” Proc. SPIE Conf. Biometric Technology for Human Identification, p. 6202, 2006. [13] H. Proenca and L.A. Alexandre, “A Method for the Identification of Noisy Regions in Normalized Iris Images,” Proc. Int’l Conf. Pattern Recognition, pp. 405-408, 2006. PILLAI ET AL.: SECURE AND ROBUST IRIS RECOGNITION USING RANDOM PROJECTIONS AND SPARSE REPRESENTATIONS 1891 Fig. 15. Plot of the fitting error for the true class and the wrong classes. Note that the true class gives a much lower fitting error on the test iris images. Also, the number of images in the true class is far fewer than the total number of images in the gallery. So, the sparsest solution which gives the least fitting error corresponds to nonzero coefficients only for the true class in most cases.](https://image.slidesharecdn.com/ieeeprotechnosolutions-ieeeembeddedprojectsecureandrobustirisrecognition-160128120857/75/Ieeepro-techno-solutions-ieee-embedded-project-secure-and-robust-iris-recognition-15-2048.jpg)
![[14] X.-D. Zhu, Y.-N. Liu, X. Ming, and Q.-L. Cui, “Quality Evaluation Method of Iris Images Sequence Based on Wavelet Coefficients in Region of Interest,” Proc. Fourth Int’l Conf. Computer and Informa- tion Technology, pp. 24-27, 2004. [15] L. Ma, T. Tan, Y. Wang, and D. Zhang, “Personal Identification Based on Iris Texture Analysis,” IEEE Trans. Pattern Analysis and Machine Intelligence, vol. 25, no. 12, pp. 1519-1533, Dec. 2003. [16] S. Rakshit and D. Monro, “Iris Image Selection and Localization Based on Analysis of Specular Reflection,” Proc. IEEE Workshop Signal Processing Applications for Public Security and Forensics, pp. 1- 4, 2007. [17] K.P. Hollingsworth, K.W. Bowyer, and P.J. Flynn, “Image Averaging for Improved Iris Recognition,” Proc. Third Int’l Conf. Advances in Biometrics, 2009. [18] Y. Du, “Using 2D Log-Gabor Spatial Filters for Iris Recognition,” Proc. SPIE Conf. Biometric Technology for Human Identification III, 2006. [19] L. Ma, T. Tan, Y. Wang, and D. Zhang, “Efficient Iris Recognition by Characterizing Key Local Variations,” IEEE Trans. Image Processing, vol. 13, no. 6, pp. 739-750, June 2004. [20] E. Krichen, L. Allano, S. Garcia-Salicetti, and B. Dorizzi, “Specific Texture Analysis for Iris Recognition,” Proc. Fifth Int’l Conf. Audio- and Video-Based Biometric Person Authentication, pp. 23-30, 2005. [21] N.A. Schmid, M.V. Ketkar, H. Singh, and B. Cukic, “Performance Analysis of Iris Based Identification System at the Matching Score Level,” IEEE Trans. Information Forensics and Security, vol. 1, no. 2, pp. 154-168, June 2006. [22] C. Liu and M. Xie, “Iris Recognition Based on DLDA,” Proc. Int’l Conf. Pattern Recognition, pp. 489-492, 2006. [23] K. Roy and P. Bhattacharya, “Iris Recognition with Support Vector Machines,” Proc. Int’l Conf. Biometrics, pp. 486-492, 2006. [24] G.I. Davida, Y. Frankel, and B.J. Matt, “On Enabling Secure Applications through Off-Line Biometric Identification,” Proc. IEEE Symp. Security and Privacy, pp. 148-157, 1998. [25] F. Hao, R. Anderson, and J. Daugman, “Combining Crypto with Biometrics Effectively,” IEEE Trans. Computers, vol. 55, no. 9, pp. 1081-1088, Sept. 2006. [26] S. Kanade, D. Petrovska-Delacretaz, and B. Dorizzi, “Cancelable Iris Biometrics and Using Error Correcting Codes to Reduce Variability in Biometric Data,” Proc. IEEE Conf. Computer Vision and Pattern Recognition, 2009. [27] A. Juels and M. Wattenberg, “A Fuzzy Commitment Scheme,” Proc. ACM Conf. Computers and Comm. Security, pp. 28-36, 1999. [28] A.B.J. Teoh, A. Goh, and D.C.L. Ngo, “Random Multispace Quantization as an Analytic Mechanism for BioHashing of Biometric and Random Identity Inputs,” IEEE Trans. Pattern Analysis and Machine Intelligence, vol. 28, no. 12, pp. 1892-1901, Dec. 2006. [29] J. Zuo, N.K. Ratha, and J.H. Connell, “Cancelable Iris Biometric,” Proc. Int’l Conf. Pattern Recognition, pp. 1-4, 2008. [30] D.L. Donoho and X. Huo, “Uncertainty Principle and Ideal Atomic Decomposition,” IEEE Trans. Information Theory, vol. 47, no. 7, pp. 2845-2862, Nov. 2001. [31] D.L. Donoho and M. Elad, “On the Stability of the Basis Pursuit in the Presence of Noise,” EURASIP Signal Processing J., vol. 86, no. 3, pp. 511-532, 2006. [32] E. Cande`s, J. Romberg, and T. Tao, “Stable Signal Recovery from Incomplete and Inaccurate Measurements,” Comm. Pure and Applied Math., vol. 59, pp. 1207-1223, 2006. [33] R. Baraniuk, “Compressive Sensing,” IEEE Signal Processing Magazine, vol. 24, no. 4, pp. 118-121, July 2007. [34] S. Chen, D. Donoho, and M. Saunders, “Atomic Decomposition by Basis Pursuit,” SIAM J. Scientific Computing, vol. 20, no. 1, pp. 33- 61, 1998. [35] J.A. Tropp and A.C. Gilbert, “Signal Recovery from Random Measurements via Orthogonal Matching Pursuit,” IEEE Trans. Information Theory, vol. 53, no. 12, pp. 4655-4666, Dec. 2007. [36] P.J. Phillips, “Matching Pursuit Filters Applied to Face Identifica- tion,” IEEE Trans. Image Processing, vol. 7, no. 8, pp. 1150-1164, Aug. 1998. [37] J.K. Pillai, V.M. Patel, and R. Chellappa, “Sparsity Inspired Selection and Recognition of Iris Images,” Proc. Third IEEE Int’l Conf. Biometrics—Technology And Systems, 2009. [38] A.B.J. Teoh and C.T. Yuang, “Cancelable Biometrics Realization with Multispace Random Projections,” IEEE Trans. Systems, Man, and Cybernetics, Part B: Cybernetics, vol. 37, no. 5, pp. 1096-1106, Oct. 2007. [39] J.K. Pillai, V.M. Patel, R. Chellappa, and N.K. Ratha, “Sectored Random Projections for Cancelable Iris Biometrics,” Proc. IEEE Int’l Conf. Acoustics, Speech, and Signal Processing, 2010. [40] H. Rauhut, K. Schnass, and P. Vandergheynst, “Compressed Sensing and Redundant Dictionaries,” IEEE Trans. Information Theory, vol. 54, no. 5, pp. 2210-2219, May 2008. [41] E. Candes, J. Romberg, and T. Tao, “Robust Uncertainty Principles: Exact Signal Reconstruction from Highly Incomplete Frequency Information,” IEEE Trans. Information Theory, vol. 52, no. 2, pp. 489-509, Feb. 2006. [42] D.L. Donoho, “High-Dimensional Centrally Symmetric Polytopes with Neighborliness Proportional to Dimension,” Discrete and Computational Geometry, vol. 35, no. 4, pp. 617-652, 2006. [43] J.D. Blanchard, C. Cartis, and J. Tanner, “The Restricted Isometry Property and ‘q-Regularization: Phase Transition for Sparse Approximation,” to be published. [44] K.W. Bowyer and P.J. Flynn, “The ND-IRIS-0405 Iris Image Data Set,” technical report, Notre Dame CVRL, 2010. [45] P.J. Phillips, P.J. Flynn, J.R. Beveridge, W.T. Scruggs, A.J. O’Toole, D.S. Bolme, K.W. Bowyer, B.A. Draper, G.H. Givens, Y.M. Lui, H. Sahibzada, J.A. Scallan, and S. Weimer, “Overview of the Multiple Biometrics Grand Challenge,” Proc. Third Int’l Assoc. for Pattern Recognition/IEEE Conf. Biometrics, 2009. [46] E. van den Berg and M.P. Friedlander, “Probing the Pareto Frontier for Basis Pursuit Solutions,” SIAM J. Scientific Computing, vol. 31, no. 2, pp. 890-912, 2008. [47] L. Masek and P. Kovesi, “MATLAB Source Code for a Biometric Identification System Based on Iris Patterns,” Univ. of Western Australia, 2003. [48] P.J. Phillips, “FRGC and ICE Workshop,” Proc. NRECA Conf. Facility, 2006. [49] J. Thornton, M. Savvides, and B.V.K.V. Kumar, “A Bayesian Approach to Deformed Pattern Matching of Iris Images,” IEEE Trans. Pattern Analysis and Machine Intelligence, vol. 29, no. 4, pp. 596-606, Apr. 2007. [50] A. Yang, A. Ganesh, S. Sastry, and Y. Ma, “Fast L1-Minimization Algorithms and an Application in Robust Face Recognition: A Review,” Technical Report No. UCB/EECS-2010-13, 2010. [51] D. Needell and J.A. Tropp, “CoSaMP: Iterative Signal Recovery from Incomplete and Inaccurate Samples,” Applied and Computa- tional Harmonic Analysis, vol. 26, pp. 301-321, 2009. [52] H. Zou and T. Hastie, “Regularization and Variable Selection via the Elastic Net,” J. Royal Statistical Soc., vol. 67, no. 2, pp. 301-320, 2005. Jaishanker K. Pillai received the BTech (dis- tinction) degree in electronics and communica- tion engineering from the National Institute of Technology, Calicut, and the ME (distinction) degree in system science and automation from the Indian Institute of Science, India, in 2006 and 2008, respectively. He is currently working toward the PhD degree in electrical and compu- ter engineering at the University of Maryland, College Park. His research interests include computer vision, pattern recognition, signal processing, and biometrics. He was awarded the gold medal for the best outgoing student for his bachelor’s and master’s degrees, respectively. He is also the recipient of the University of Maryland James Clarke Graduate Fellowship for 2008- 2010. He is a student member of the IEEE. Vishal M. Patel received the BS degrees in electrical engineering and applied mathematics (with honors) and the MS degree in applied mathematics from North Carolina State Univer- sity, Raleigh, in 2004 and 2005, respectively, and the PhD degree in electrical engineering from the University of Maryland, College Park, in 2010. His research interests include com- pressed sensing, biometrics, radar imaging, and pattern recognition. He is a member of Eta Kappa Nu, Pi Mu Epsilon, Phi Beta Kappa and a member of the IEEE and the SIAM. 1892 IEEE TRANSACTIONS ON PATTERN ANALYSIS AND MACHINE INTELLIGENCE, VOL. 33, NO. 9, SEPTEMBER 2011](https://image.slidesharecdn.com/ieeeprotechnosolutions-ieeeembeddedprojectsecureandrobustirisrecognition-160128120857/75/Ieeepro-techno-solutions-ieee-embedded-project-secure-and-robust-iris-recognition-16-2048.jpg)